Medicine Group . 2022 March 22;3(3):277-281. doi: 10.37871/jbres1433.
Molecules Absorption Prediction Using Support Vector, Adaboost, Random Forest and Decision Tree Classification
Suprapto Suprapto* and Yatim Lailun Ni’mah
- Classification
- Support vector
- Adaboost
- Random forest
- Decision tree
- Curcumin
Abstract
Classification is supervised machine learning applicable to predict chemicals based on their properties. The chemical properties are derived from its structural and functional groups. Many molecular descriptors have been developed, one of which, was pharmacophore. Pharmacophore is a quantitative measure of molecules in their application as a pharmaceutical ingredient. The training datasets were 59 molecules categorized on their adsorption properties. The classification was carried out to divide the training set into their adsorption class using their pharmacophores. The prediction of enolic curcumin and its degradation product was used to verify the trueness of classification methods based on their pharmacophores. Curcumin and its degradation product were used because there were many studies carried out about curcumin and its pharmaceutical effect.
Introduction
Many chemicals have been synthesized and hypothetically have "drug-like" properties. "Drug-like" compounds can structurally interact with biological molecules such as enzymes in the same way as drugs. There is an idea to test the structural similarities between drug candidate molecules and molecules that have been applied as drugs. One of the compared properties is "pharmacophore" [1,2].
A pharmacophore is a structural abstraction of the interactions between different types of functional groups in a compound. Pharmacophores are described by the spatial representation of the molecule under consideration such as properties of hydrogen bond acceptors, hydrogen bond donors, negative and positive charges, and hydrophobic/lipophilic groups.
Lipophilicity is expressed as the ratio of the molecule's solubility in octanol to solubility in water. These physicochemical properties are related to the absorption of the active substance. Four parameters can be related to the solubility and permeability of molecules in biological systems, namely molecular weight; LogP; the number of H-bond donors, and the number of H-bond acceptors. From observing data sets in the United States Adopted Name (USAN), it was found that molecules with good permeability are molecules that have more than 5 H-bond donors (expressed as the number of OH and NH); molecular weight greater than 500; Log P over 5 (or MLogP over 4.15); have more than 10 H-bond acceptors (expressed as the sum of Ns and Os). Excluding compounds that are substrates for biological carriers [2].
By comparing their pharmacophores, new molecules can be predicted as to whether or not they can act like drugs. The prediction between such data can be done by regression. However, given that some of the pharmacophore parameters are categorical, the regression approach may encounter problems. Another approach that can be used is classification. Classification is a method that processes chemical input characteristics so that the output can separate one class from the others. Classifier training is performed to identify the weights and functions that provide the most accurate separation of the classes of data.
Classification analysis using the decision tree is an example of a classifier that identifies weight based on "yes" and "no" decisions. The decision tree classifies using a tree structure in which the internal nodes represent the characteristics of the data set, the branches represent the decision rules, and each leaf node represents the result.
AdaBoost analysis stands for Adaptive Boosting, which is a boosting technique in the weights of each instance. AdaBoost can be used to improve the performance of learning algorithms, especially for weak learners. The algorithms commonly used with AdaBoost represent single-level decision trees.
Support Vector Classifier and Random Forest Classifier are newer classification approaches to produce more complex subdivisions between two data classes. Support Vector Classifier fits the input data and returns the best fit hyperplane that categorizes the data into the relevant class. By retrieving a hyperplane, a feature can be fed to a classifier to see what the "prediction" class is.
A random forest is a set of decision trees associated with a bootstrap sample set generated from the original data set. Nodes are partitioned based on the entropy or Gini index of the selected feature subset. The bootstrapped subset of the original dataset is the same size as the original dataset. But, each classifier has its advantages and disadvantages. Training using multiple classifiers to make decisions based on the results of all classifiers is one approach to see the suitability of the classification results [3].
The success of the classification algorithm can be measured using performance metrics. Sensitivity and specificity are often used to report the success of computational algorithms. Given that classification is a type of supervised learning, its accuracy can be calculated by comparing the true positive and true negative values of the entire classified data. The area under the curve of the ROC is a nonparametric measure of classifier performance against which classifiers are compared. However, AUC does not perform well when there is a large enough imbalance in the number of samples between the two classes. Accuracy score was applied to define the classification method's performance. The visualization of the confusion matrix true-positive and true-negative was carried out using a heat map to compare the performances of the four classification methods. To verify the accuracy score, in this study, curcumin compounds and their degradation products were performed in comparison to 59 training datasets that have been classified based on their solubility [2,4].
Methodology
In this study, a classification algorithm based on the SkLearn Python library [5] was used. The classification methods compared are Decision Tree Classifier (DTC), Random Forest Classifier (RFC), Support Vector Classifier (SVC), and Adaboost Classifier (ADC). The data set for training consists of 59 molecules with 4 descriptors, namely Moriguchi average log P, the sum of H-bond donors, molecular weight, and the sum of Ns and Os, calculated using RDKit [6]. Classification is used to distinguish molecules based on their absorption or permeation property. The value "Alert" = 0 indicates that the molecule has no problems with absorption and permeability. While "Alert" = 1 indicates that the molecule has poor absorption and permeability.
Results and Discussion
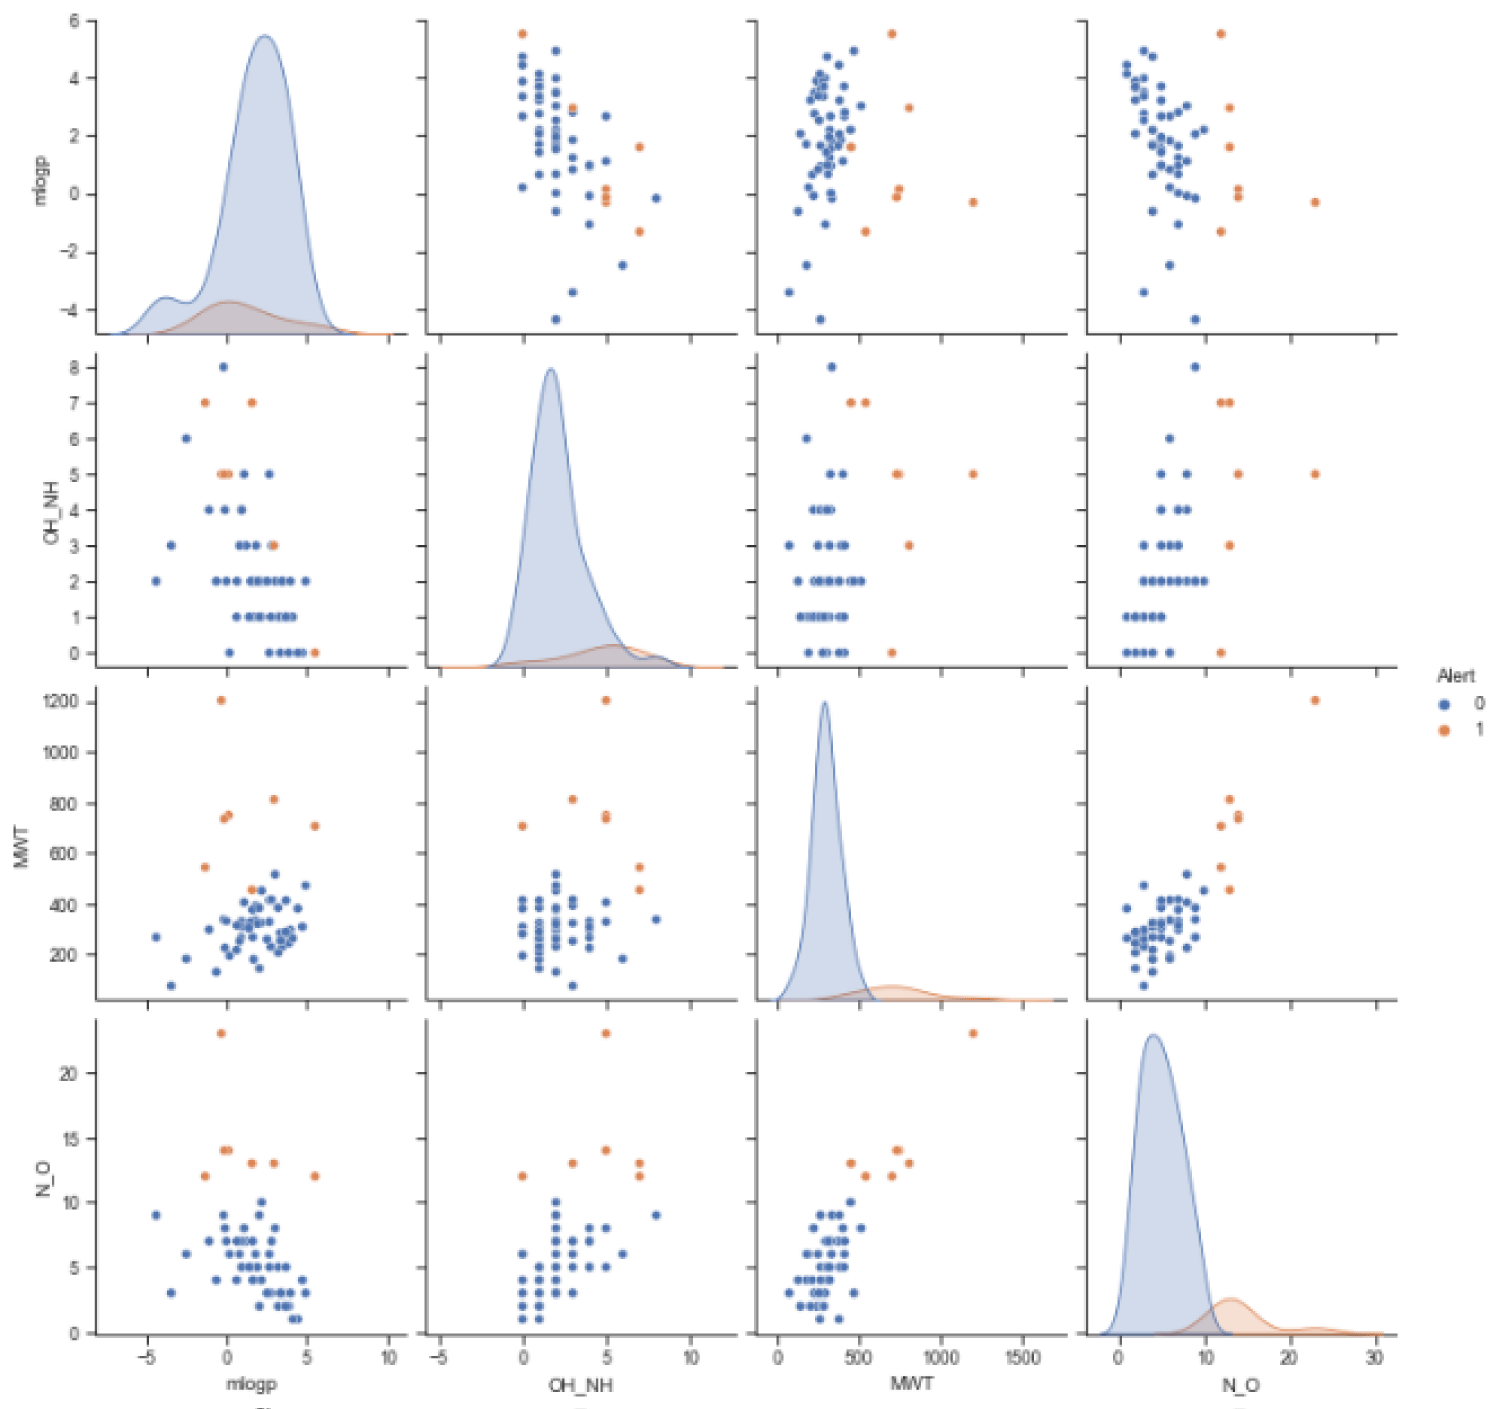
The training set used in this study was molecular data descriptors related to drug absorption published by Yang, et al. [1]. The data set contains 59 molecules, with 52 molecules having no problem in terms of absorption and 7 molecules having problems in terms of absorption. The distribution of the training datasets based on mlogp, the amount of OH_NH, the molecular weight, and the amount of N_O based on the absorption problem was shown in figure 1.
Figure 1 showed that the combination of mlogp cannot distinguish "0" and "1". While the other descriptor combinations can classify '0' and '1' fairly well, especially those involving N_O descriptors. The training datasets consist of 52 data with the ‘0’ category and 7 with the ‘1’ category. Therefore, the accuracy assessment using AUC can be less effective. So, in this study, the classification performances were determined using accuracy scores and visualizing true-positive and true-negative ratios using a heatmap of confusion matrix values.
The SVC method gives an accuracy value of 96.61% with a true positive ratio of 52 and a negative ratio of 5 as shown in figure 2(a). ABC gives an accuracy score of 1.0 with a confusion matrix as shown in figure 2(b). RFC gives an accuracy score of 1 with a confusion matrix as shown in figure 2(c). DTC gives an accuracy score of 1 with a confusion matrix as shown in figure 2(d).
In terms of accuracy, SVC gives the lowest value. However, by looking at the distribution of the data based on figure 1, there may be 2 data that should belong in category "1" but are mixed with category "0" data. To verify this, five molecules of enolic curcumin and its derivatives were computed and their descriptors were calculated. The descriptor used does not include mlogp because the mlogp value from the training data does not contribute to the classification. The descriptors of the curcumin compounds and their degradation products were listed in table 1.
| Table 1: Parameter descriptors of curcumin compounds and their degradation products. | |||||
| No | Name | OH_NH | MWT | N_O | Alert |
| 0 | Enolic Curcumin | 1 | 152.149 | 3 | 3 |
| 1 | Feruloyl methane | 2 | 324.376 | 4 | 4 |
| 2 | Ferulic acid | 2 | 194.186 | 4 | 5 |
| 3 | Ferulic aldehyde | 1 | 178.187 | 3 | 6 |
| 4 | Vanillin | 1 | 152.149 | 3 | 7 |
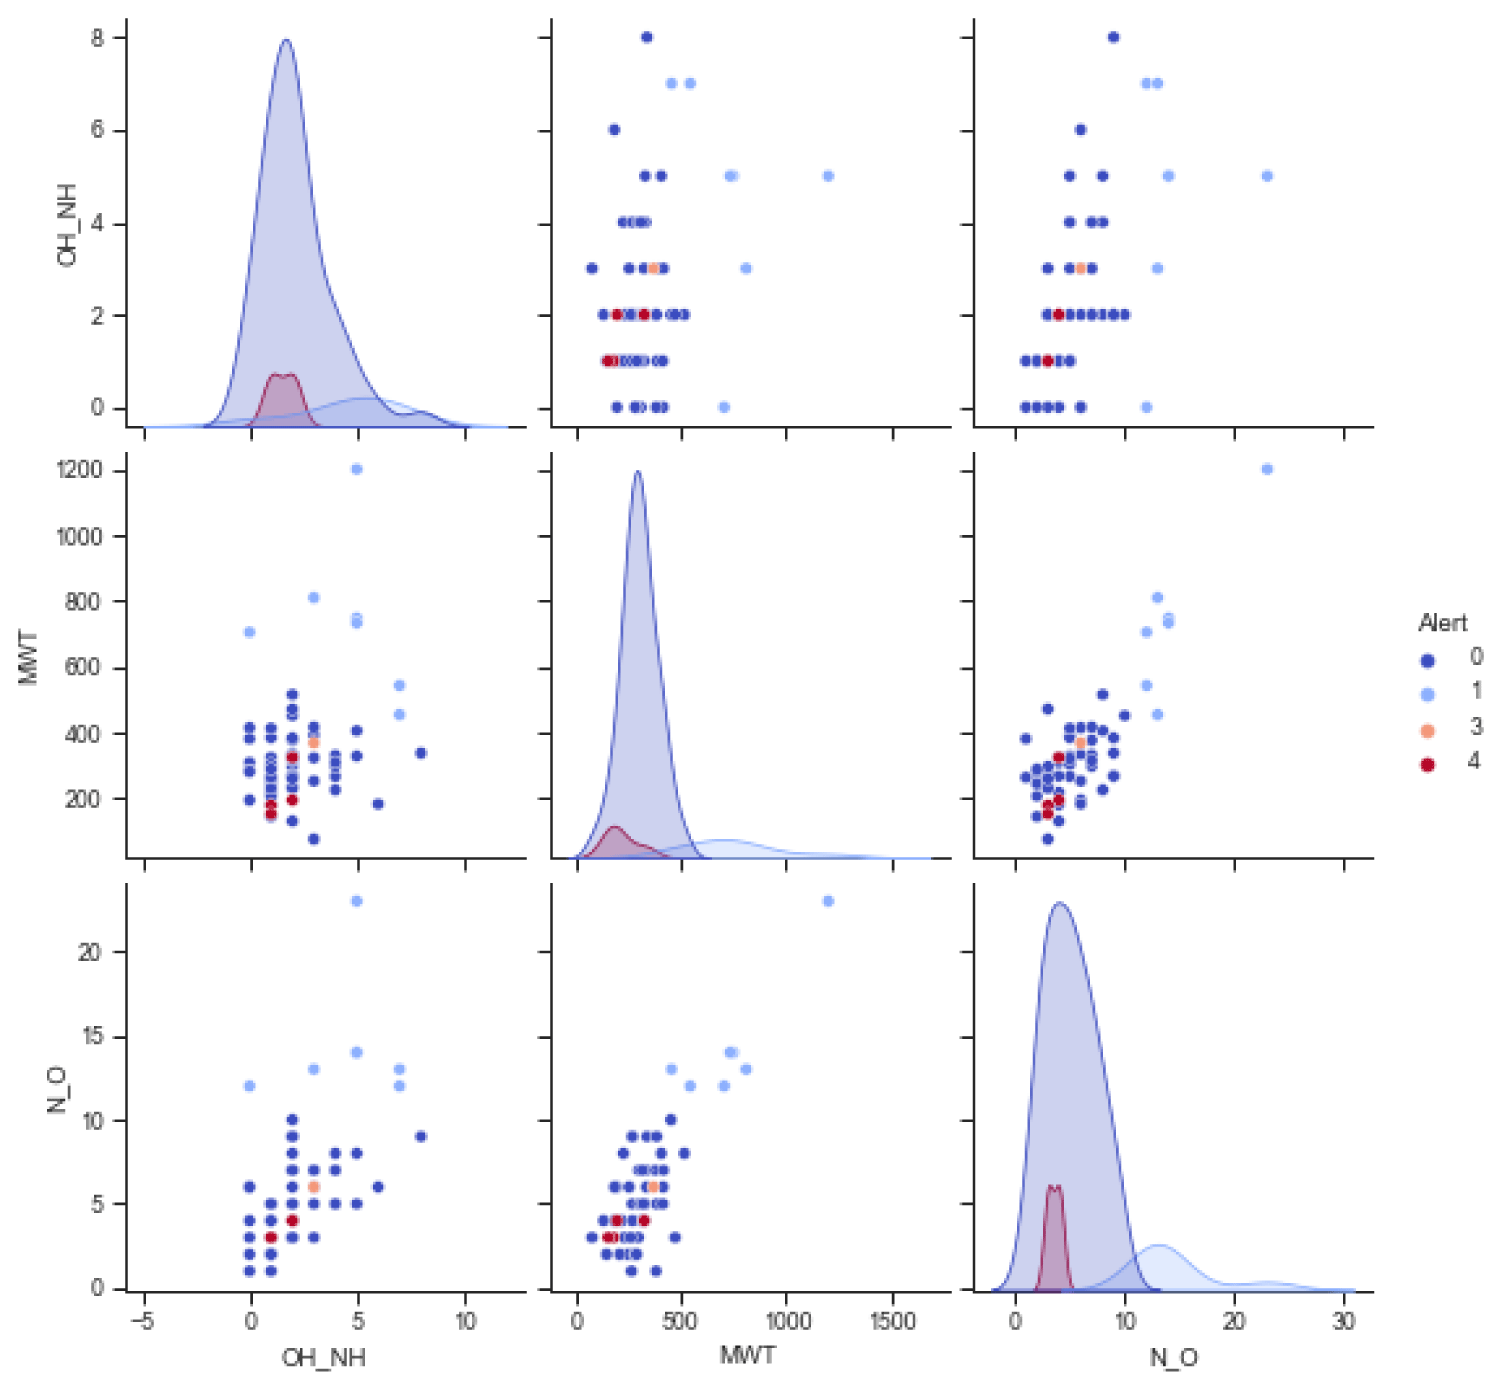
Merging curcumin data and its degradation products into the training dataset reveals that curcumin compounds and their derivatives belong to the category “0” compound group, as shown in figure 3. However, curcumin compounds are labeled differently than the training data for verification purposes, namely, label 3 for curcumin and 4 for its derivatives. The distribution curve of the training data added to the data of curcumin and its derivatives is shown in figure 3.
The classification accuracy of training data plus curcumin data for SVC is 0.890625, ADC=0.921875, RFC=1.0, and DTC = 1.0. These results indicate that classification using RFC and DTC is strongly influenced by data labeling during training. Meanwhile, in addition to looking at the label, the SVC and ADC method also looks at the intrinsic properties of the grouped data. The SVC advantages over other statistical techniques, especially for binary classification [7]. Adaboost uses a stump, a decision tree with only one split. So Adaboost is a stump forest. This stump is a weak learner. These weak learners have high bias and low variance. Stumps use features in a specific order. Each stump is made by taking into account the mistake of the previous stump. The second stump models the errors of the first stump, logs a new error, and propagates it to the third stump, and so on. The key to improving the model is to learn from past mistakes. AdaBoost learns from mistakes by increasing the weight of misclassified data points [8].
Conclusion
RFC and DTC accuracy scores were very good for classification both training datasets and test datasets. However, the high value of this accuracy was related to the overfitting of the RFC and DTC classification models on the label during training. Although SVC and ADC were lower in terms of their accuracy scores, the classifier took into account the intrinsic properties of datasets. Therefore, it can be stated that data groups can be better predicted using SVC and ADC.
References
- Yang SY. Pharmacophore modeling and applications in drug discovery: challenges and recent advances. Drug Discovery Today. 2010;15(11):444-450. doi: 10.1016/j.drudis.2010.03.013.
- Lipinski, Lombardo, Dominy, Feeney. Experimental and computational approaches to estimate solubility and permeability in drug discovery and development settings. Advanced Drug Delivery Reviews. 2021;64:4-17. doi: 10.1016/j.addr.2012.09.019.
- Batten. Classification of chemical compound pharmacophore structures. 83-93. https://tinyurl.com/59uaptcr
- Shen L, Ji HF. The pharmacology of curcumin: is it the degradation products? Trends Mol Med. 2012 Mar;18(3):138-144. doi: 10.1016/j.molmed.2012.01.004. Epub 2012 Mar 1. PMID: 22386732.
- L. Buitinck. API design for machine learning software: experiences from the scikit-learn project. https://tinyurl.com/app/myurls
- Landrum. RDKit: Open-source cheminformatics software. 2016. http://www.rdkit.org/
- Mather, Tso B. Classification methods for remotely sensed data, 2nd ed. Boca Raton: CRC Press. 2009. doi: 10.1201/9781420090741.
- Liu X, Dai Y, Zhang Y, Yuan Q, Zhao L. A pre-processing method of ADA Boost for mislabelled data classification,” in 2017 29th Chinese Control and Decision Conference (CCDC). 2017:2738–2742. doi: 10.1109/CCDC.2017.7978978.
Content Alerts
SignUp to our
Content alerts.
 This work is licensed under a Creative Commons Attribution 4.0 International License.


