General Science . 2022 October 13;3(10):1163-1176. doi: 10.37871/jbres1572.
mRNA Biomarkers for Invasive Breast Cancer based on a Deep Feature Selection Approach
Abeer Alzubaidi1, Jonathan Tepper2, Benjamin Inden3 and Ahmad Lotfi1*
2Perceptronix Ltd, Hilton, Derbyshire, DE65 5AE, United Kingdom
3Diploma University, Am Hegeberg 2, 37242 Bad Sooden-Allendorf, Germany
- Biomarkers
- Invasive breast cancer
- Deep learning
- Feature selection
- Oestrogen receptor
- Progesterone receptor
- Omics data
Abstract
Early detection of breast cancer and effective identification of its correct stage remain major challenges for healthcare professionals. Testing the tumour for Oestrogen Receptor and Progesterone Receptor is a standard part of the initial evaluation of breast cancer diagnosis and treatment planning. Several expression profiling studies have illustrated that the expression of these hormone receptors is linked with diverse genetic variations, which means that several mutated genes can a affect the development and progression of breast cancer and contribute to its heterogeneity. Unfortunately, due to the high dimensionality and low sample size nature of microarray data, traditional statistical feature selection techniques fail to identify genes that could act as risk factors for breast cancer. Inspired by this, we developed a deep learning-based feature extraction module with a weight interpretation method to select a subset of robust biomarkers across three different mRNA expression data sets from The Cancer Genome Atlas program (TCGA). For a discovered feature (a gene) to be accepted for further investigation, it must have been independently selected by the weight interpretation method from each of the deep feature extraction modules (each having been trained on a different data set). The small panel of discovered biomarkers was then subsequently evaluated using a range of classifiers to ascertain their predictive ability with respect to the above hormone receptor status. We observed strong evidence that the upregulation in the expression levels of highly positively weighted genes within the deep feature selection modules and the down regulation in the expression levels of the highly negatively weighted genes both indicated the strong likelihood of a patient experiencing ER+/PR+ invasive breast cancer. In addition, we discovered a number of potentially novel biomarkers worthy of further consideration.
Introduction
Breast cancer is the most common neoplasm in women and the second leading cause of cancer-related mortality in females worldwide [1]. Recognition of breast cancer at early stages can bring better prognosis with a 5-year survival rate of up to 90%. However, when breast cancer spreads to distant organs, then this survival rate declines drastically to 20% [2]. Mammography is the standard tool used for detecting breast cancer [3]. Unfortunately, mammography notably has two key issues, namely a high risk of false positives and the lowered sensitivity of tumour recognition in women with dense breast tissue [4]. Magnetic Resonance Imaging (MRI) offers a powerful alternative and provides excellent imaging, even around dense breast tissues [5]. However, there remains a high risk of obtaining false positives, which could lead to unnecessary invasive and expensive procedures [6].
Oestrogen Receptor (ER) and Progesterone Receptor (PR) are currently the most commonly used method to test the tumour in cancer cells from a sample of tissue. According to the recommendations of the American Society of Clinical Oncology and the College of American Pathologists [7], all newly diagnosed invasive breast patients should be examined for both ER and PR. ER activation plays a significant role in different biological processes, like cell development and cell death [8]. Therefore, for patients with ER-positive (ER+), particular treatments that block the activity of ER are recommended. The mechanism of blocking ER activity relies essentially on changing ER function in a way that the ER is becoming unable to regulate gene expression [9]. According to Carroll [10] ER is a ‘transcription factor that regulates gene expression events that culminate in cell division’. Furthermore, several expression profiling research projects have illustrated that the expression of hormone receptors is linked with diverse genetic variants [11]. Therefore, there is a critical need for more accurate identification of salient molecular indicators that are correlated to the positivity of ER and PR and reliably estimate the probability of disease occurrence and associated outcomes to enable the clinician to apply appropriate treatment stratification.
Omics technologies allow thousands of variables to be examined simultaneously in a biological sample within a single experiment. Thus, they have the potential to detect key molecules that can answer the biological questions of interest so that new treatment strategies and drugs can be provided. However, due to the high dimensionality and small sample size issues, machine learning models applied to this data will have to mitigate against the high risk of becoming too sensitive to the variations in the data used for model fitting and less sensitive to variation in the unseen data during a model evaluation i.e., the models will have to minimise ‘overfitting’ or memorisation of its training data to ensure it can generalise well to unseen data. Subsequently, whilst the model should be endowed with sufficient complexity to detect the complex nonlinear interactions between gene expressions and hormone receptor status, overfitting must be minimised using some form of regularisation of its adjustable parameters to avoid over sensitivity to unimportant nuances of the training data. Over the last 10 years, deep learning approaches have enjoyed considerable success in a variety of omics-related problem domains [12-15].
Deep learning is a general term that refers to the development, optimisation and application of artificial neural networks [16,17] that possess many hidden layers of nonlinear processing elements that transform the original omics input data into hierarchical abstract representations well-suited to the omics task at hand. Typically, these hidden layers project higher dimensional spaces onto lower dimensional spaces. These type of networks are referred to as ‘deep neural networks’ (or more simply, ‘deep nets’) and with their hierarchical abstract representations perform a type of automatic data pre-processing and have provided cutting edge performance and insights. Unfortunately, due to nested layers of nonlinear transformations of the original input signal, deep nets lack inherent transparency and are considered to be a ‘black box’ approach. In addition, there appears to be little consensus in the literature as to how to interpret these complex internal representations underlying deep net behaviour [18]. This makes it very difficult for clinicians and other stakeholders to trust their deep learning models even though the model predictions appear to be highly accurate.
In this paper, we employ a promising new deep knowledge discovery model, defined by Alzubaidi, et al. [19], with two fundamental components: i) a type of deep net referred to as a Stacked Sparse Compressed Auto-Encoder (SSCAE) that generates hierarchical abstract representations of the raw mRNA expression data; and ii) an effective weight interpretation method that determines the salient input genes that underlie the abstract and compressed representations formed by SSCAE. To avoid over fitting, SSCAE uses a regularization term constraining the formation of its hidden state to promote under-complete representations during learning. The weight interpretation method endows the system with a robust means to perform deep feature selection by analysing the magnitude of the weights within SSCAE. To evaluate the predictive quality of the selected genes, we apply an array of classifiers to map a selected subset of input genes to the associated ER and PR status of subjects. For a discovered gene to be accepted as input to a classifier, our deep feature selection model must have independently selected this gene from across all three separate mRNA expression data sets sourced from The Cancer Genome Atlas (TCGA) program. Few studies in the literature have based selection of genes on their persistence across multiple datasets, despite the abundance of publicly available data, thus limiting the evaluation of the predictive quality of their discovered genes. This validation requirement is significant and supported by Tayer, et al. [20] who state, “External validation using data from a completely different study provides the highest irrefutable evidence that a tool validates”. The three data sets used in our research are the following breast invasive carcinoma datasets: (TCGA Nature 2012), (TCGA Cell 2015) and (TCGA Provisional).
This paper is structured as follows: Section Materials and Methods explains the three TCGA datasets used and provides an overview of our deep feature selection approach, along with the evaluation and validation metrics that will be applied to estimate the robustness of the discovered biomarkers; Section Results presents the results observed from our experiments followed by Section Discussion where the empirical outcomes and significance of our findings are discussed. Finally, pertinent conclusions are drawn in the Conclusions section.
Materials and methods
Datasets collection and preparation
We utilised three breast invasive carcinoma datasets that originated from TCGA [21], which were downloaded from cBioPortal [22], with the goal of identifying genes that are highly predictive for the status of ER and PR over a wide range of independently generated breast cancer samples. We applied a range of filtering methods based on variance and entropy criteria to filter out the genes that produce uninformative signals, thus the genes with a variance and low entropy expression less than the 10th percentile were removed from the analysis. A more detailed discussion of these rudimentary filtering methods can be found [23].
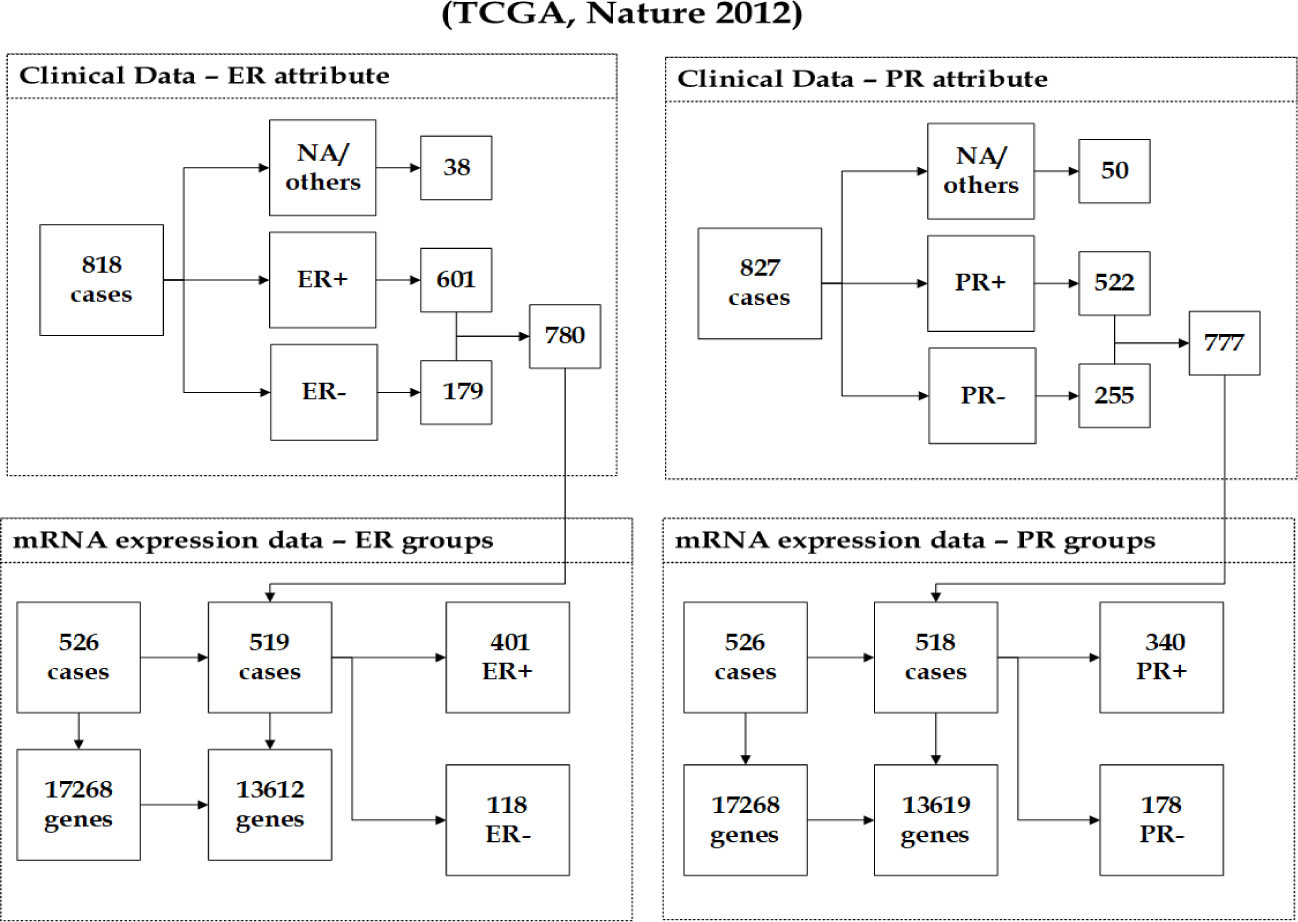
Breast invasive carcinoma (TCGA, Nature 2012): This dataset [24] originated as part of the TCGA program. The cancer study identifier is brca tcga pub, where its name is Breast Invasive Carcinoma (TCGA, Nature 2012). Note that various genomic and clinical datasets are included in the (TCGA Nature 2012) data. We focused on the mRNA expression data, which was derived using Agilent microarray and contains 17268 genes from 526 observations. The response groups are ER Status and PR Status. The samples with missing values/others (e.g. Performed but Not Available, Not Performed, Indeterminate) in both response groups were removed from the analysis as illustrated in figure 1. The integration of the mRNA expression data and ER clinical data, which has 780 observations, resulted in a dataset of 519 observations. According to the group distribution, 401(77.26%) being samples with ER+ tumours, and 118(22.74%) being ER- samples. The unification of the mRNA expression data and PR clinical data, which has 777 observations, resulted in a dataset of 518 observations, 340(65.64%) being patients with PR+ tumours, and 178(34.36%) being PR- samples. Each mRNA sample contains 17268 genes. The filtering methods mentioned filtered out the less reliably expressed genes from mRNA expression data. The number of remaining genes in the (TCGA Nature 2012) dataset with ER groups is 13612 and 13619 with PR groups. Figure 1 illustrates the number of mRNA samples before and after the unification with the ER and PR clinical data, ER and PR group distribution across samples, and the number of mRNAs before and after performing the filtering methods.
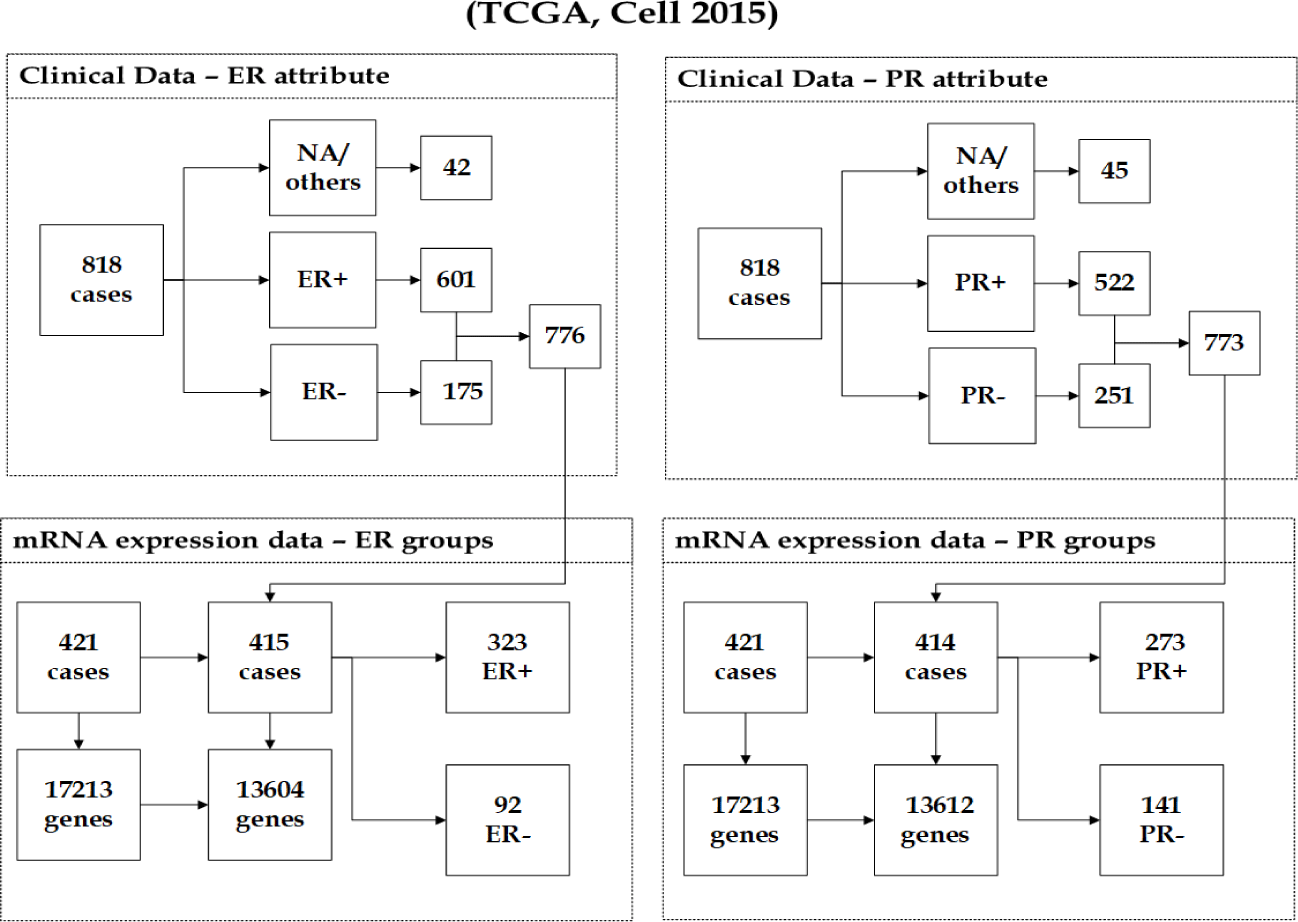
Breast invasive carcinoma (TCGA, Cell 2015): This dataset [25] originated as part of the TCGA. The cancer study identifier is brca tcga pub2015, and its name is Breast Invasive Carcinoma (TCGA, Cell 2015). Different genomic and clinical datasets are involved in the (TCGA Cell 2015) data. We again focused on the mRNA expression data, which was carried out using Agilent microarray and contains 17213 genes from 421 observations. The samples with missing values/others (e.g. Not Avail- able, Indeterminate) in both response groups ER and PR were removed from the analysis, as explained in figure 2. The integration of the mRNA expression data and ER clinical data, which contains 776 observations, resulted in a dataset of 415 observations. According to the group distribution, 323(77.83%) are patients with ER-positive tumours, and 92(22.17%) are ER- samples. The unification of the mRNA expression data and PR clinical data, which has 773 observations produced a dataset of 414 observations, in which 273(65.94%) are PR+ patients, and 141(34.06%) are PR- samples. The number of the remaining genes of the mRNA expression dataset after applying the filtering methods is 13604 genes with ER groups and 13612 genes with PR groups as shown in figure 2.
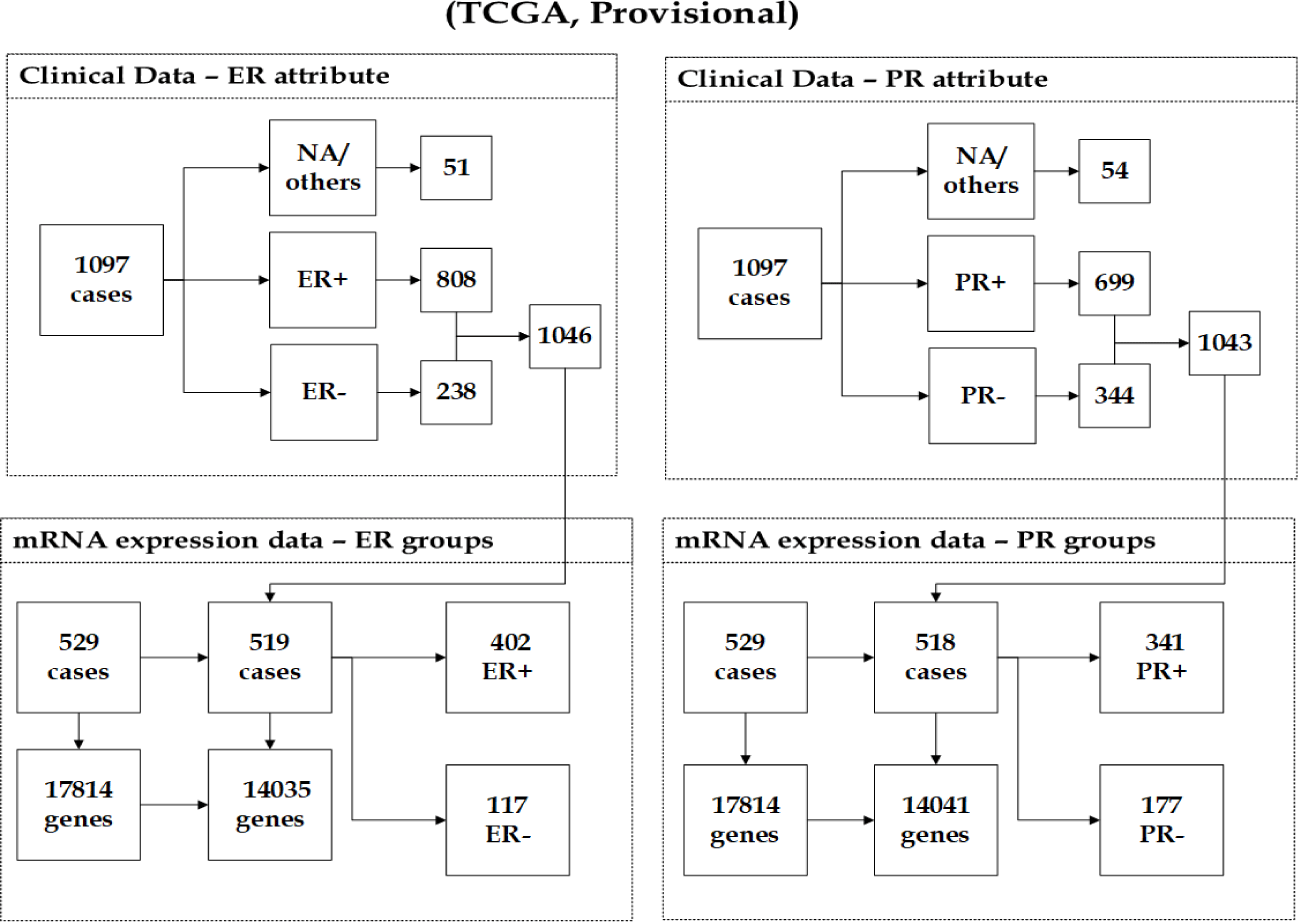
Breast invasive carcinoma (TCGA, Provisional): This dataset [26] originated as part of the TCGA. The cancer study identifier is brca tcga, and its name is Breast Invasive Carcinoma (TCGA, Pro- visional). Diverse genomic datasets are involved in (TCGA Provisional) data, including copy number alterations, gene mutation, mRNA and protein expression, clinical and pathological data. We again focused only on the mRNA expression data, which was carried out using Agilent microarray and contains 17814 genes and 529 observations. The samples with missing values/others (e.g. Not Available, Indeterminate) in both response groups ER and PR were removed from the analysis, as shown in figure 3. The integration of the mRNA expression data and ER clinical data, which has 1046 observations resulted in a dataset of 519 observations. According to the group distribution, 402(77.46%) tumours were derived from ER+ samples, and 117(22.54%) tumours were derived from ER- samples. The unification of the mRNA expression data and PR clinical data, which contains 1043 observations produced a dataset of 518 observations. The number of cases that were derived from patients with PR+ tumours is 341 out of 518, so the percentage of positives is 65.83%, while 177(34.17%) tumours were derived from PR- samples. After performing the filtering methods, the number of remaining genes of the mRNA expression dataset is 14035 genes with ER groups and 14041 genes with PR groups. Figure 3 illustrates the number of genes and mRNA samples before and after the pre-processing step, along with the distribution of both ER and PR groups across samples.
A Deep feature selection approach
Our deep feature selection model is centered on a Stacked Sparse Compressed Auto-Encoder (SSCAE) that generates hierarchical abstract representations of the raw mRNA expression data; and an effective weight interpretation method for selecting the salient input genes underlying these representation based on the magnitude of SSCAE’s weights.
SSCAE representations are formed by recursively auto-encoding the hid- den layer of an array of Sparse Compressed Auto-Encoders (SCAE) in a sequential fashion, where the hidden layer of one SCAE feeds as input into the next SCAE, to form deep, progressively more abstract, non-linear representations of the original input genes, whilst contracting the noise. SSCAE is constructed in a supervised approach based on the Scaled Conjugate Gradient (SCG) optimisation method [27] and the Cross-Entropy (CE) function, and as follows:
(1)
where n is the number of the observations, k is the number of the groups, tij is the ijth element of the group matrix, which is k × n matrix, and yij is the ith output when the input vector is xj. The SCAE is developed using an unsupervised approach based on SCG back propagation method [27] and a Mean Squared Error (MSE) function, which is formulated as follows:
(2)
The impact of the weight regulariser is controlled in the cost function over the layers L and the number of genes k using λ. L2 regularisation term is illustrated in equation 3.
(3)
The impact of the sparsity regulariser is controlled in the cost function using β. The sparsity regulariser is illustrated in equation 4.
(4)
where is the average activation of hidden neuron i over a set of learning observations and ρ is the sparsity parameter, which is a small value close to zero. Consequently, superfluous input genes attract weightings close to zero, whilst the statistically significant genes are weighted such that they are able to meaningfully influence and activate the hidden units to which they are connected. This type of automatic filtering of the input allows for statistically robust and generalisable models to be produced. A series of cross-validation experiments were conducted to estimate the performance of the SCAEs and select the best module, based on the validation performance. The resulting SSCAE model consisted of four modules of size of 500, 200, 100, 50 respectively. The layer that captures the most abstract features (the layer with 50 hidden nodes) is provided as input to the softmax classification layer, which is constructed in a supervised fashion, based on the SCG optimisation method [27] and the (CE) function, as presented in equation 1. The response groups of the utilised breast cancer datasets were represented in the output layer coded as 0 for Negative Oestrogen Receptor/ Progesterone Receptor (ER-)/(PR-) and 1 for Positive Oestrogen Receptor/Progesterone Receptor (ER+)/(PR+).
The value of integrating a set of neural Auto-Encoders in this way is that it helps to alleviate the issue of vanishing gradients and poor initial starting conditions associated with deep nets. However, a fundamental issue with the deep learning paradigm is their inability to unambiguously state which input genes are responsible for its behaviour. To that end, we attempt to alleviate this weakness by introducing a novel weight interpretation method that deconstructs the mechanism of SSCAE and open its black box for the goal of deep feature selection [18]. The weight of each gene represents its contribution through the SSCAE, in which the gene that has a larger positive or negative weight exhibit a greater impact on the output (i.e. ER Status, PR Status). The Input Weight matrix, IW, of the SSCAE is d′ × d, where d corresponds to the dimension of the input x and d′ corresponds to the dimension of the code representation y(1). The Layer Weight matrix, LWi, of layer l(i) of the SSCAE is d′ × d, where d corresponds to the dimension of y(i−1) and d′ corresponds to the dimension of y(i), and for L layers of the SSCAE. Therefore, leveraging the IW matrix with the LWs matrices results in the importance of each gene being calculated as follows:
(5)
where, DM is a d × 1 weight vector and d refers to the number of original genes in the utilised mRNA expression datasets. This means that each gene has an integrated weight score that corresponds to the relevance of this gene to the clinical outcomes ER or PR. The weight vector DM of the training sets of (TCGA Nature 2012), (TCGA Cell 2015) and (TCGA Provisional) datasets within our cross-validation regime resembles a normal distribution, as shown in figure 4. Furthermore, the histogram plots of the breast cancer datasets in figure 4 show that a small proportion of the genes has a High Positive (HP) or High Negative (HN) weight score. As we mentioned previously, assigning a larger positive or negative weight score to a gene reflect its importance on the outcomes of that model. Consequently, two sets of HP and HN weighted genes are produced with a length of the bottleneck code. To examine the consistency of the deep feature selection approach over the training subsets, k weight vectors DMs are obtained within cross-validation. The k identified lists of HP and HN weighted genes are examined to identify two consistent subsets of genes with HP and HN weight. The robust subsets of HP weighted genes are then examined to detect generic mRNA signatures across the different breast cancer datasets. Simultaneously, the discovered subsets of generic genes with HN weight are investigated further to detect generic biomarkers across the cancer genomic datasets.
Validation criteria
For the discovered mRNA biomarkers to be considered valuable. They must be capable of distinguishing those patients with ER+/PR+ invasive breast cancer and those without to a high degree of accuracy. To evaluate the predictive value of the selected genes, we employed two powerful yet relatively rigid classification models: Support Vector Machine (SVM) [28], and Bagging Decision Tree (BDT) [29]. The Area Under the Curve (AUC) of the Receiver Operating Characteristics (ROC) was utilised for estimating the predictive performance of the learning methods. The AUC metric used here measures the overall quality of the prediction systems with 0.99 confidence level. Furthermore, we investigated how the variations in the training sets affected the feature preferences of the deep SSCAE model. Thus, a repeated 5-fold cross-validation procedure was utilised to divide each dataset into 5 non- overlapping stratified sets and estimate the generalisation error. To achieve the highest level of validation, the potential of our deep feature selection approach to detect generic mRNA biomarkers was verified using multiple independent datasets, so that the discovered subsets of robust biomarker of the (TCGA Nature 2012), (TCGA Cell 2015) and (TCGA Provisional) datasets were compared to find generic mRNA biomarkers.
Results
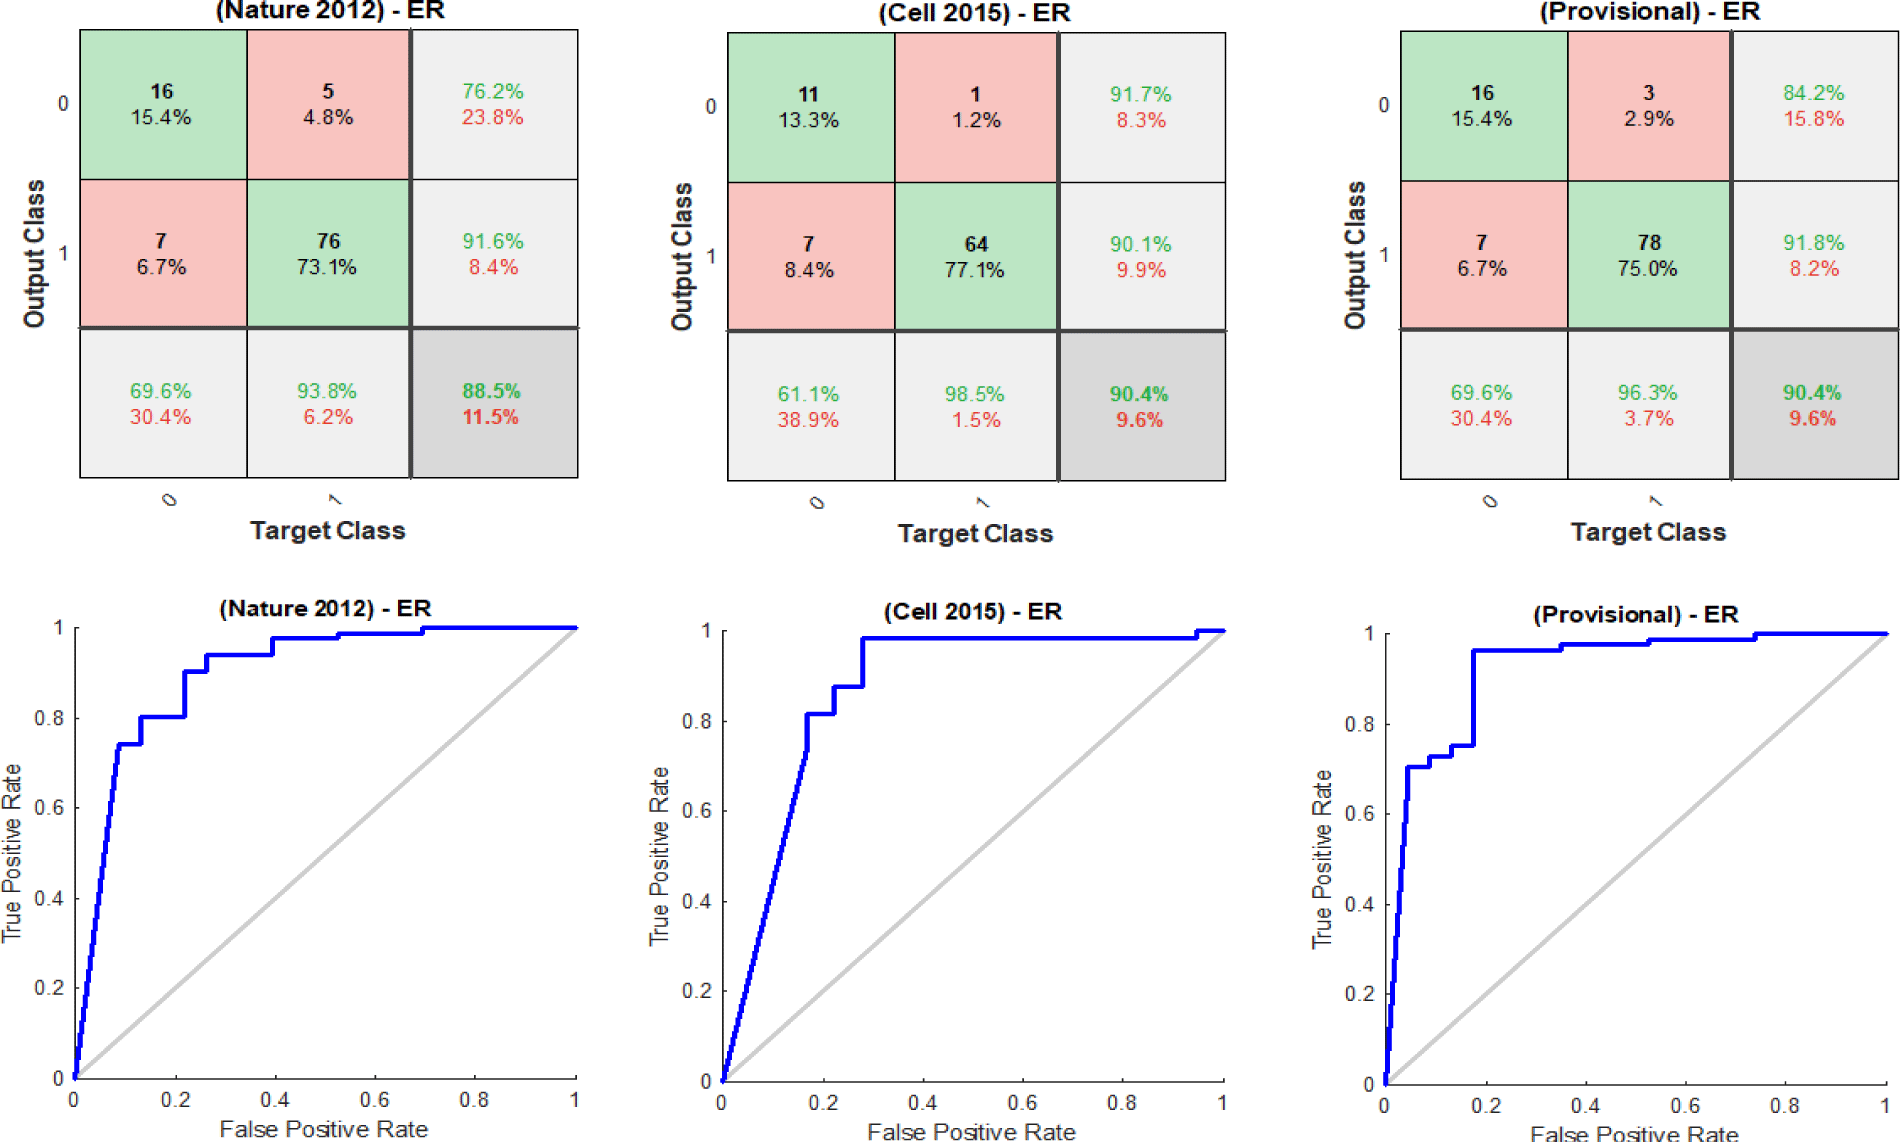
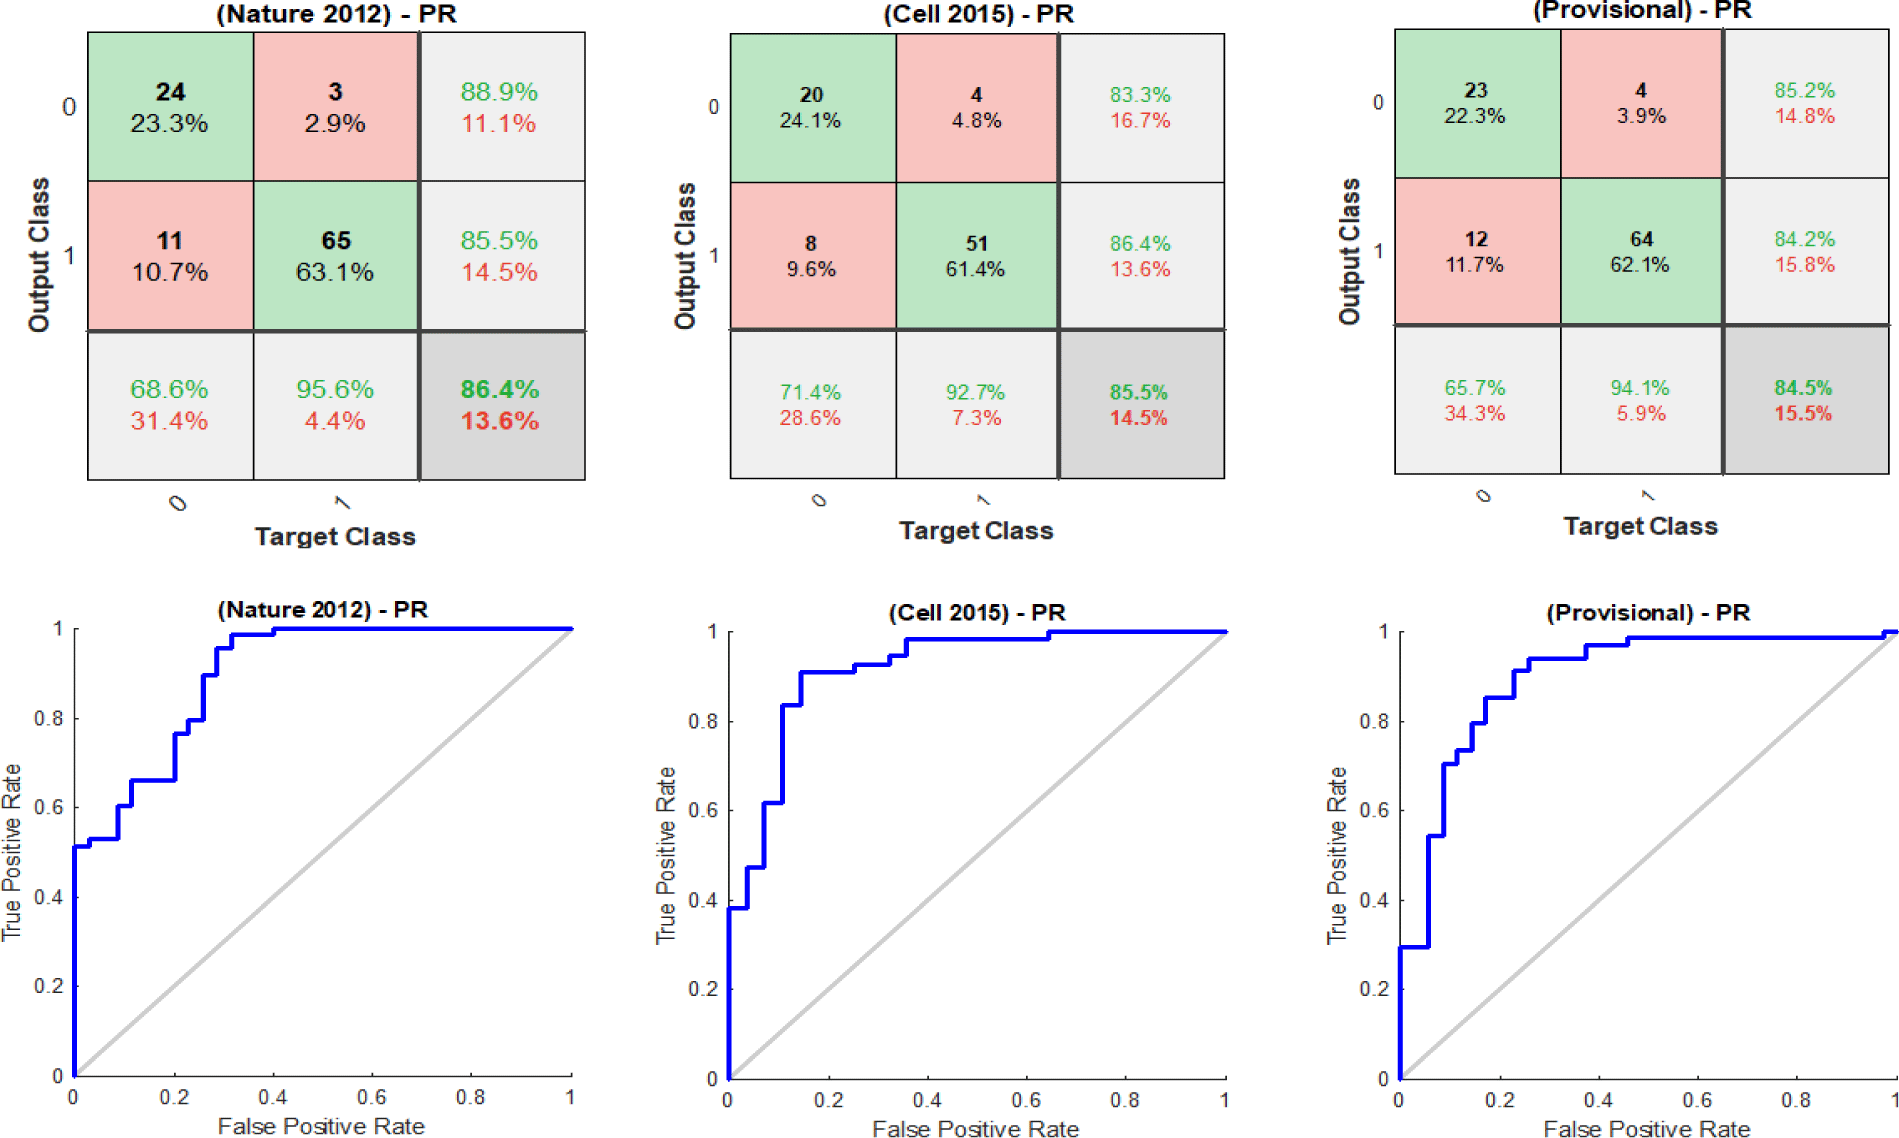
Initially, the 5−fold cross-validation procedure was utilised to divide each dataset randomly into training sets and validation sets, as shown in table 1, with ER and PR groups. The data subsets are stratified so that each set contains approximately the same proportions of response groups as in the original data. The training sets were used to construct the SSCAE, where the corresponding validation sets were utilised to validate its performance, as shown in figure 5 with ER groups and figure 6 with PR groups represented by the confusion matrices and the ROC curve plots of the SSCAE for the final iteration. The average predictive performance of the SSCAE quantified by AUC is shown in table 2. The experimental outcomes revealed that the SSCAE was able to discover highly non-linear and stable representations from the cancer genomic datasets, evidenced by its contribution to the development of reliable classification systems. Furthermore, the performance of each SCAE was validated using the MSE, with the averaged performance of each SCAE shown in table 3.
| Table 1: The sizes of the training-validation sets of the breast cancer datasets with ER and PR groups. | ||
| Dataset with ER | Training Sets | Validation sets |
| (TCGA Nature 2012) | [416, 415, 415, 415, 415] | [103, 104, 104, 104, 104] |
| (TCGA Cell 2015) | [332, 332, 332, 332, 332] | [83, 83, 83, 83, 83] |
| (TCGA Provisional) | [416 415 415 415 415] | [103, 104, 104, 104, 104] |
| Dataset with PR | Training Sets | Validation sets |
| (TCGA Nature 2012) | [415, 414, 414, 414, 415] | [103, 104, 104, 104, 103] |
| (TCGA Cell 2015) | [332, 332, 332, 332, 332] | [83, 83, 83, 83, 83] |
| (TCGA Provisional) | [415, 414, 414, 414, 415] | [103, 104, 104, 104, 103] |
| Table 2: The performance of the SSCAE of the breast cancer datasets with ER and PR groups. | |||
| Dataset with ER | AUC | Dataset with PR | AUC |
| (TCGA Nature 2012) | 0.9404 | (TCGA Nature 2012) | 0.8892 |
| (TCGA Cell 2015) | 0.9406 | (TCGA Cell 2015) | 0.8975 |
| (TCGA Provisional) | 0.9385 | (TCGA Provisional) | 0.8846 |
| Table 3: The average MSE of each SCAE of the breast cancer datasets with ER and PR groups. | ||||
| Datasets with ER | SCAE1 | SCAE2 | SCAE3 | SCAE4 |
| (Nature 2012) | 0.1446 | 0.0160 | 0.0087 | 0.0037 |
| (Cell 2015) | 0.1363 | 0.0147 | 0.0084 | 0.0041 |
| (Provisional) | 0.1368 | 0.0158 | 0.0087 | 0.0040 |
| Datasets with PR | SCAE1 | SCAE2 | SCAE3 | SCAE4 |
| (Nature 2012) | 0.1334 | 0.0158 | 0.0089 | 0.0038 |
| (Cell 2015) | 0.1351 | 0.0147 | 0.0088 | 0.0039 |
| (Provisional) | 0. 1356 | 170.0161 | 0.0088 | 0.0039 |
Results of breast invasive carcinoma datasets with ER groups
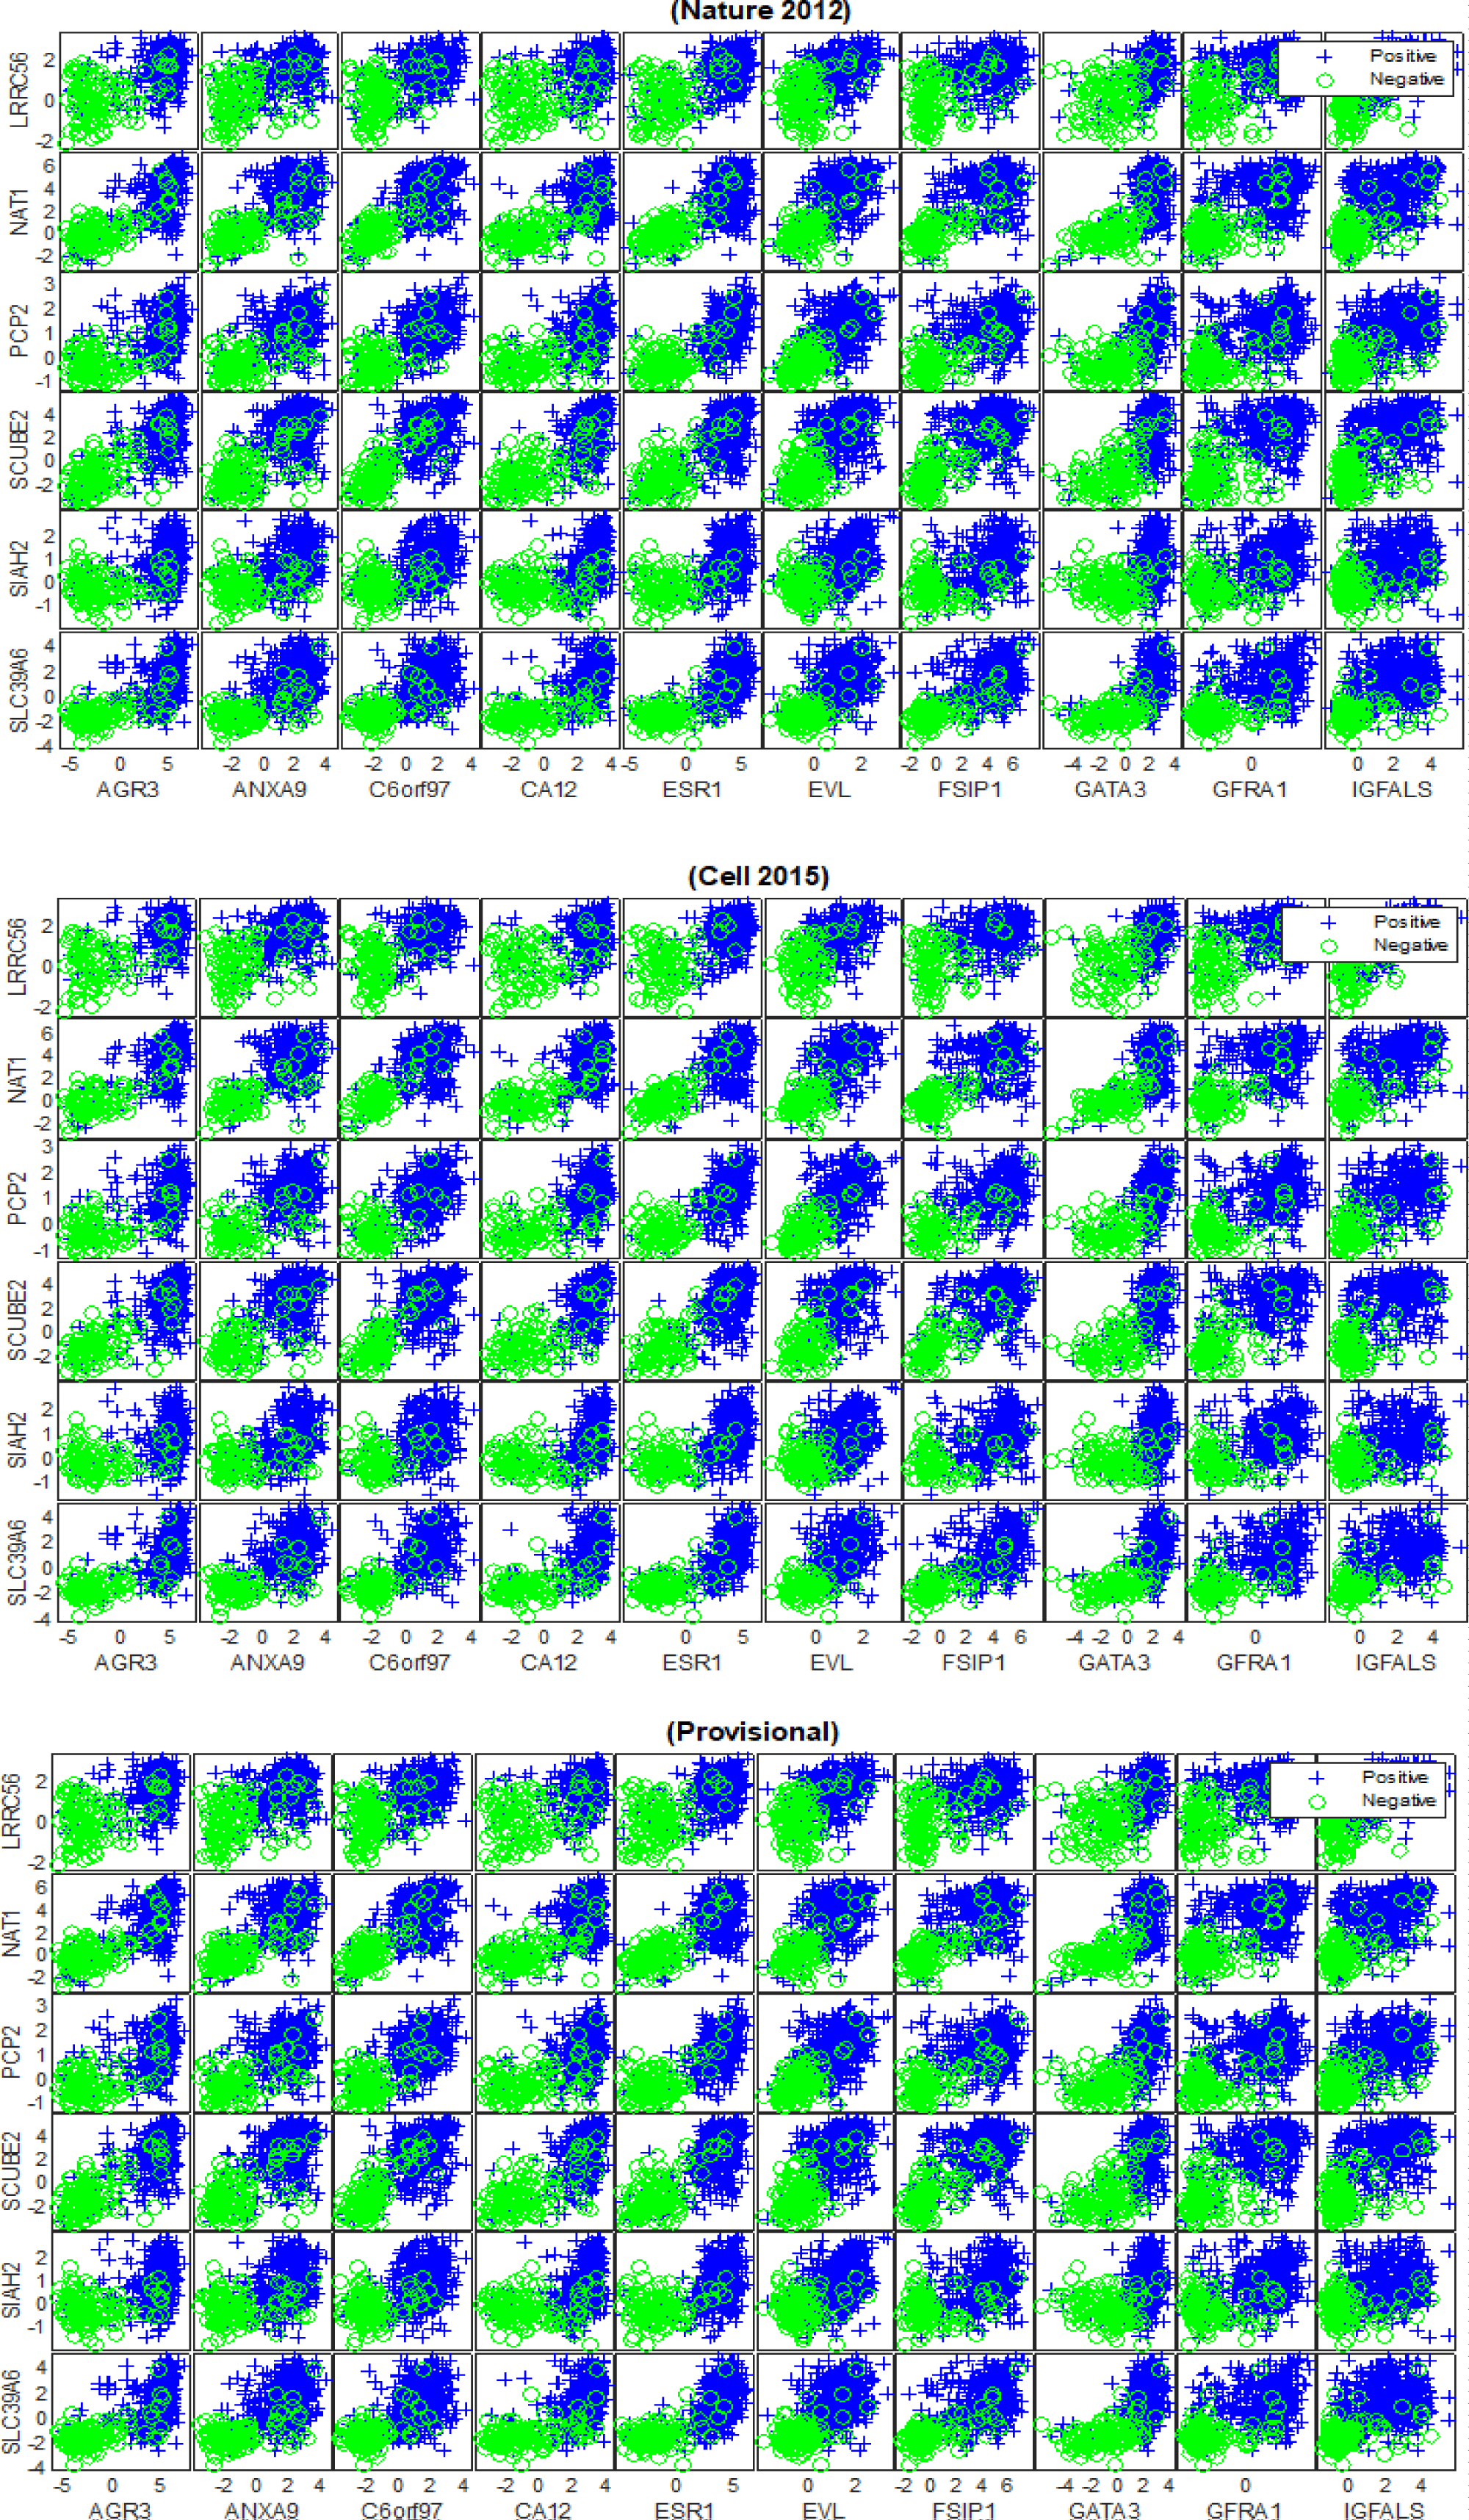
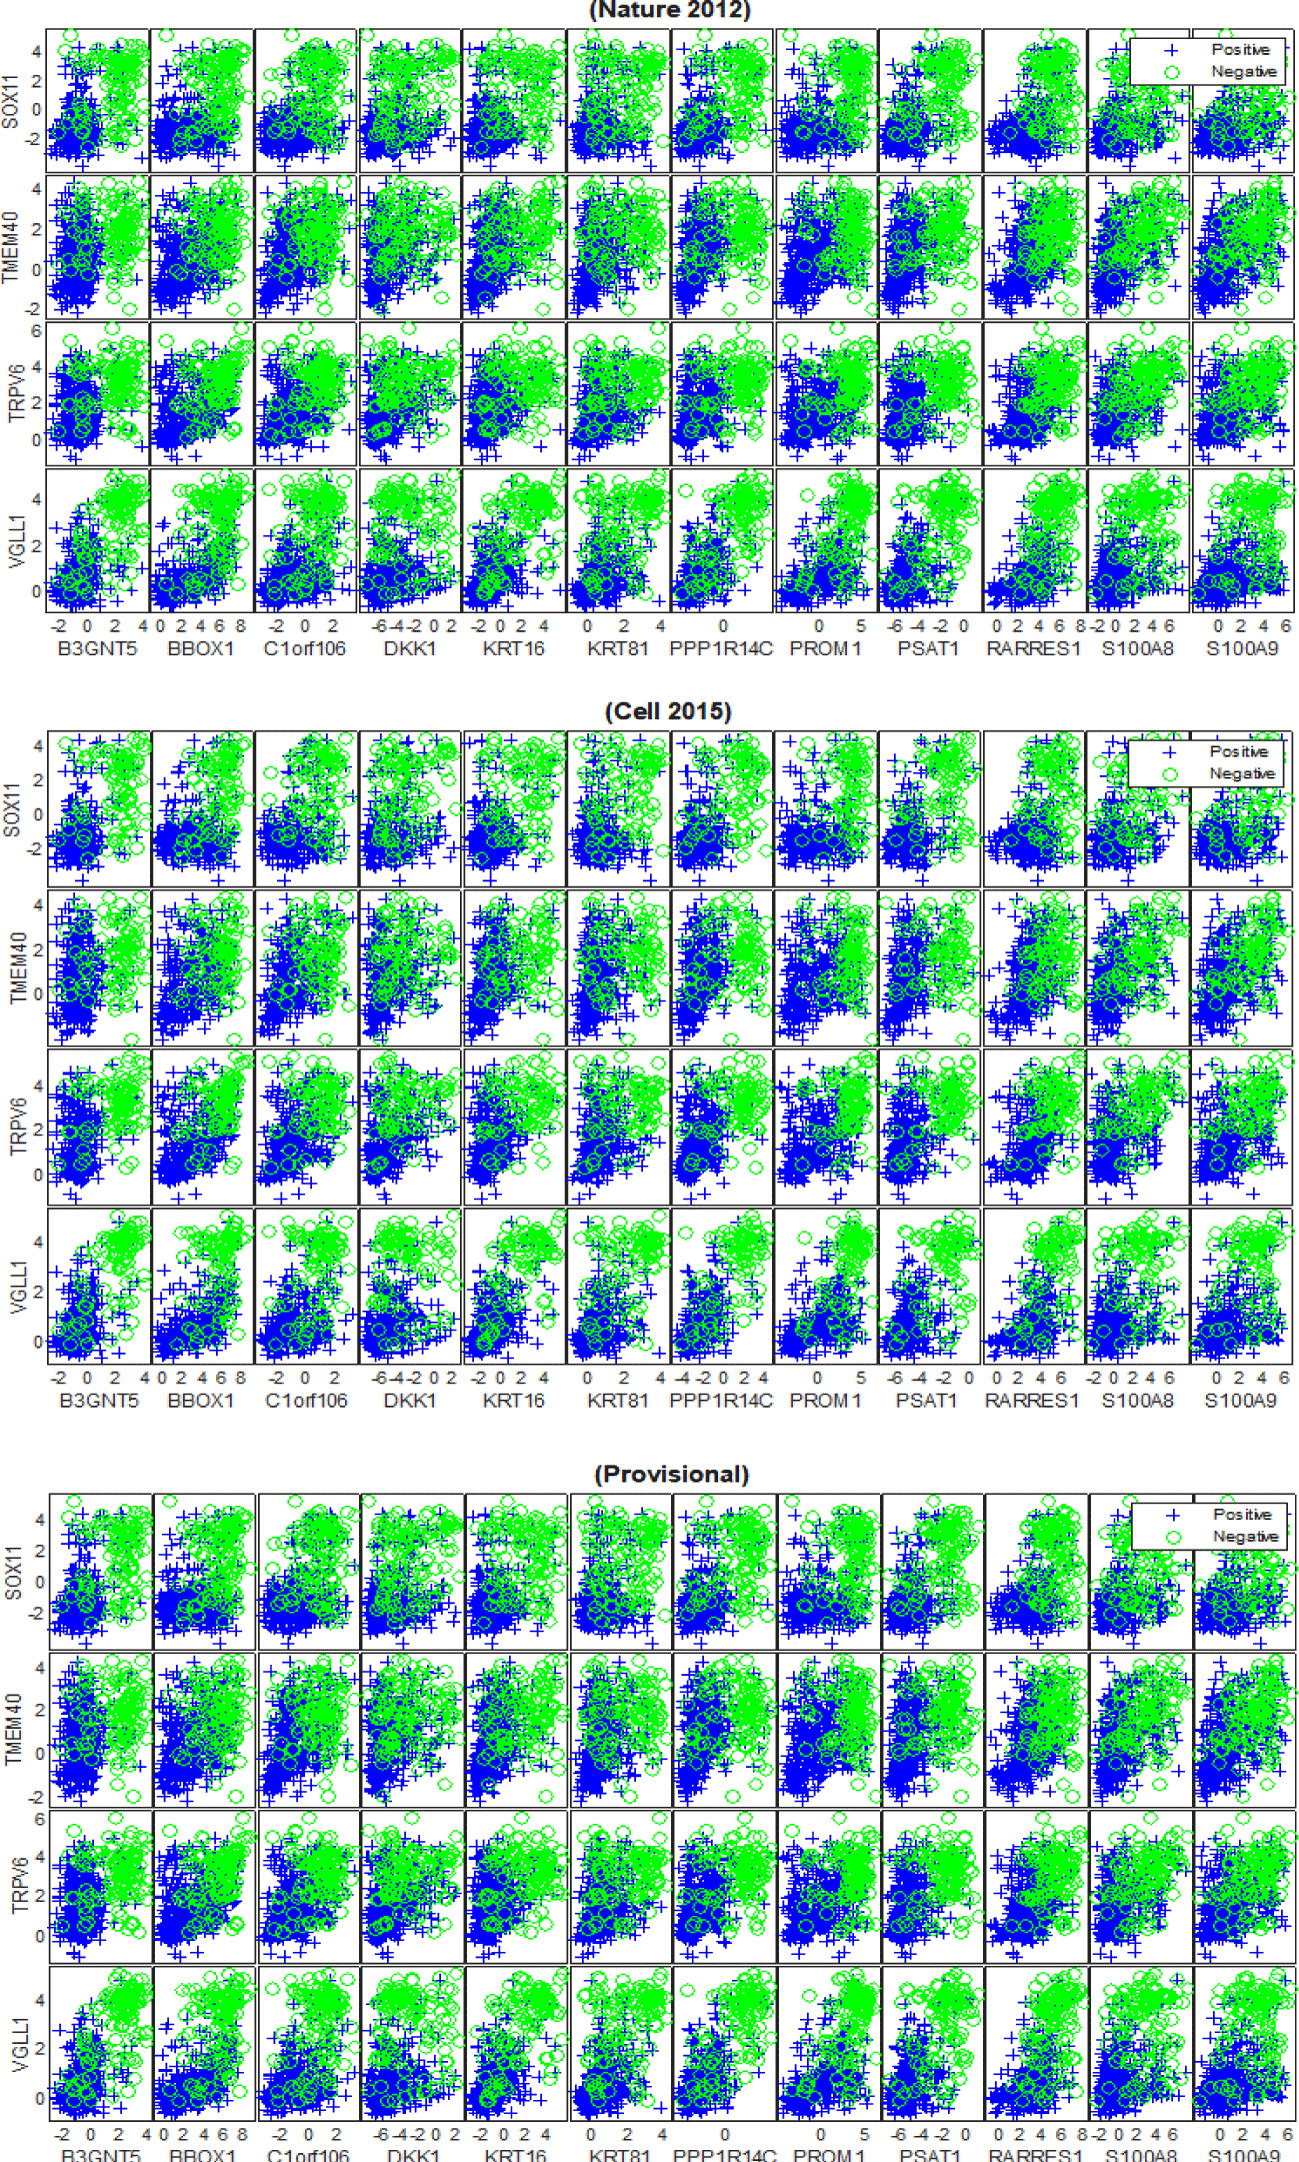
The outcomes of our experiments revealed that 16 mRNA biomarkers with HP weight were found to be generic across the cancer genomic datasets, which are: {‘AGR3‘,‘ANXA9’, ‘C6orf97’, ‘CA12’, ‘ESR1’, ‘EVL’, ‘FSIP1’, ‘GATA3’,‘GFRA1’, ‘IGFALS’, ‘LRRC56’, ‘NAT1’, ‘PCP2’, ‘SCUBE2’, ‘SIAH2’, ‘SLC39A6’}, as shown in figure 7. Furthermore, 16 mRNA markers with HN weight were also found to be reproducible across (TCGA Nature 2012), (TCGA Cell 2015) and (TCGA Provisional) datasets, which are: {‘B3GNT5’, ‘BBOX1’, ‘C1orf106’, ‘DKK1’, ‘KRT16’, ‘KRT81’, ‘PPP1R14C’, ‘PROM1’, ‘PSAT1’, ‘RARRES1’, ‘S100A8’, ‘S100A9’, ‘SOX11’, ‘TMEM40’, ‘TRPV6’, ‘VGLL1’}, as shown in figure 8. Both figures 7 and 8 illustrate the capability of the identified subsets of mRNA biomarkers with HP and HN weight to separate the patients with ER+ tumours from the ER- samples across all of the datasets. The predictivity of the subsets of generic mRNAs to the status of ER was further evaluated individually and collectively using the SVM and BDT classifiers and the average AUC of both models is shown in table 4. The obtained results show that the classification models achieved higher levels of performance when they were trained on the generic biomarkers with HP weight than when they were trained using the generic biomarkers with HN weight. Furthermore, the ensemble subset of the generic biomarkers (i.e. All) has contributed to improving the predictive performance of the BDT model only and for the (TCGA Cell 2015) and (TCGA Provisional) datasets.
| Table 4: The performance of the SVM and BDT models built on the generic biomarkers of the breast cancer datasets with ER groups. | ||||||
| Dataset | SVM-HP | SVM-HN | SVM-All | BDT-HP | BDT-HN | BDT-All |
| (Nature 2012) | 0.9331 | 0.8695 | 0.9304 | 0.9052 | 0.8585 | 0.9034 |
| (Cell 2015) | 0.9340 | 0.8673 | 0.9340 | 0.9177 | 0.8726 | 0.9300 |
| (Provisional) | 0.9388 | 0.8714 | 0.9233 | 0.8847 | 0.8650 | 0.9244 |
Results of breast invasive carcinoma datasets with PR groups
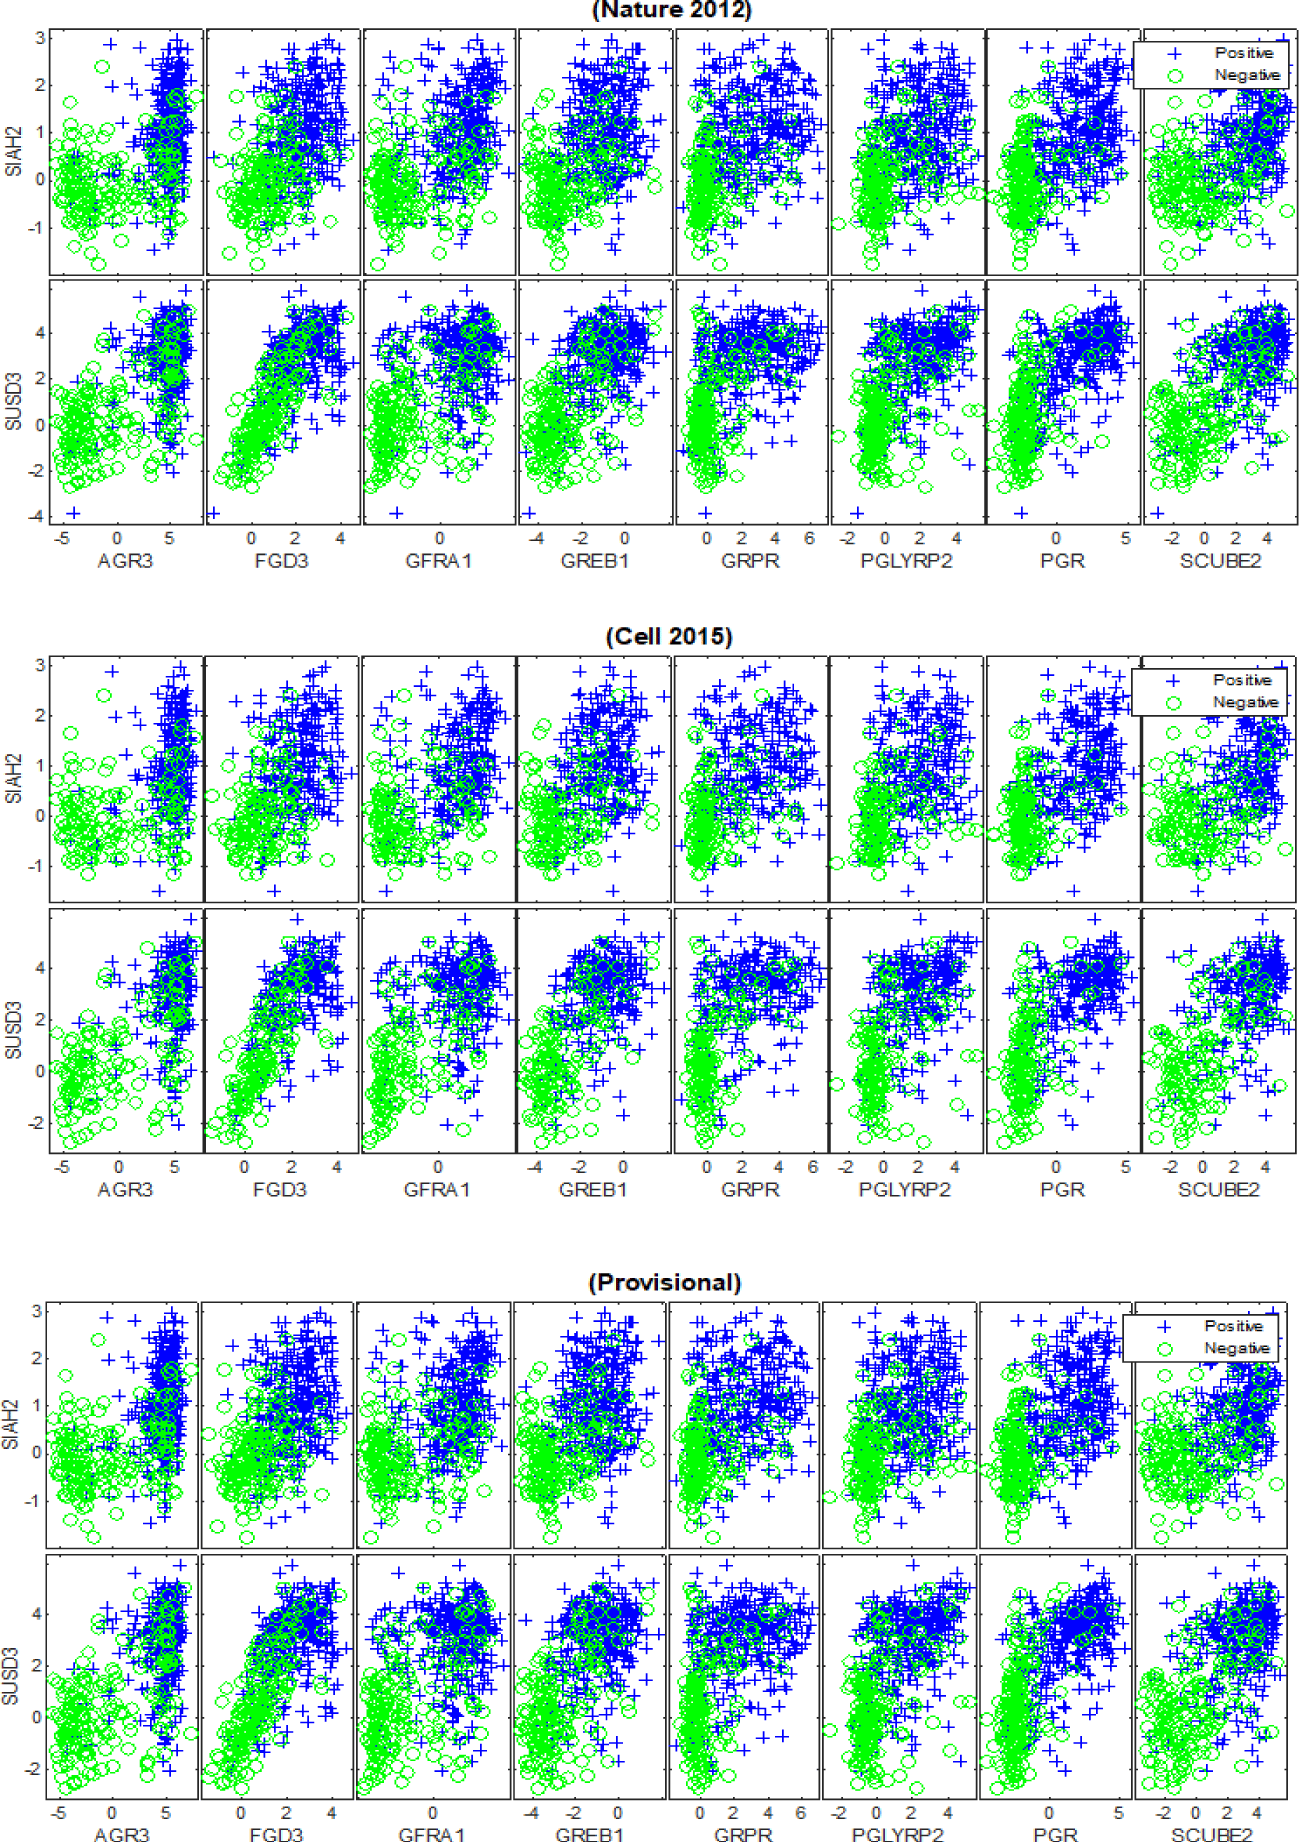
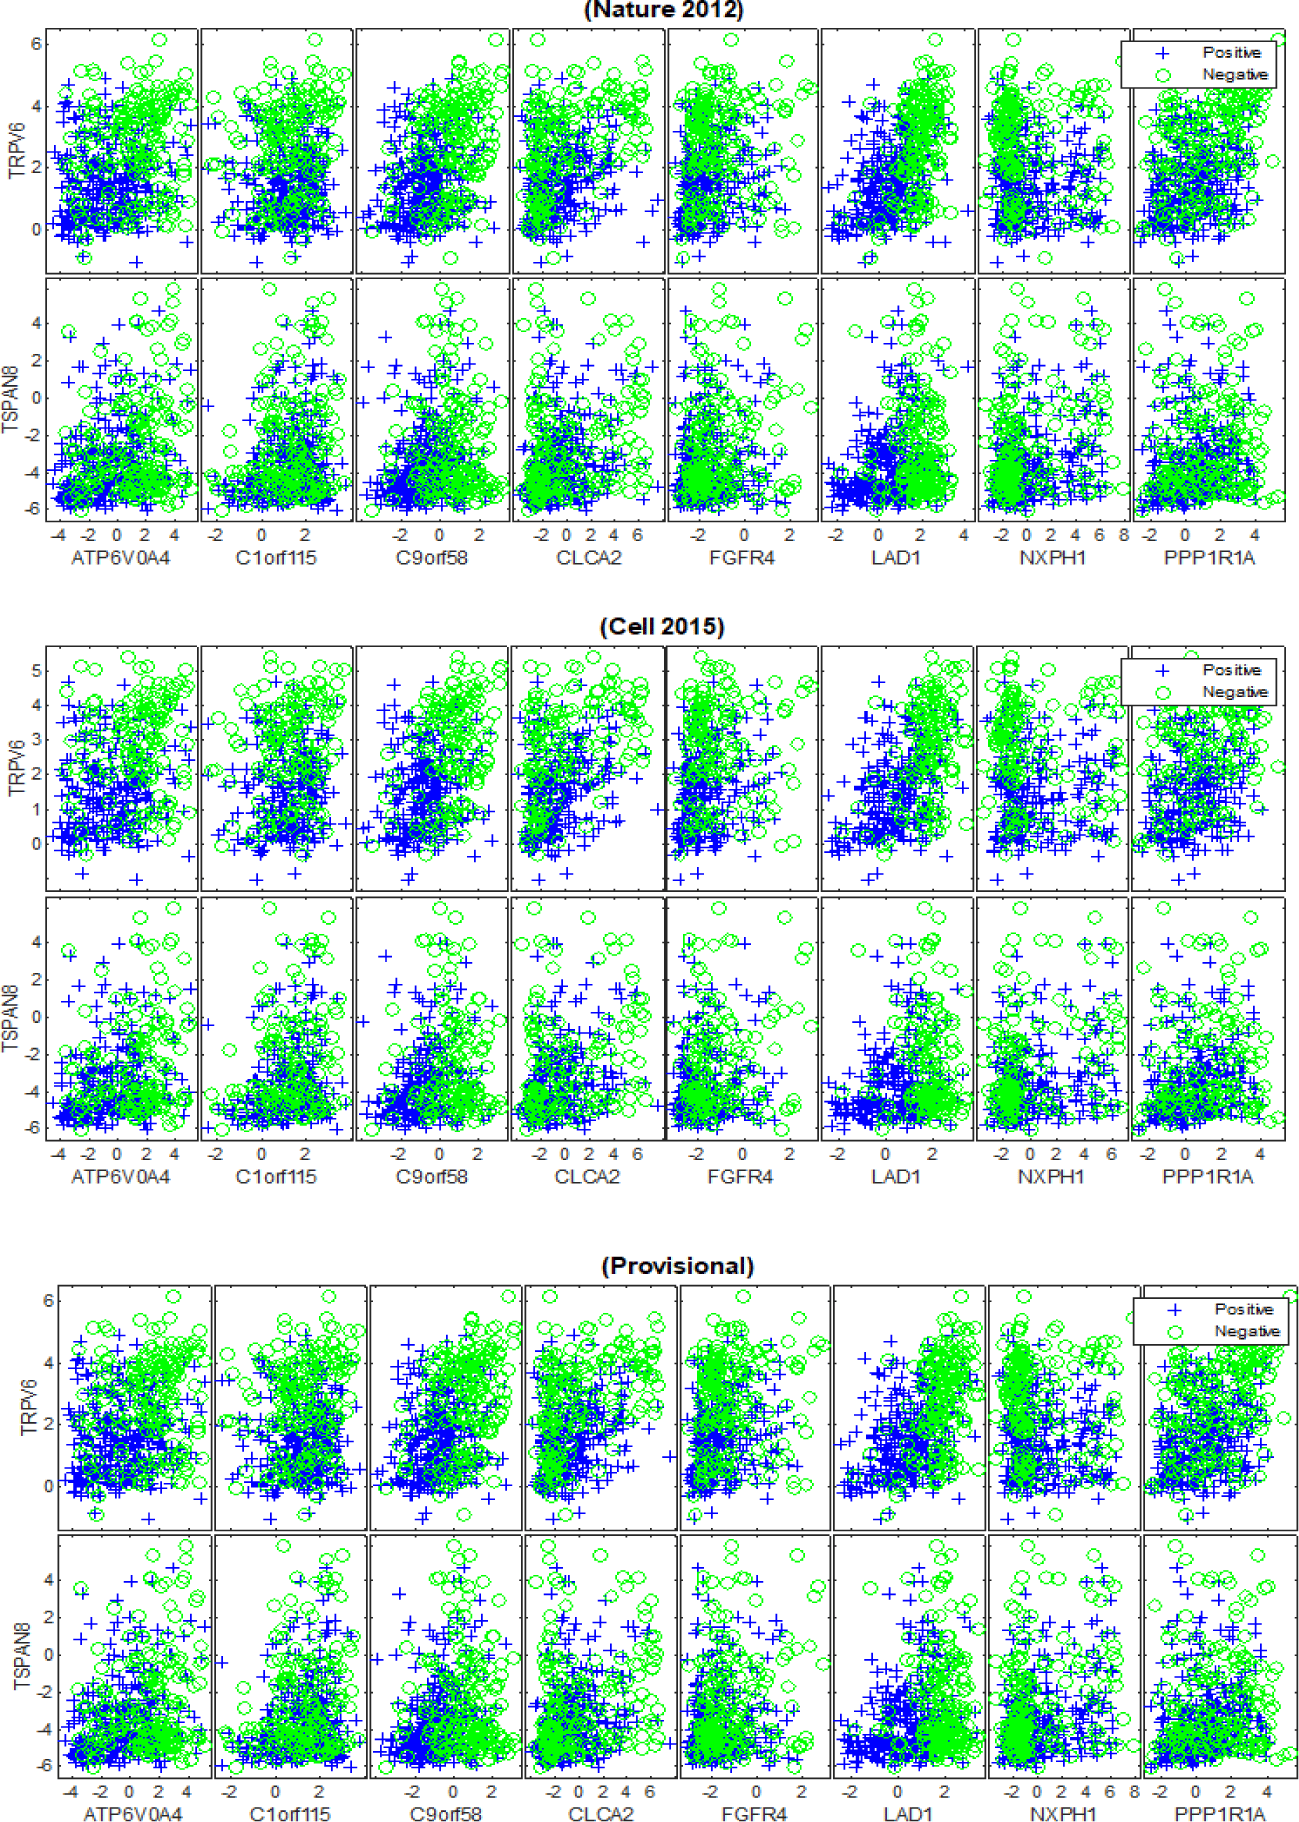
Our deep feature selection model identified 10 relevant mRNA biomarkers with HP weight to the status of PR and across the (TCGA Nature 2012), (TCGA Cell 2015) and (TCGA Provisional) datasets, which are: {‘AGR3’, ‘FGD3’, ‘GFRA1’, ‘GREB1’, ‘GRPR’, ‘PGLYRP2’, ‘PGR’, ‘SCUBE2’, ‘SIAH2’, ‘SUSD3’}, as shown in figure 9. Another 10 generic mRNA markers, but with HN weight were detected across the breast cancer datasets, which are: {‘ATP6V0A4’, ‘C1orf115’, ‘C9orf58’, ‘CLCA2’, ‘FGFR4’, ‘LAD1’, ‘NXPH1’, ‘PPP1R1A’, ‘TRPV6’, ‘TSPAN8’}, as shown in figure 10. Both figures 9 and 10 illustrate how the subsets of discovered mRNA biomarkers with HP and HN weight can distinguish the patients with PR+ tumours from the PR-negative samples across all of the datasets. The predictive power of the discovered biomarkers was further verified using the SVM and BDT classifiers and the average AUCs are shown in table 5. The outcomes of our experiments show that the SVM and BDT classifiers also achieved higher levels of performance when they were trained using the HP weighted biomarkers than when they were trained using the generic biomarkers with HN weight. Furthermore, the integration of the biomarkers (i.e. All) generally improved the predictive performance of both classification models, albeit only slightly.
| Table 5: The performance of the SVM and BDT models built on the generic biomarkers of the breast cancer datasets with PR groups. | ||||||
| Dataset | SVM-HP | SVM-HN | SVM-All | BDT-HP | BDT-HN | BDT-All |
| (Nature 2012) | 0.8428 | 0.8040 | 0.8532 | 0.8564 | 0.7885 | 0.8588 |
| (Cell 2015) | 0.8432 | 0.7994 | 0.8469 | 0.8654 | 0.7990 | 0.8637 |
| (Provisional) | 0.8566 | 0.8042 | 0.8521 | 0.8683 | 0.8038 | 0.8726 |
Discussion
Our findings reveal strong evidence of a positive or a negative association between the discovered mRNA markers and oestrogen and progesterone receptors. The positive association refers to the upregulation in the expression levels of highly positively weighted genes, which indicates the strong likelihood of a patient having ER+/PR+ breast cancer. This means that the discovered mRNA biomarkers {‘AGR3‘,‘ANXA9’, ‘C6orf97’, ‘CA12’, ‘ESR1’, ‘EVL’, ‘FSIP1’, ‘GATA3’,‘GFRA1’, ‘IGFALS’, ‘LRRC56’, ‘NAT1’, ‘PCP2’, ‘SCUBE2’, ‘SIAH2’, ‘SLC39A6’} are highly expressed for the ER+ group compared to the ER- samples, as shown in figures 7. We note that the literature strongly supports the association of some of the discovered biomarkers in ER+ breast cancers such as {‘ESR1, ‘GFRA1’, ‘AGR3’, ‘SIAH2’, ‘NAT1’, ‘SCUBE2’, ‘GATA3’ [32-36]}. However, the dis-covered biomarkers that do not appear to have been recognized in the ER+ breast cancer literature are {‘C6orf97’, ‘SLC39A6’, ‘ANXA9’, ‘CA12’, ‘EVL’, ‘FSIP1’, ‘IGFALS’, ‘PCP2’, ‘LRRC56’}. The positive association was also detected between the identified mRNAs {‘AGR3’, ‘FGD3’, ‘GFRA1’, ‘GREB1’, ‘GRPR’, ‘PGLYRP2’, ‘PGR’, ‘SCUBE2’, ‘SIAH2’, ‘SUSD3’} and PR+ tumours, as shown in figure 9. In this series of plots, we observe that the PR+ patients exhibit high-level of mRNA expressions for these biomarkers compared to the patients from the PR- group. In the literature, there is growing evidence that demonstrates the role some of these biomarkers play in breast cancers and high levels of PR, such as {‘FGD3’, ‘SUSD3’, ‘GRPR’, ‘PGR’, ‘GREB1’ [37-41]}. Limited information is available concerning the role of {‘AGR3’, ‘GFRA1’, ‘SIAH2’, ‘SCUBE2’, ‘PGLYRP2’} in high expression levels of PR. The negative association refers to the down regulation in the mRNA expression levels of highly negatively weighted genes, which indicates the strong likelihood of a patient having ER+/PR+ breast cancer. This means that declines in the expression values of {‘B3GNT5’, ‘BBOX1’, ‘C1orf106’, ‘DKK1’, ‘KRT16’, ‘KRT81’, ‘PPP1R14C’, ‘PROM1’, ‘PSAT1’, ‘RARRES1’, ‘S100A8’, ‘S100A9’, ‘SOX11’, ‘TMEM40’, ‘TRPV6’, ‘VGLL1’} contribute to the positivity of ER and to the heterogeneity of breast cancer, as shown in figures 8. There is growing evidence in the literature that some of these biomarkers are frequently associated with breast cancer and triple-negative breast cancer, such as {‘VGLL1’, ‘PROM1’, ‘PSAT1’ [42-44]}. The biomarkers that have not been widely detected in ER+ tumours are {‘PPP1R14C’, ‘SOX11’, ‘B3GNT5’, ‘KRT16’, ‘DKK1’, ‘S100A8’, ‘S100A9’, ‘TRPV6’,‘TMEM40’, ‘C1orf106’, ‘BBOX1’, ‘KRT81’, ‘RARRES1’} and their inverse association with ER positivity has not been significantly described. For the patients with PR+ tumors, the down regulation in the expression levels of {‘ATP6V0A4’, ‘C1orf115’, ‘C9orf58’, ‘CLCA2’, ‘FGFR4’, ‘LAD1’, ‘NXPH1’, ‘PPP1R1A’, ‘TRPV6’, ‘TSPAN8’} contributes to the phenotype associated with PR positivity, as shown in figure 10. The inverse correlation between the expression patterns of these biomarkers and the positivity of PR has not yet been recognised in the wider research literature.
Conclusion
The aetiology of breast cancer is still ambiguous, where breast cancer could differ significantly in regards to clinical, pathological, and biological properties. The discovery of molecular indicators from microarray data can con- tribute to answering serious etiologic questions about cancer and developing effective procedures to prevent, detect, manage, and treat this heterogeneous complicated disease. However, having tens of thousands of molecules of such large-scale biomedical datasets has significantly challenged traditional statistical methods and conventional machine learning algorithms due to the curse of dimensionality issues. Thanks to the advances in the deep learning models applied to these databases, the pathogenesis of breast cancer is progressively becoming more widely understood at the molecular-level. In particular, this has enabled candidate genes to be detected and estimated to better under- stand the pathogenesis of these biomarkers in terms of how they contribute to the development and progression of breast cancer and invasive breast cancer and thus what role they might play in the establishment of more effective diagnosis and treatment procedures.
In this work we applied a promising new deep feature selection approach, originally introduced by Alzubaidi, et al. [19], to three separate breast invasive carcinoma datasets from the TCGA database with the aim of modelling and analysing gene expression data to discover interesting complex patterns that may appear to aid the development of new and innovative diagnostic and prognostic tools for ER+/PR+ invasive breast cancer. Given this stated aim, we conclude the research a success in that our model, with its deep feature extraction and feature selection modules, not only discovered sets of genes previously known to be associated with breast cancer but also a small panel of genes that appear to have largely gone unnoticed in the literature.
As result, strong evidence of a positive or a negative association between the discovered mRNA markers and oestrogen and progesterone receptors was observed, where the up regulation in the expression levels of highly positively weighted genes and the down regulation in the expression levels of the highly negatively weighted genes both indicated the strong likelihood of a patient experiencing ER+/PR+ invasive breast cancer.
It is important to mention a significant obstacle for cancer research and biomarker discovery research, which is the need for more effective interdisciplinary research environments. Effective inter-disciplinary research is there- fore paramount if findings from state-of-the-art machine learning research is to be truly exploited and brought into the service of precision medicine. Therefore, we recommend that the novel genes discovered by our deep feature selection model are investigated further by research scientists and clinicians to assess their value with respect to the development of more personalised diagnostics and/or treatment of breast cancer.
Acknowledgement
Funding
The work is funded by the Ministry of Higher Education and Scientific Research in Iraq, University of Al-Qadisiyah through a doctoral scholarship. Financial support is provided by the Department of Computer Science at Nottingham Trent University to support the publication of this paper.
Declaration of competing interest
The authors declare that they have no known competing financial interests or personal relationships that could have appeared to influence the work reported in this paper.
References
- Hamid Behravan, Jaana M Hartikainen, Maria Tengstr¨om, Katri Pylk¨as, Robert Winqvist, Veli-Matti Kosma, and Arto Mannermaa. Machine learning identifies interacting genetic variants contributing to breast can- cer risk: A case study in finnish cases and controls. Scientific reports. 2018;8(1):13149.
- Ruth Etzioni, Nicole Urban, Scott Ramsey, Martin McIntosh, Stephen Schwartz, Brian Reid, Jerald Radich, Garnet Anderson, and Leland Hartwell. Early detection: The case for early detection. Nature Reviews Cancer. 2003;3(4):243.
- Gøtzsche PC, Nielsen M. Screening for breast cancer with mammography. Cochrane Database Syst Rev. 2011 Jan 19;(1):CD001877. doi: 10.1002/14651858.CD001877.pub4. Update in: Cochrane Database Syst Rev. 2013;6:CD001877. PMID: 21249649.
- Welch HG, Prorok PC, O'Malley AJ, Kramer BS. Breast-Cancer Tumor Size, Overdiagnosis, and Mammography Screening Effectiveness. N Engl J Med. 2016 Oct 13;375(15):1438-1447. doi: 10.1056/NEJMoa1600249. PMID: 27732805.
- Berg WA. Tailored supplemental screening for breast cancer: what now and what next? AJR Am J Roentgenol. 2009 Feb;192(2):390-9. doi: 10.2214/AJR.08.1706. PMID: 19155400.
- Hooley RJ, Andrejeva L, Scoutt LM. Breast cancer screening and problem solving using mammography, ultrasound, and magnetic resonance imaging. Ultrasound Q. 2011 Mar;27(1):23-47. doi: 10.1097/RUQ.0b013e31820e15ac. PMID: 21343800.
- Hammond ME, Hayes DF, Dowsett M, Allred DC, Hagerty KL, Badve S, Fitzgibbons PL, Francis G, Goldstein NS, Hayes M, Hicks DG, Lester S, Love R, Mangu PB, McShane L, Miller K, Osborne CK, Paik S, Perlmutter J, Rhodes A, Sasano H, Schwartz JN, Sweep FC, Taube S, Torlakovic EE, Valenstein P, Viale G, Visscher D, Wheeler T, Williams RB, Wittliff JL, Wolff AC; American Society of Clinical Oncology; College of American Pathologists. American Society of Clinical Oncology/College of American Pathologists guideline recommendations for immunohistochemical testing of estrogen and progesterone receptors in breast cancer (unabridged version). Arch Pathol Lab Med. 2010 Jul;134(7):e48-72. doi: 10.5858/134.7.e48. PMID: 20586616.
- Benita S Katzenellenbogen, Monica M Montano, Kirk Ekena, Mary E Herman, and Eileen M McInerney. Antiestrogens: mechanisms of action and resistance in breast cancer. Breast cancer research and treatment. 1997;44(1):23-38.
- Shiau AK, Barstad D, Loria PM, Cheng L, Kushner PJ, Agard DA, Greene GL. The structural basis of estrogen receptor/coactivator recognition and the antagonism of this interaction by tamoxifen. Cell. 1998 Dec 23;95(7):927-37. doi: 10.1016/s0092-8674(00)81717-1. PMID: 9875847.
- Carroll JS. Mechanisms of oestrogen receptor (ER) gene regulation in breast cancer. European journal of endocrinology. 2016;175(1):R41–9.
- Sorlie T, Tibshirani R, Parker J, Hastie T, Marron JS, Nobel A, Deng S, Johnsen H, Pesich R, Geisler S, Demeter J, Perou CM, Lønning PE, Brown PO, Børresen-Dale AL, Botstein D. Repeated observation of breast tumor subtypes in independent gene expression data sets. Proc Natl Acad Sci U S A. 2003 Jul 8;100(14):8418-23. doi: 10.1073/pnas.0932692100. Epub 2003 Jun 26. PMID: 12829800; PMCID: PMC166244.
- Christof Angermueller, Heather Lee, Wolf Reik, and Oliver Stegle. Accu- rate prediction of single-cell dna methylation states using deep learning. BioRxiv. 2017;055715.
- Kelley DR, Snoek J, Rinn JL. Basset: learning the regulatory code of the accessible genome with deep convolutional neural networks. Genome Res. 2016 Jul;26(7):990-9. doi: 10.1101/gr.200535.115. Epub 2016 May 3. PMID: 27197224; PMCID: PMC4937568.
- Patel-Murray NL, Adam M, Huynh N, Wassie BT, Milani P, Fraenkel E. A Multi-Omics Interpretable Machine Learning Model Reveals Modes of Action of Small Molecules. Sci Rep. 2020 Jan 22;10(1):954. doi: 10.1038/s41598-020-57691-7. PMID: 31969612; PMCID: PMC6976599.
- Zhou J, Troyanskaya OG. Predicting effects of noncoding variants with deep learning-based sequence model. Nat Methods. 2015 Oct;12(10):931-4. doi: 10.1038/nmeth.3547. Epub 2015 Aug 24. PMID: 26301843; PMCID: PMC4768299.
- David E Rumelhart and James L McClelland. Parallel distributed pro- cessing: explorations in the microstructure of cognition. 1986.
- Ian Goodfellow, Yoshua Bengio, and Aaron Courville. Deep learning. MIT press. 2016.
- Abeer Alzubaidi and Jonathan Tepper. Deep mining from omics data. In Data Mining Techniques for the Life Sciences. Humana, New York, 2022.
- Alzubaidi A, Tepper J, Lotfi A. A novel deep mining model for effective knowledge discovery from omics data. Artif Intell Med. 2020 Apr;104:101821. doi: 10.1016/j.artmed.2020.101821. Epub 2020 Feb 24. PMID: 32499000.
- Taylor JM, Ankerst DP, Andridge RR. Validation of biomarker-based risk prediction models. Clin Cancer Res. 2008 Oct 1;14(19):5977-83. doi: 10.1158/1078-0432.CCR-07-4534. PMID: 18829476; PMCID: PMC3896456.
- Cancer Genome Atlas Research Network, Weinstein JN, Collisson EA, Mills GB, Shaw KR, Ozenberger BA, Ellrott K, Shmulevich I, Sander C, Stuart JM. The Cancer Genome Atlas Pan-Cancer analysis project. Nat Genet. 2013 Oct;45(10):1113-20. doi: 10.1038/ng.2764. PMID: 24071849; PMCID: PMC3919969.
- Gao J, Aksoy BA, Dogrusoz U, Dresdner G, Gross B, Sumer SO, Sun Y, Jacobsen A, Sinha R, Larsson E, Cerami E, Sander C, Schultz N. Integrative analysis of complex cancer genomics and clinical profiles using the cBioPortal. Sci Signal. 2013 Apr 2;6(269):pl1. doi: 10.1126/scisignal.2004088. PMID: 23550210; PMCID: PMC4160307.
- Isaac S Kohane, Atul J Butte, and Alvin Kho. Microarrays for an integrative genomics. MIT press, 2002.
- Cancer Genome Atlas Network. Comprehensive molecular portraits of human breast tumours. Nature. 2012 Oct 4;490(7418):61-70. doi: 10.1038/nature11412. Epub 2012 Sep 23. PMID: 23000897; PMCID: PMC3465532.
- Ciriello G, Gatza ML, Beck AH, Wilkerson MD, Rhie SK, Pastore A, Zhang H, McLellan M, Yau C, Kandoth C, Bowlby R, Shen H, Hayat S, Fieldhouse R, Lester SC, Tse GM, Factor RE, Collins LC, Allison KH, Chen YY, Jensen K, Johnson NB, Oesterreich S, Mills GB, Cherniack AD, Robertson G, Benz C, Sander C, Laird PW, Hoadley KA, King TA; TCGA Research Network, Perou CM. Comprehensive Molecular Portraits of Invasive Lobular Breast Cancer. Cell. 2015 Oct 8;163(2):506-19. doi: 10.1016/j.cell.2015.09.033. PMID: 26451490; PMCID: PMC4603750.
- Zheng Ping, Yuchao Xia, Tiansheng Shen, Vishwas Parekh, Gene P Siegal, Isam-Eldin Eltoum, Jianbo He, Dongquan Chen, Minghua Deng, Ruibin Xi, et al. A microscopic landscape of the invasive breast cancer genome. Scientific reports. 2016;6:27545.
- Martin Fodslette Møller. A scaled conjugate gradient algorithm for fast supervised learning. Neural networks. 1993;6(4):525-533.
- Bernhard E Boser, Isabelle M Guyon, and Vladimir N Vapnik. A training algorithm for optimal margin classifiers. In Proceedings of the fifth annual workshop on Computational learning theory. ACM. 1992;144–152.
- Leo Breiman. Bagging predictors. Machine learning. 1996;24(2):123-140.
- Reinert T, Gonçalves R, Bines J. Implications of ESR1 Mutations in Hormone Receptor-Positive Breast Cancer. Curr Treat Options Oncol. 2018 Apr 17;19(5):24. doi: 10.1007/s11864-018-0542-0. PMID: 29666928.
- Fielder GC, Yang TW, Razdan M, Li Y, Lu J, Perry JK, Lobie PE, Liu DX. The GDNF Family: A Role in Cancer? Neoplasia. 2018 Jan;20(1):99-117. doi: 10.1016/j.neo.2017.10.010. Epub 2017 Dec 12. PMID: 29245123; PMCID: PMC5730419.
- Garczyk S, von Stillfried S, Antonopoulos W, Hartmann A, Schrauder MG, Fasching PA, Anzeneder T, Tannapfel A, Ergönenc Y, Knüchel R, Rose M, Dahl E. AGR3 in breast cancer: prognostic impact and suitable serum-based biomarker for early cancer detection. PLoS One. 2015 Apr 15;10(4):e0122106. doi: 10.1371/journal.pone.0122106. PMID: 25875093; PMCID: PMC4398490.
- van der Willik KD, Timmermans MM, van Deurzen CH, Look MP, Reijm EA, van Zundert WJ, Foekens R, Trapman-Jansen AM, den Bakker MA, Westenend PJ, Martens JW, Berns EM, Jansen MP. SIAH2 protein expression in breast cancer is inversely related with ER status and outcome to tamoxifen therapy. Am J Cancer Res. 2016 Jan 15;6(2):270-84. PMID: 27186402; PMCID: PMC4859659.
- Carlisle SM, Hein DW. Retrospective analysis of estrogen receptor 1 and N acetyltransferase gene expression in normal breast tissue, primary breast tumors, and established breast cancer cell lines. Int J Oncol. 2018 Aug;53(2):694-702. doi: 10.3892/ijo.2018.4436. Epub 2018 Jun 11. PMID: 29901116; PMCID: PMC6017241.
- Lin YC, Lee YC, Li LH, Cheng CJ, Yang RB. Tumor suppressor SCUBE2 inhibits breast-cancer cell migration and invasion through the reversal of epithelial-mesenchymal transition. J Cell Sci. 2014 Jan 1;127(Pt 1):85-100. doi: 10.1242/jcs.132779. Epub 2013 Nov 8. PMID: 24213532.
- Takaku M, Grimm SA, Roberts JD, Chrysovergis K, Bennett BD, Myers P, Perera L, Tucker CJ, Perou CM, Wade PA. GATA3 zinc finger 2 mutations reprogram the breast cancer transcriptional network. Nat Commun. 2018 Mar 13;9(1):1059. doi: 10.1038/s41467-018-03478-4. PMID: 29535312; PMCID: PMC5849768.
- Willis S, Sun Y, Abramovitz M, Fei T, Young B, Lin X, Ni M, Achua J, Regan MM, Gray KP, Gray R, Wang V, Long B, Kammler R, Sparano JA, Williams C, Goldstein LJ, Salgado R, Loi S, Pruneri G, Viale G, Brown M, Leyland-Jones B. High Expression of FGD3, a Putative Regulator of Cell Morphology and Motility, Is Prognostic of Favorable Outcome in Multiple Cancers. JCO Precis Oncol. 2017 Oct 13;1:PO.17.00009. doi: 10.1200/PO.17.00009. PMID: 32913979; PMCID: PMC7446538.
- Moy I, Todorović V, Dubash AD, Coon JS, Parker JB, Buranapramest M, Huang CC, Zhao H, Green KJ, Bulun SE. Estrogen-dependent sushi domain containing 3 regulates cytoskeleton organization and migration in breast cancer cells. Oncogene. 2015 Jan 15;34(3):323-33. doi: 10.1038/onc.2013.553. Epub 2014 Jan 13. PMID: 24413080; PMCID: PMC4096609.
- Morgat C, MacGrogan G, Brouste V, Vélasco V, Sévenet N, Bonnefoi H, Fernandez P, Debled M, Hindié E. Expression of Gastrin-Releasing Peptide Receptor in Breast Cancer and Its Association with Pathologic, Biologic, and Clinical Parameters: A Study of 1,432 Primary Tumors. J Nucl Med. 2017 Sep;58(9):1401-1407. doi: 10.2967/jnumed.116.188011. Epub 2017 Mar 9. PMID: 28280221.
- Hertz DL, Henry NL, Kidwell KM, Thomas D, Goddard A, Azzouz F, Speth K, Li L, Banerjee M, Thibert JN, Kleer CG, Stearns V, Hayes DF, Skaar TC, Rae JM. ESR1 and PGR polymorphisms are associated with estrogen and progesterone receptor expression in breast tumors. Physiol Genomics. 2016 Sep 1;48(9):688-98. doi: 10.1152/physiolgenomics.00065.2016. Epub 2016 Aug 19. PMID: 27542969; PMCID: PMC5111879.
- Cheng M, Michalski S, Kommagani R. Role for Growth Regulation by Estrogen in Breast Cancer 1 (GREB1) in Hormone-Dependent Cancers. Int J Mol Sci. 2018 Aug 28;19(9):2543. doi: 10.3390/ijms19092543. PMID: 30154312; PMCID: PMC6163654.
- Segaert P, Lopes MB, Casimiro S, Vinga S, Rousseeuw PJ. Robust identification of target genes and outliers in triple-negative breast cancer data. Stat Methods Med Res. 2019 Oct-Nov;28(10-11):3042-3056. doi: 10.1177/0962280218794722. Epub 2018 Aug 27. PMID: 30146936; PMCID: PMC6745616.
- Zhang Y, He W, Zhang S. Seeking for Correlative Genes and Signaling Pathways With Bone Metastasis From Breast Cancer by Integrated Analysis. Front Oncol. 2019 Mar 13;9:138. doi: 10.3389/fonc.2019.00138. PMID: 30918839; PMCID: PMC6424882.
- Gao S, Ge A, Xu S, You Z, Ning S, Zhao Y, Pang D. PSAT1 is regulated by ATF4 and enhances cell proliferation via the GSK3β/β-catenin/cyclin D1 signaling pathway in ER-negative breast cancer. J Exp Clin Cancer Res. 2017 Dec 8;36(1):179. doi: 10.1186/s13046-017-0648-4. PMID: 29216929; PMCID: PMC5721480.
Content Alerts
SignUp to our
Content alerts.
 This work is licensed under a Creative Commons Attribution 4.0 International License.


