Medicine Group . 2023 March 08;4(2):331-337. doi: 10.37871/jbres1680.
Metabolomic Methods to Predict Cancer-Associated Skeletal Muscle Wasting from Profiles of Urinary Metabolites
Al-Baraa Akram*
- Metabolomics
- Heat map
- Cachexia
- Scree plot
Abstract
It is known that cachexia is a cancer-associated muscle wasting and reduction in the function status due to treatment especially chemotherapy and in life expectancy, to assess cachexia muscle loss there are many methods as Computed Tomography (CT) scan which has many disadvantages as high cost, invasive, time consuming and cannot detect early stages of muscle wasting [1].
This novel approach uses single-time point urinary metabolite profiles for determining whether the patient is subjected to muscle wasting by analysis of 93 random urine samples from patients with cancer using 2 successive CT images by assessing of lumbar skeletal muscle area by cubic centimeter to estimate the rate of muscle change per time for every patient.
The average muscle change over time was -4.71% in 100 days in the muscle-losing group and 3.91% in 100 days in the control group. Bivariate statistics identified metabolites to muscle wasting including constituents and metabolites of muscle as creatine and creatinine, amino acids as serine, threonine, glutamic acid, isoleucine and valine.
These results suggest that urine analysis of a single random urine sample is cheap, fast, and non-invasive tool to screen muscle loss and it is useful to clarify prediction of related metabolic conditions possible with methodology presented.
The metabolomics methods used in this article are Univariate analysis T-test, correlation analysis, principal component analysis and heatmap clustering.
Introduction
It is known that cachexia is a cancer-associated muscle wasting and reduction in the function status due to treatment especially chemotherapy and in life expectancy, to assess cachexia muscle loss there are many methods as Computed Tomography (CT) scan which has many disadvantages as high cost, invasive, time consuming and cannot detect early stages of muscle wasting [1].
- Can measure multiple metabolites, from 10 to 100 substances, at once with no need for separation.
- Allows metabolic profiles (fingerprints) to be generated.
- Mostly automated, relatively little sample preparation or derivatization.
- Can be quantitative e.g. NMR.
- Analysis results can be obtained within less than 60 seconds [2].
Materials and Methods
After collection of samples we determine the amounts of chemical components of the urine of patients with colorectal cancer in the severe levels of cancer.
First we filter data, the purpose of the data filtering is to identify and remove variables that are unlikely to be of use when modeling the data. No phenotype information is used in the filtering process, so the result can be used with any downstream analysis. This step can usually improve the results if we used meta-analysis method.
Data normalization
Sample specific normalization allows users to manually adjust concentrations based on biological inputs (i.e. volume, mass) row-wise normalization allows general-purpose adjustment for differences among samples, data transformation and scaling are two different approaches to make features more comparable, we normalize data to make it follows normal distribution.
We normalize by sum and make log transformation then make pareto scaling in which mean is centered and divided by the square root of the standard deviation of each variable.
Statistical analysis
We use many of common methods used in metabolomics data analysis which will be:
- T-test: As a univariate analysis method.
- Principal component analysis: As a multivariate analysis method.
- Heatmap: Hierarchical Clustering for clustering analysis.
Results
Univariate analysis T-test
For two-group data, the number of data was applied on 62 metabolites in urine samples. These compounds could be identified using correlation analysis which uses chemical techniques to determine each component in the urine. Correlation analysis depends mainly on comparison between reference components and the components of the sample, if they are identical they will be shown in red but if they are not identical or not correlated they will be colored in blue, the intense of color explains the correlation degree between the sample and reference. MetaboAnalyst provides t-test, it supports both unpaired and paired analyses, and the univariate analyses provide a preliminary overview about features that are potentially significant in discriminating the conditions under study. For paired fold change analysis, the algorithm first counts the total number of pairs with fold changes that are consistently above/below the specified Fold Change threshold for each variable [3].
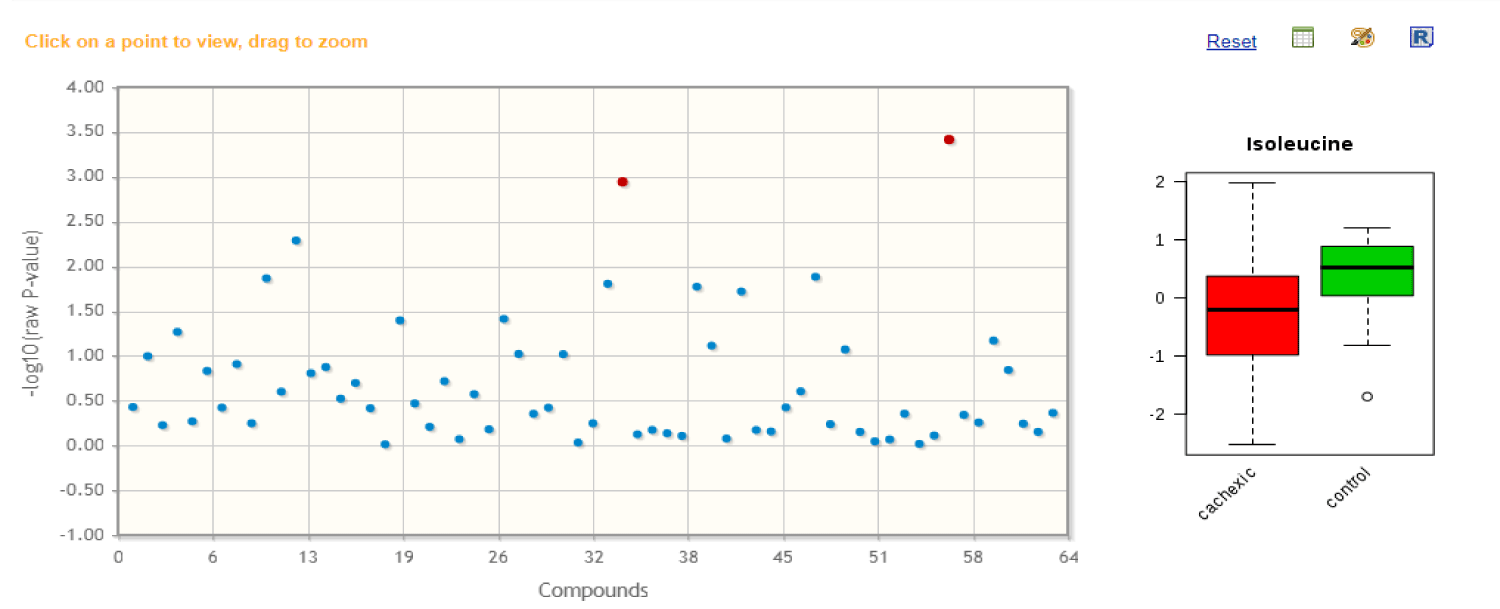
Figure 1 shows the important features identified by T-tests. Table 1 shows the details of these features;
| Table 1: Various applications of metabolomics in transplantation of liver, kidney and heart. | |||
| Organ | Condition | Metabolite(s) Increased | Metabolite(s) Decreased |
| Kidney (Human) | Chronic Renal Failure | TMAO (Trimethylamine N-oxide), Dimethylamine, Urea, Creatinine (serum) | |
| Liver (Human) | Ischemia | Methylarginine Dimethylarginine (liver catheter) |
|
| Kidney (Human) | Graft Dysfunction | TMAO, Dimetheylamine Lactate, Acetate, Succinate, Glycine, Alanine, (urine) |
|
| Liver (Human) | Graft Dysfunction | Glutamine (serum & urine) | Urea (urine) |
| Liver (Human) | Post-transplant | Phosphatidylcholine (bile) | |
| Kidney (Human) | Graft Dysfunction CsA Toxicity |
TMAO, Alanine, Lactate, Citrate (urine & serum) |
|
| Heart (Human) | Rejection | Nitrate (urine) | |
| Kidney (Human) | Acute Rejection | Nitrates, Nitrites, Nitric oxide metabolites (urine) | |
The purpose of fold change is to compare absolute value changes between two group means. Therefore, the data before column normalization will be used instead. Also note, the result is plotted in log2 scale, so that same fold change (up/down regulated) will have the same distance to the zero baselines [4].
As shown in table 2, t-test explains the result of the two most significant compounds which are uracil and isoleucine to distinct their p-values, -log10 (p) and False Discovery Rate.
| Table 2: Important features identified by t-tests shows result of the only 2 significant compounds uracil and isoleucine using t-test, p-value, -log10 (p) and False Discovery Rate. | |||||
| Compound Name | t-test | p-value | -log 10 (p) | FDR | |
| 1 | Uracil | -3.7185 | 0.0003842 | 3.4154 | 0.024204 |
| 2 | Isoleucine | -3.3838 | 0.0011396 | 2.9432 | 0.035898 |
Correlation analysis
Correlation analysis can be used to visualize the overall correlations between different features. It can also be used to identify which features are correlated with a feature of interest. Correlation analysis can also be used to identify if certain features show particular patterns under different conditions, we need to define a pattern in the form of a series of hyphenated numbers [5].
Principal component analysis
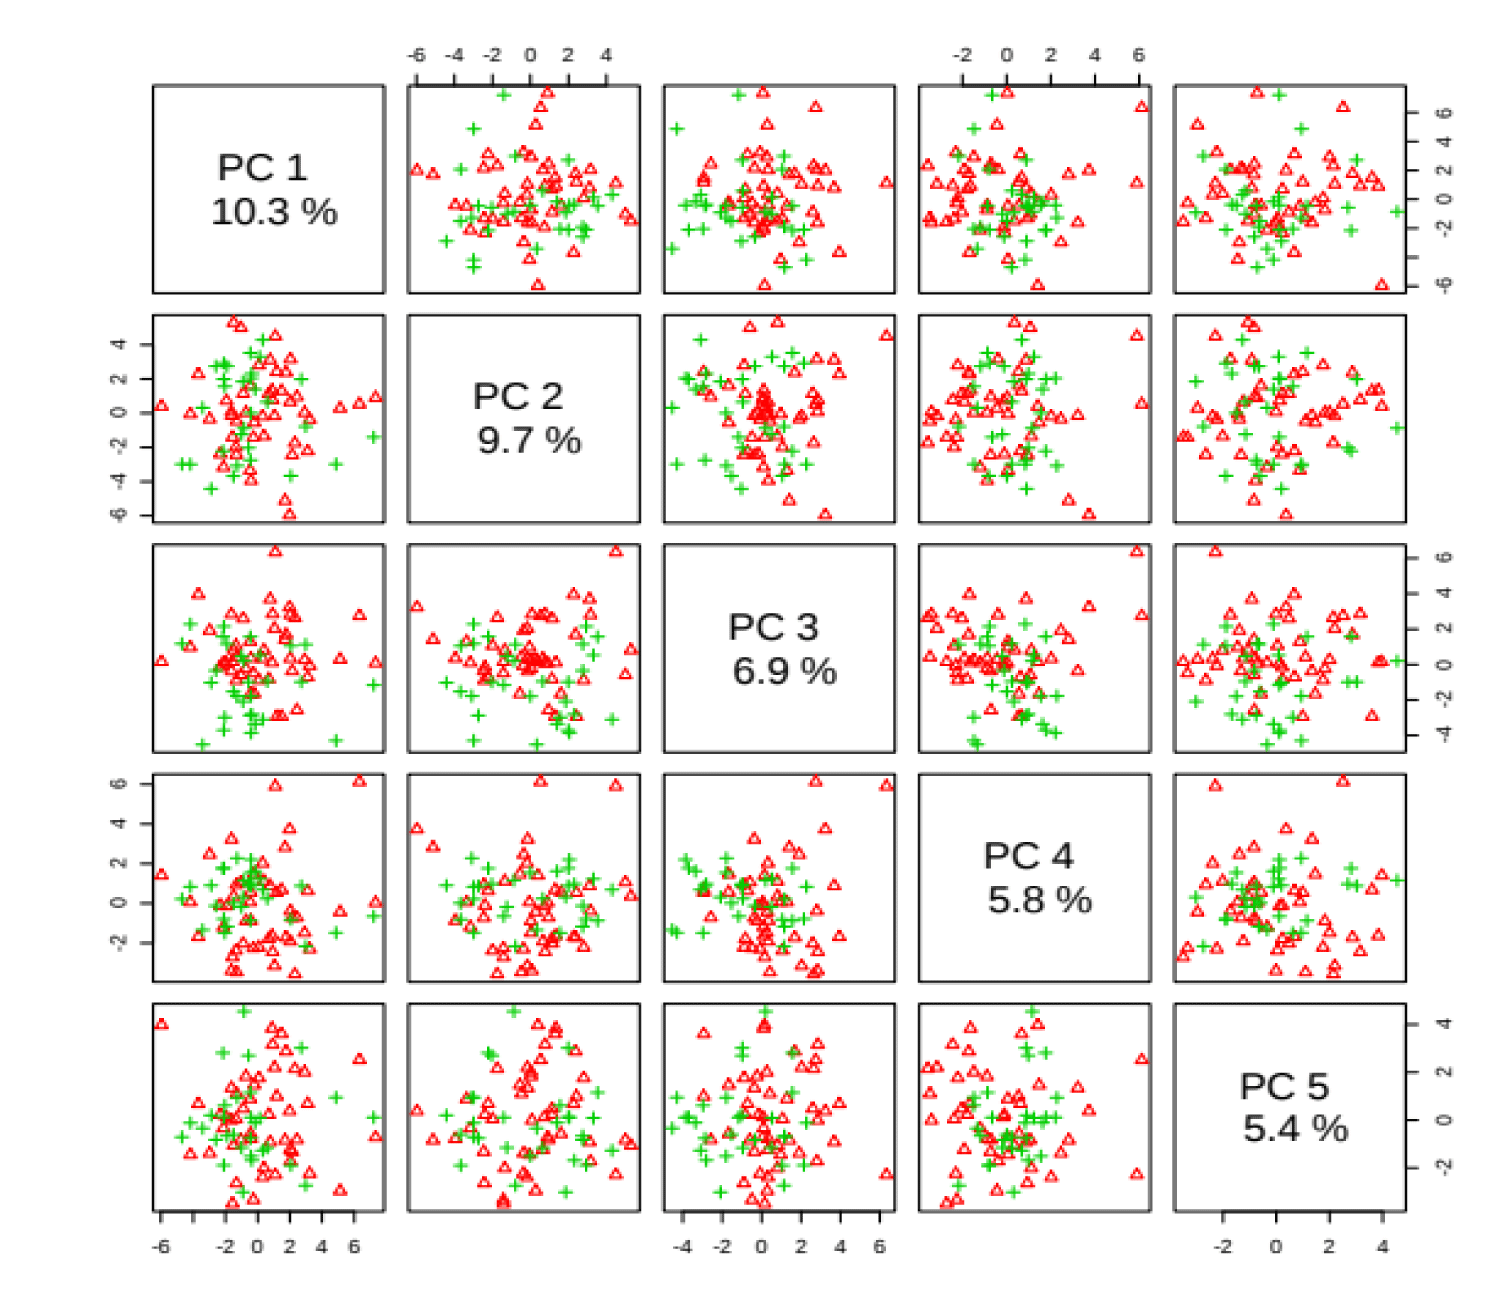
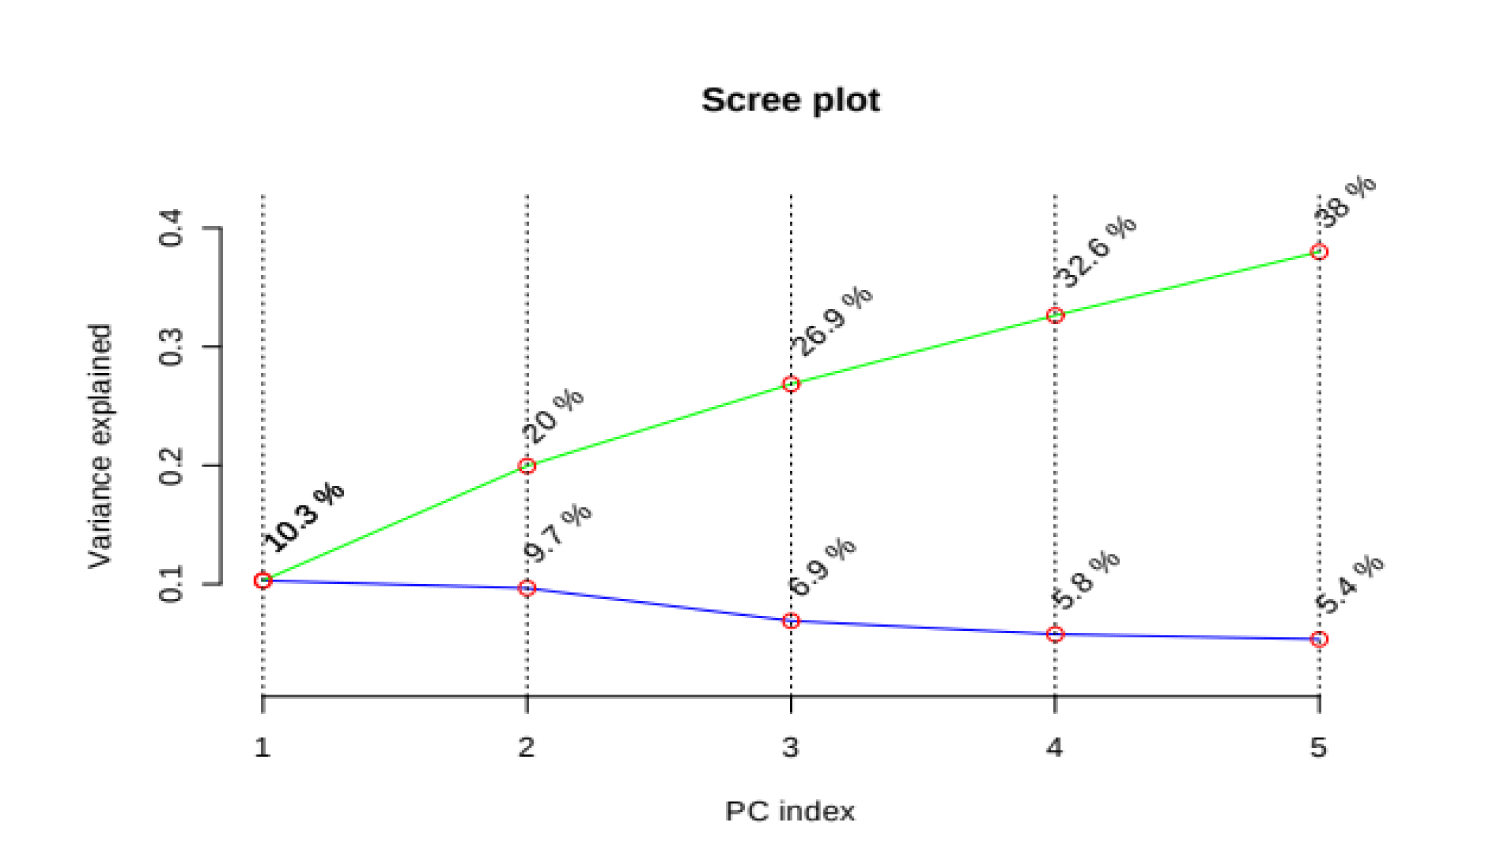
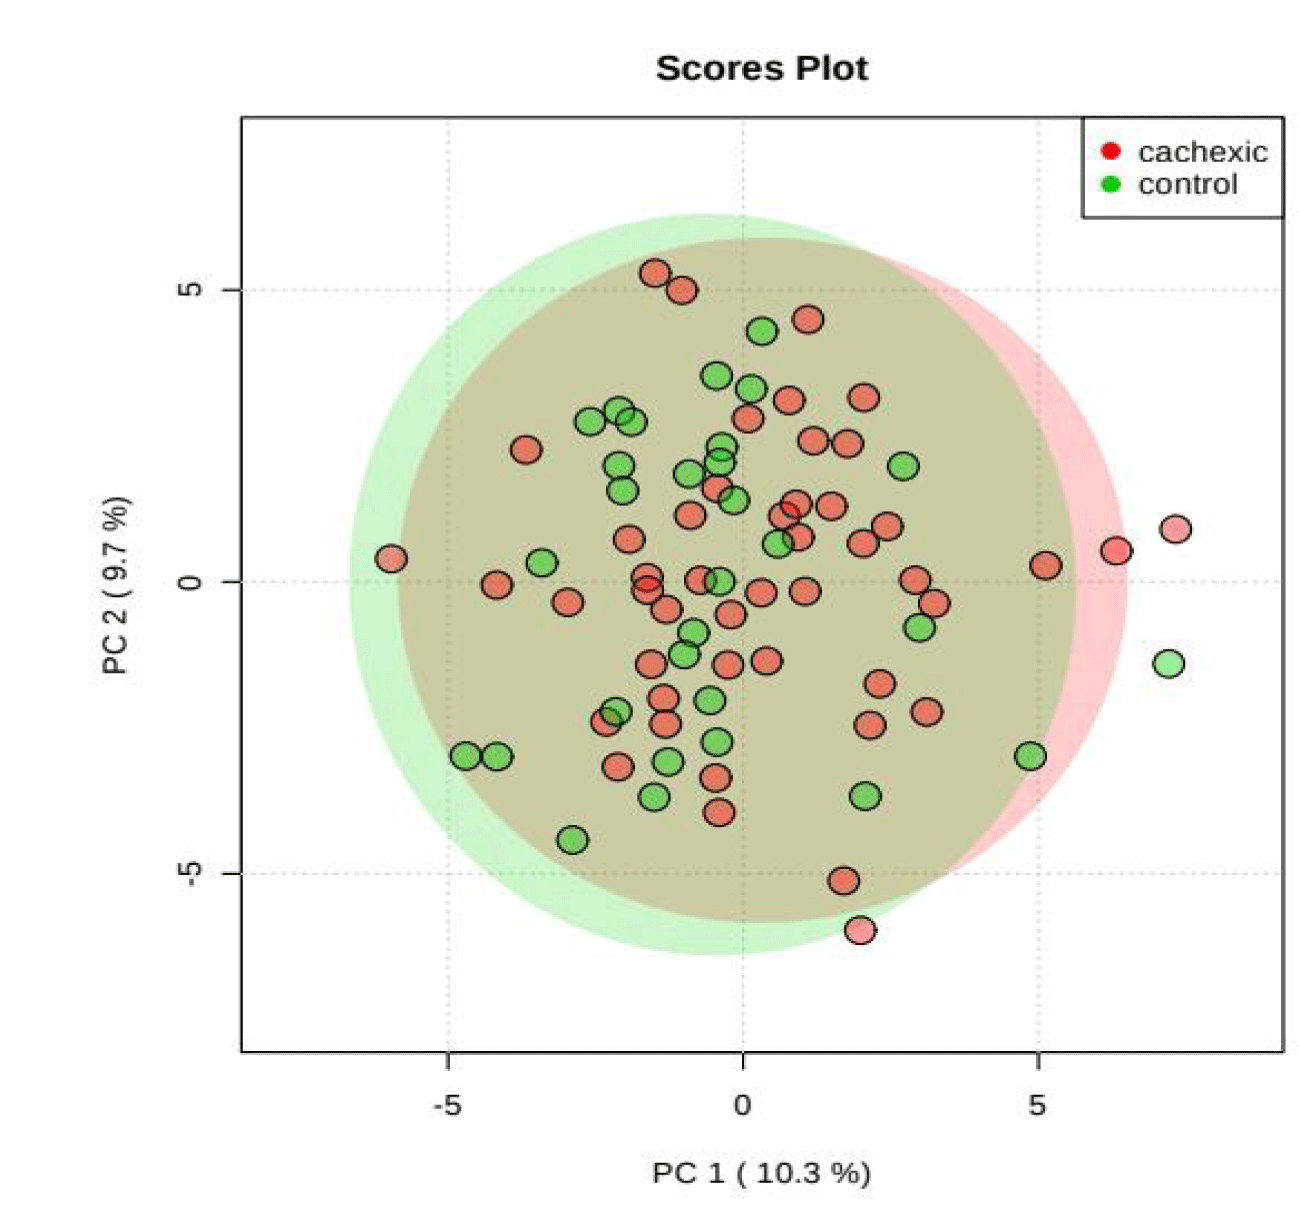
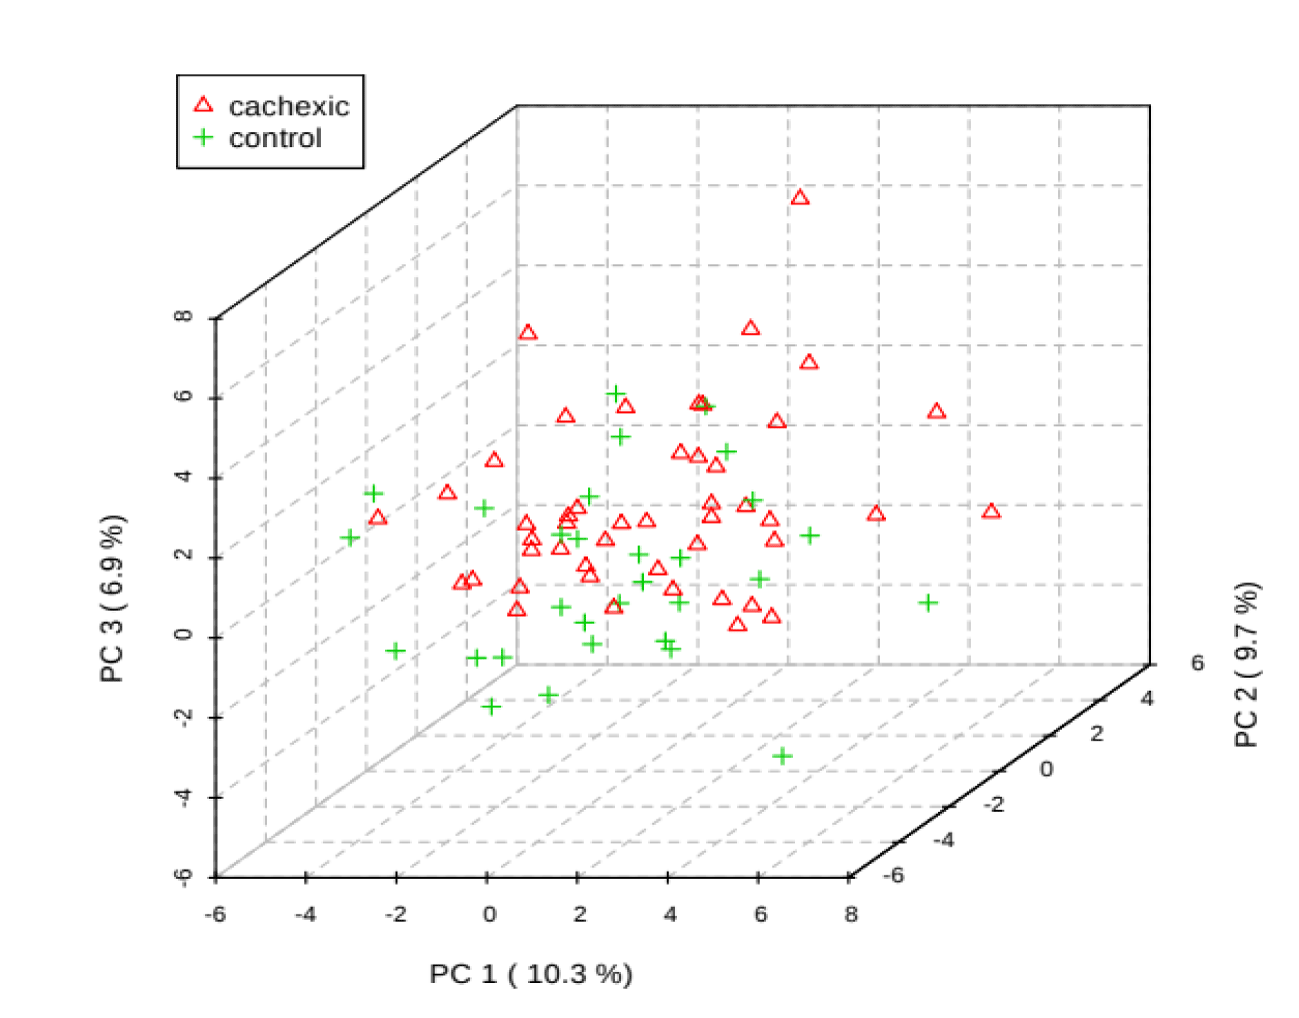
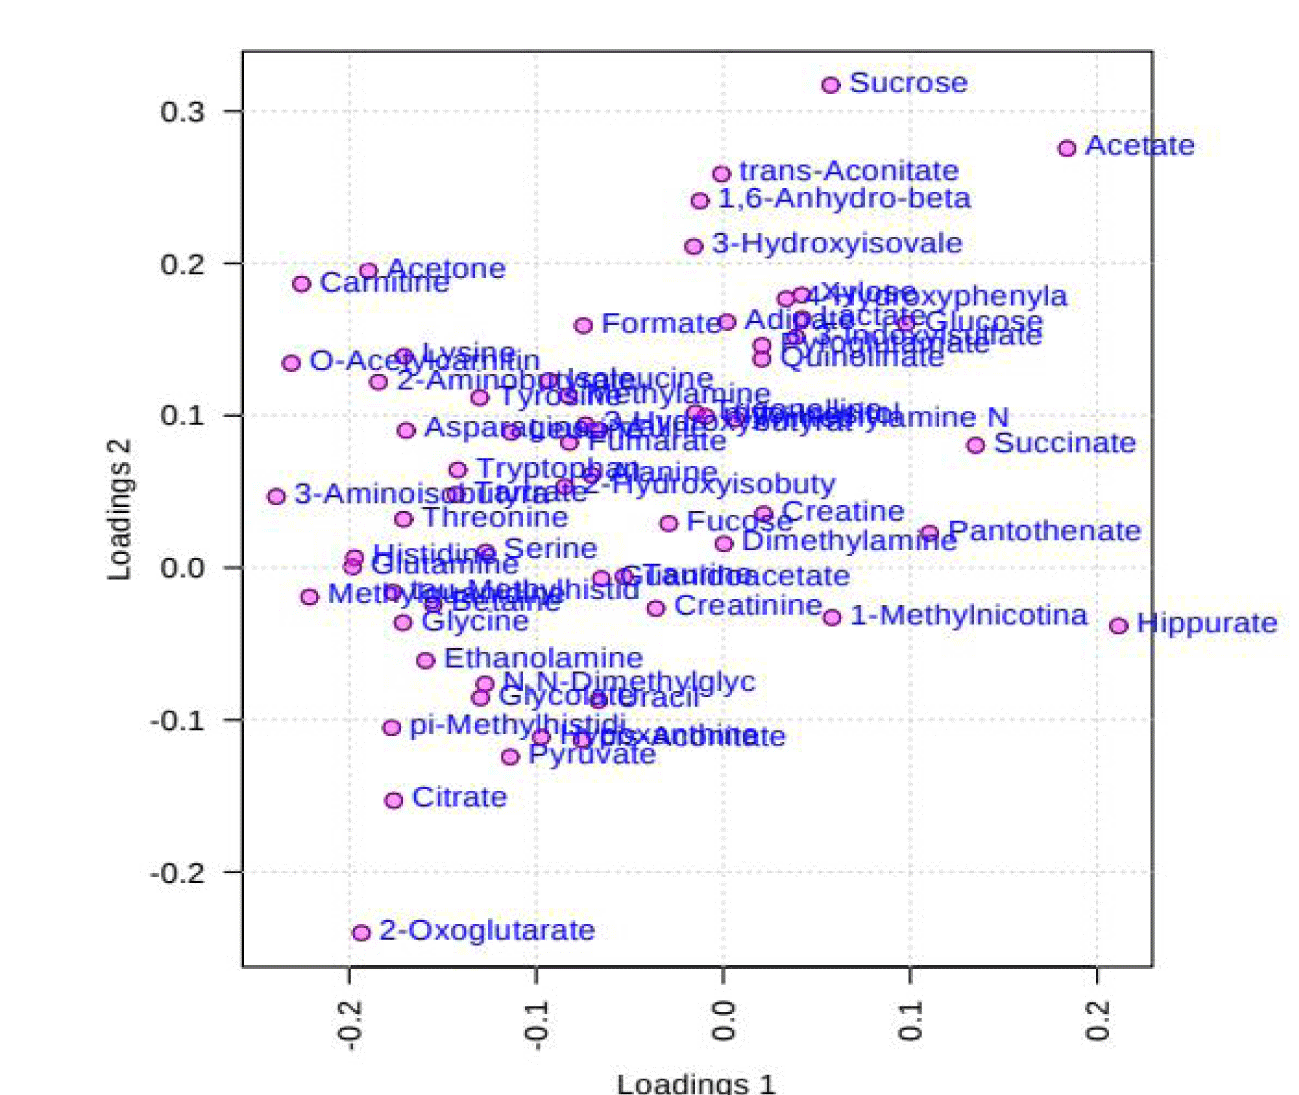
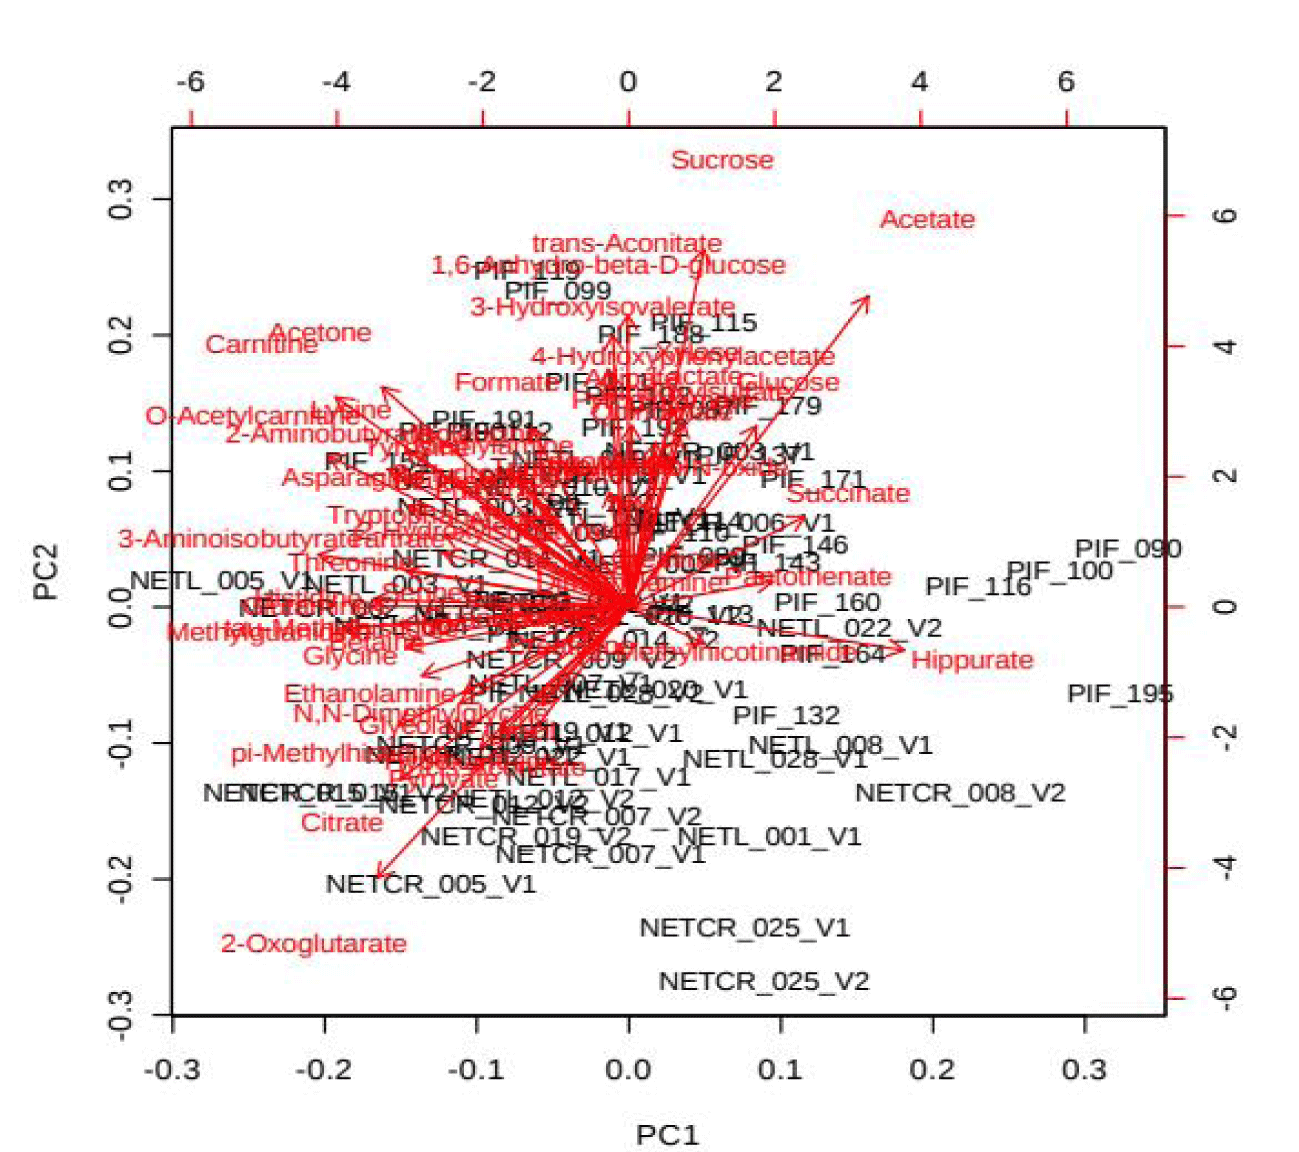
PCA is an unsupervised method aiming to find the directions that best explain the variance in a data set without referring to class labels. The data are summarized into much fewer variables called scores which are weighted average of the original variables, figure 3 is pairwise score plots providing an overview of the various separation patterns among the most significant PCs, figure 4 is the scree plot showing the variances explained by the selected PCs, figure 5 shows the 2-D scores plot between selected PCs, figure 6 shows the 3-D scores plot between selected PCs, figure 7 shows the loadings plot between the selected PCs, figure 8 shows the biplot between the selected PCs.
As shown in figure below, PCs shows the score blot between cachexic group (red circles) and control group (green circle), PC1 has a score reaches 10.3% while PC2 shows a score reaches 9.7%.
If we wanted to make confirmation test we can use 3D score plot which compares between cachexic group (red triangles) and control group (green triangles) we will find similar results of the previous score plot test with a third score of the third dimension PC3 reaches 6.9%, we find that cachexic group has the highest score in the diagram.
Heatmap clustering
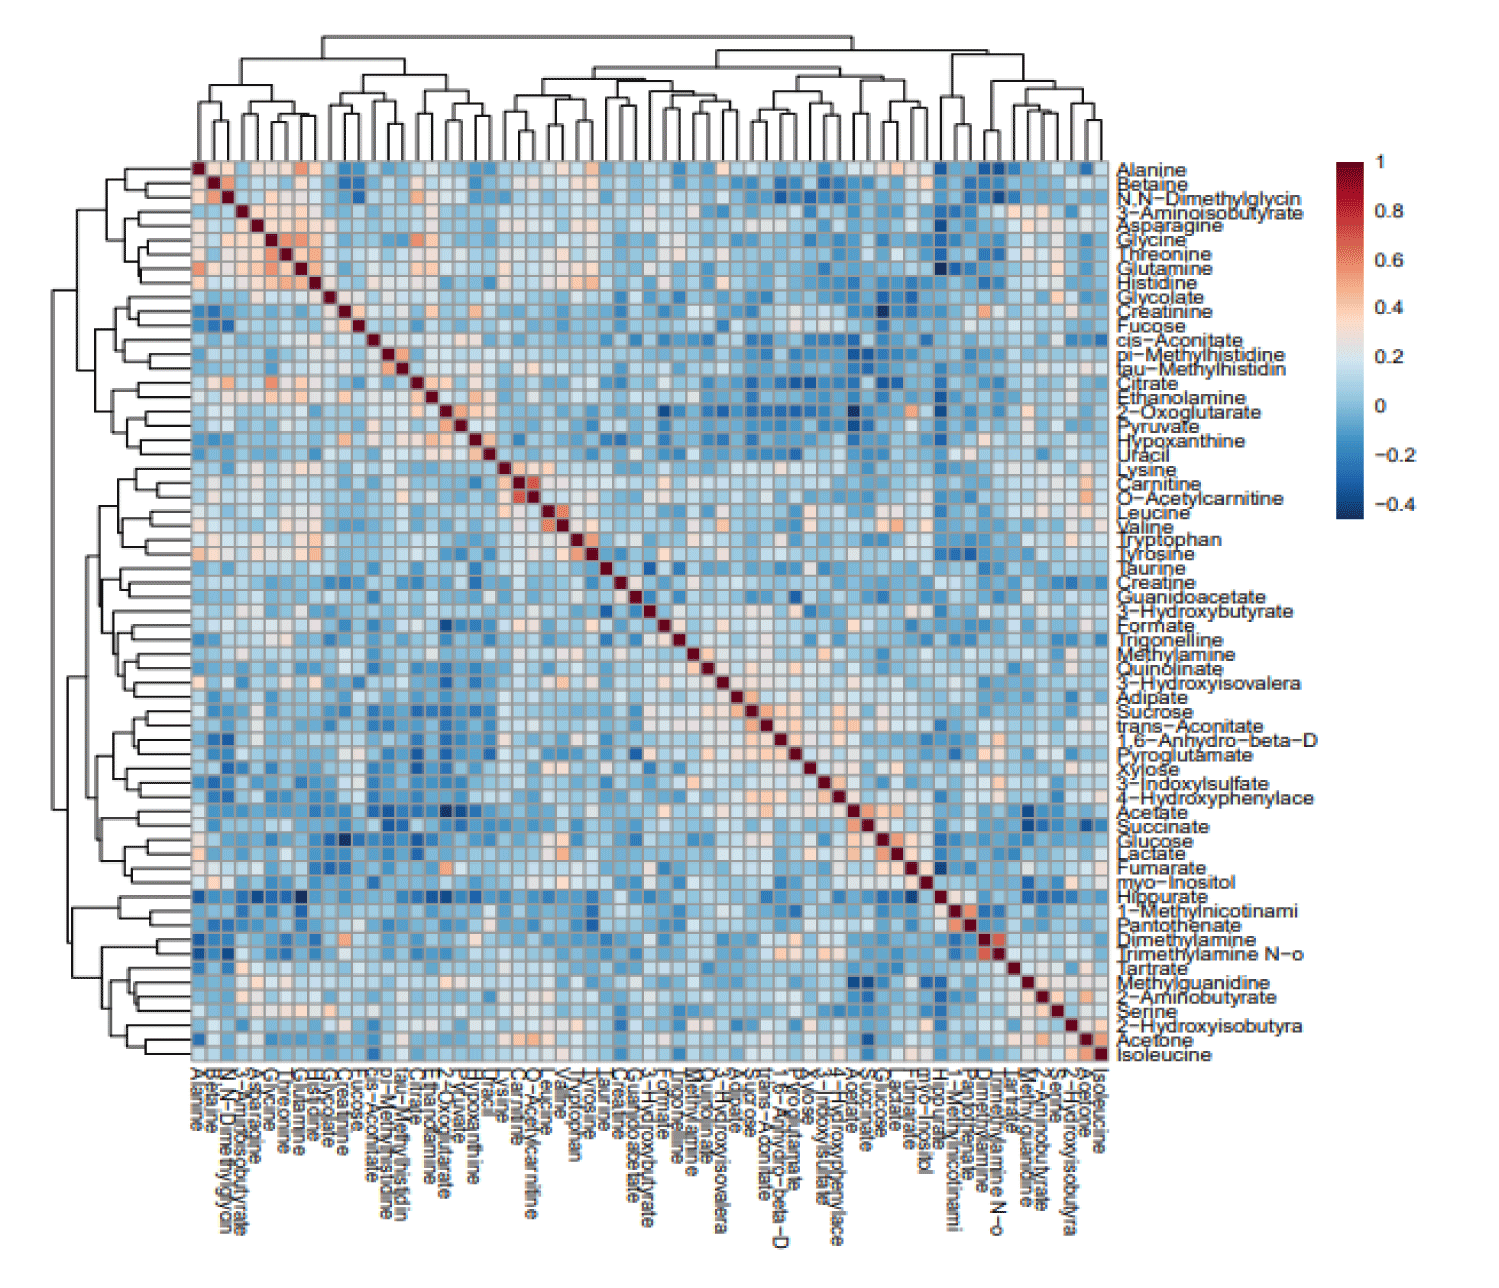
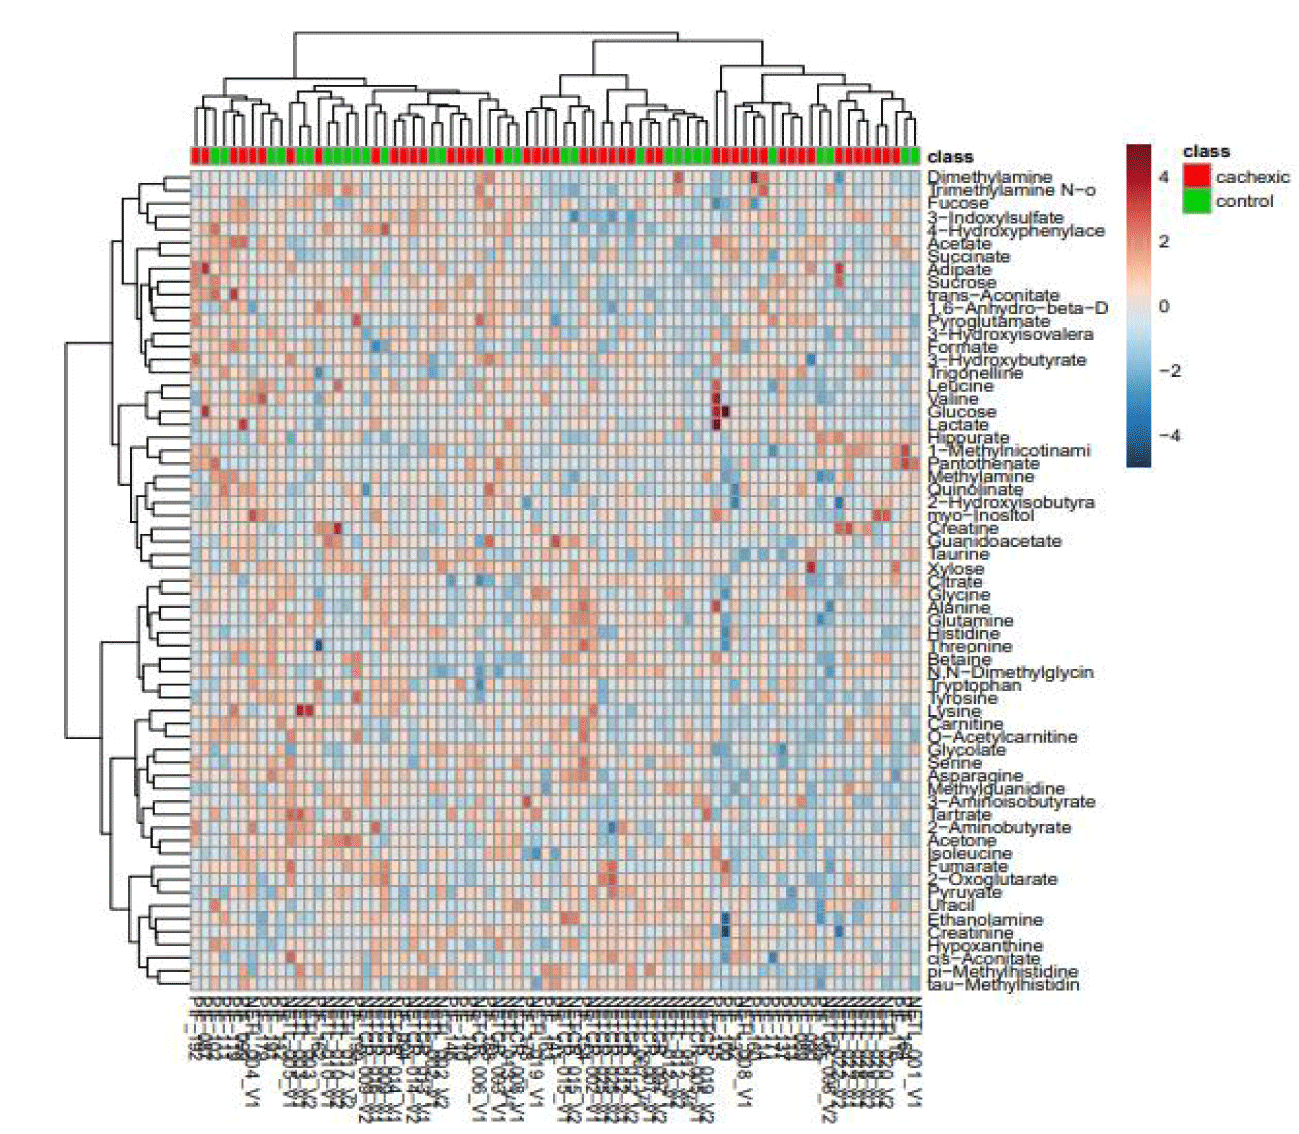
In (agglomerative) hierarchical cluster analysis, each sample begins as a separate cluster and the algorithm proceeds to combine them until all samples belong to one cluster. Two parameters need to be considered when performing hierarchical clustering. The first one is similarity measure, euclidean distance, pearson’s correlation, spearman’s rank correlation. The other parameter is clustering algorithms, including average linkage (clustering uses the centroids of the observations), complete linkage (clustering uses the farthest pair of observations between the two groups), single linkage (clustering uses the closest pair of observations) and Ward’s linkage (clustering to minimize the sum of squares of any two clusters). Heatmap is often presented as a visual aid, figure 9 shows the clustering result in the form of a dendrogram [6].
According to these results, we can interpret from the amount of sucrose and glucose that there is a close correlation between cachexia and getting diabetes because the amount of sugar should be not significant in normal people or at least below sugar threshold. As shown in figure 10, clustering result shown as heatmap (distance measure using Euclidean, and clustering algorithm using ward. D to see that red for the highest concentration and blue for the lowest concentrations the highest expression of compound are glucose in cachexic patients and lactose were the least one is creatinine in cachexic patients.
Discussion
From the previous results, we see different concentrations of chemical compounds in urine while most of them are very low but from the results, we can interpret from the amount of sucrose and glucose that there is a correlation between cachexia and getting diabetes because the amount of sugar should be not significant in normal people or at least below sugar threshold [7].
Conclusion
Strategies and techniques as genomics, proteomics and metabonomics are used widely nowadays in many fields especially in pharmaceutical industry. For each of these techniques, toxicological response can be measured by baseline status terms. However, to accurately define the response induced by drugs, it is necessary to characterize different effects without inter-animal and diurnal variation, sex, age, diet, lifestyle, species, strain, hormonal status and stress using urinary metabolites profiles because it is safe and not invasive method. Pattern recognition method can help in comparison of urine NMR spectra and given time-course, which highlights metabolic status of any organism to monitor any biochemical changes. Thus metabonomic approaches based on information-rich databases to investigate drug safety issues with accurate prognosis and diagnosis.
References
- Akçay MN, Akçay G, Solak S, Balik AA, Aylu B. The effect of growth hormone on 24-h urinary creatinine levels in burned patients. Burns. 2001 Feb;27(1):42-5. doi: 10.1016/s0305-4179(00)00056-5. PMID: 11164664.
- Antoun S, Baracos VE, Birdsell L, Escudier B, Sawyer MB. Low body mass index and sarcopenia associated with dose-limiting toxicity of sorafenib in patients with renal cell carcinoma. Ann Oncol. 2010 Aug;21(8):1594-1598. doi: 10.1093/annonc/mdp605. Epub 2010 Jan 20. PMID: 20089558.
- Asp ML, Tian M, Wendel AA, Belury MA. Evidence for the contribution of insulin resistance to the development of cachexia in tumor-bearing mice. Int J Cancer. 2010 Feb 1;126(3):756-63. doi: 10.1002/ijc.24784. PMID: 19634137.
- Bertini I, Calabrò A, De Carli V, Luchinat C, Nepi S, Porfirio B, Renzi D, Saccenti E, Tenori L. The metabonomic signature of celiac disease. J Proteome Res. 2009 Jan;8(1):170-7. doi: 10.1021/pr800548z. PMID: 19072164.
- Bidlingmeyer BA, Cohen SA, Tarvin TL. Rapid analysis of amino acids using pre-column derivatization. J Chromatogr. 1984 Dec 7;336(1):93-104. doi: 10.1016/s0378-4347(00)85133-6. PMID: 6396315.
- Bollard ME, Stanley EG, Lindon JC, Nicholson JK, Holmes E. NMR-based metabonomic approaches for evaluating physiological influences on biofluid composition. NMR Biomed. 2005 May;18(3):143-62. doi: 10.1002/nbm.935. PMID: 15627238.
- Cover TM, Thomas JA. Elements of information theory. Hoboken: NJ: Wiley-Interscience; 2006.
Content Alerts
SignUp to our
Content alerts.
 This work is licensed under a Creative Commons Attribution 4.0 International License.


