Biology Group . 2023 July 31;4(6):1156-1165. doi: 10.37871/jbres1781.
Determination of Organic and Reduced Inorganic Sulfur by Multi-element Scanning Thermal Analysis
Yuch-Ping Hsieh* and Glynnis C Bugna
- Organic sulfur
- Reduced inorganic sulfur
- S, C, N and H thermograms
Abstract
Determination of organic sulfur in solid environmental samples has been difficult because there is no appropriate separation technology. Routine organic sulfur analysis has mostly been done indirectly by the difference between the total and the inorganic sulfur contents. This indirect analysis is tedious, accumulating multiple sampling and procedural errors, and has no chemical characterization information. There are modern technologies such as S-XANES for direct sulfur analysis on solid samples. But they are sophisticated, expensive, and unavailable for routine sulfur analysis. Due to those analytical difficulties, our understanding of sulfur chemistry in solid samples has been limited. This study was initiated to apply a convenient Multi-Element Scanning Thermal Analysis (MESTA) method for direct analysis of organic and reduced inorganic sulfur in solid samples. If successful, sulfur MESTA will be a convenient and powerful tool for studying environmental sulfur cycles and sulfur-containing materials. We used 27 reference organic and reduced inorganic sulfur compounds to validate the MESTA method. The results indicate that MESTA can directly quantify and characterize organic and reduced inorganic sulfur compounds. Recoveries of the reference compounds were in the range of 77.0% to 97.7% except for sulfate functional group containing compounds of bathophenanthrolinedisulfonic acid (57.4 ± 6.7%), sodium thiosulfate (60.6 ± 3.1%) and sodium dodecyl sulfate (38.0 ± 2.6%). MESTA is rapid, sensitive, and inexpensive. It is a convenient and powerful tool for sulfur analysis in a wide range of solid, liquid, or mixed samples.
Introduction
Sulfur is an essential nutrient for all organisms. Sulfur also plays an important role in many biogeochemical cycles of terrestrial and aquatic systems on a global scale [1,2]. Sulfur exists in many oxidative states (from -2 to +6) and forms [3]. Analysis of organic sulfur in solid samples, however, has been difficult. Most routine organic sulfur analyses in solid samples have been done indirectly by the difference between the total and the inorganic sulfur contents [4]. This indirect method is tedious, accumulating double errors in sampling and analytical procedures and giving no chemical characterization information about the sulfur compounds.
Unlike liquid or gaseous samples, which are in a homogeneous phase, solid samples are heterogenous and lack an appropriate separation technology. In recent years, sophisticated direct methods like solid-state NMR spectroscopy combined with X-ray Photoelectron Spectroscopy (XPS) and sulfur X-ray Absorption Near Edge Structure (S-XANES), Energy Dispersive X-ray Fluorescence spectrometry (EDXRF) or Fourier Transform Ion Cyclotron Resonance Mass Spectrometry (FT-ICR MS) have been applied to the analysis of organic sulfur in solid samples [5-10]. Those sophisticated methods, however, are expensive, and not available for routine analysis. Due to those analytical difficulties, our knowledge pertaining to environmental sulfur cycles and sulfur-containing materials has been limited. Sulfur is the third major nutrient after nitrogen and phosphorus but studies on sulfur cycles are much less than nitrogen or phosphorus cycles.
A Multi-Element Scanning Thermal Analysis (MESTA) technology has been developed to analyze aerosols and other solid samples [11-14]. MESTA is a quantitative analytical technology that determines the thermochemical property of the compounds in a sample in terms of their C, N, S, and H thermograms [11-14]. It can perform rapid and inexpensive analysis on a wide range of solid, liquid, or mixed samples with little or no pretreatment requirement. This study was initiated to investigate the application of the MESTA technology on the direct analysis of organic and reduced inorganic sulfur species. If feasible, sulfur MESTA would be a convenient and powerful tool for studying environmental sulfur cycles and sulfur-containing materials.
Experimental
Materials
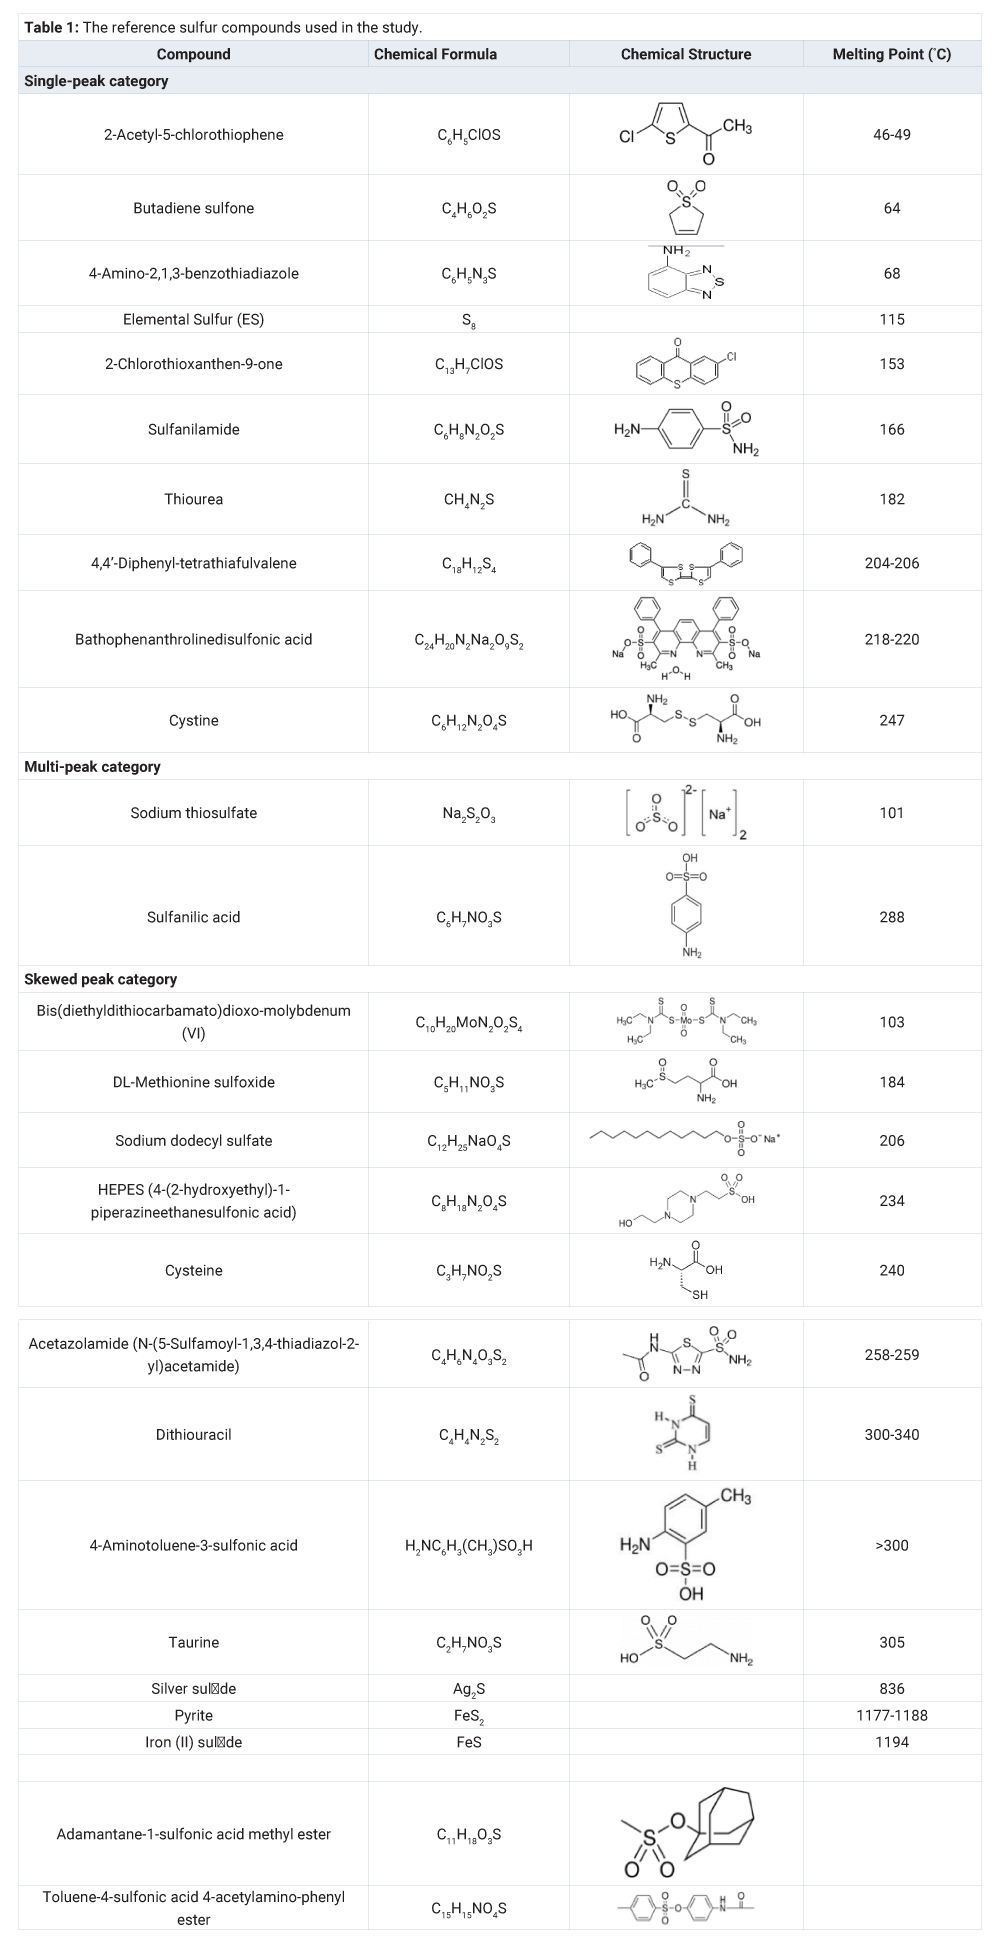
Twenty three reference organic sulfur compounds in different oxidation states and four reduced inorganic sulfur specimens in different forms were obtained from Sigma-Aldrich (www.sigmaaldrich.com). These reference compounds and specimens are listed in table 1.
The MESTA procedure
The proper size of sulfur for MESTA is in a range between 0.5 µg and 25 µg. We diluted the reference samples with a 700°C pre-baked talc. Dilution not only made weighing convenient without a microbalance but also minimized the localized temperature burst during MESTA, which generated thermogram spikes. The amount of sulfur in the compound/talc mixture was further verified by the total sulfur analysis using a Multitek total S analyzer (PAC LP, Houston, TX).
Details of the MESTA can be found in our previous works [11-14]. Briefly, the MESTA device has a quartz tube divided into a sample compartment and a combustion compartment. The sample compartment was heated by a programmable furnace from 40 to 650°C at a constant rate of 50°C/min. The sample compartment was fed with a 40/60 volume mixture of extra-high purity O2 and He gas carrier at a flow rate of 80 mL/min. The combustion compartment was heated by a separated furnace to a constant 1100°C and fed with extra-high purity O2 at a flow rate of 350 mL/min. The selected heating rate and carrier gas minimize the charring of the organic carbon (to form black carbon) during the analysis [12]. The maximum sample temperature of MESTA was set to 650°C to exclude sulfate. (The reason for that is discussed in detail in the Results and Discussion sections.)
The carrier gas carried the volatile from the sample chamber into the combustion compartment, in which the C, N, S and H contents were oxidized into CO2, NO2, SO2, and H2O, respectively, and quantified by a CO2 and H2O IR analyzer (Li-840A, Li-COR Biosciences, Lincoln, NE), a NO2 chemiluminescent and a SO2 chemiluminescent detector (PAC LP, Houston, TX). A PC-based multi-channel data logger (Model DI-4108 High Speed DAQ, Data Instruments, Inc., Akron, OH) was used to record simultaneously the real-time sample temperature, CO2, NO2, SO2 and H2O signals. Standard calibration curves of C, N, S and H were obtained by mixtures of cystine and glucose standards.
Recovery of sulfur in MESTA
The recovery of S in the reference compounds in MESTA was estimated by two independent methods: 1) calculated based on the theoretical S value in the sample, assuming the reference compound was 100 % pure and 2) based on the measured total S of MESTA and the residual S remained in the sample boat after MESTA, which was determined by the Multitek total S analyzer.
Results and Discussion
Accuracy and precision of analysis
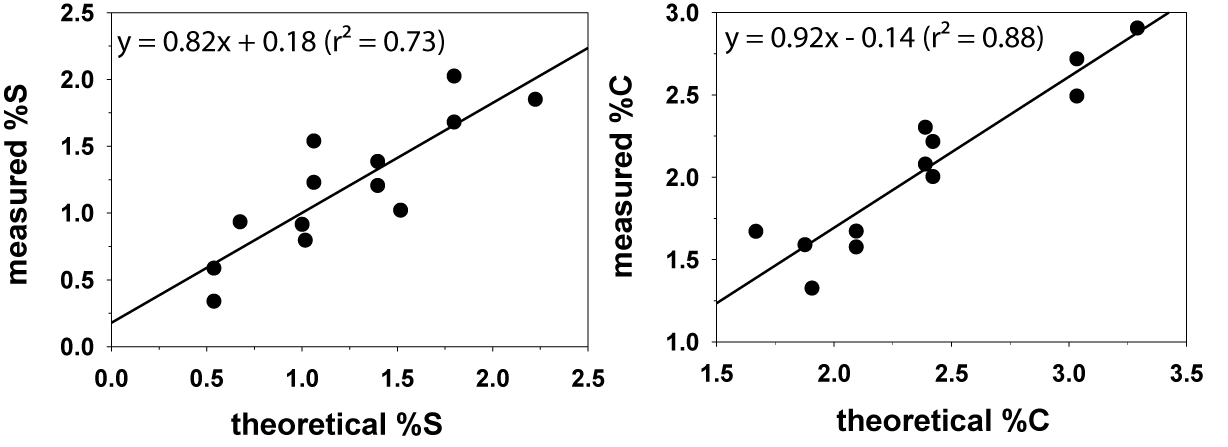
We used mixtures of reagent-grade cystine and glucose to generate calibration curves of sulfur, carbon, and nitrogen. These calibration curves have good linearity in at least one order of magnitude (Figure 1). We also checked the measured S and C contents of the reference compounds with their theoretical values (Figure 2). On average, the measured of S and C contents were 99 ± 13% and 86 ± 9% respectively of the theoretical values, assuming that the reference compounds were 100% pure. The standard deviations of the S and C determinations in duplicated samples were 12.6% and 4.4%, respectively. The variation in peak position in the MESTA thermogram of duplicated samples was ±15°C.
Reference sulfur compounds
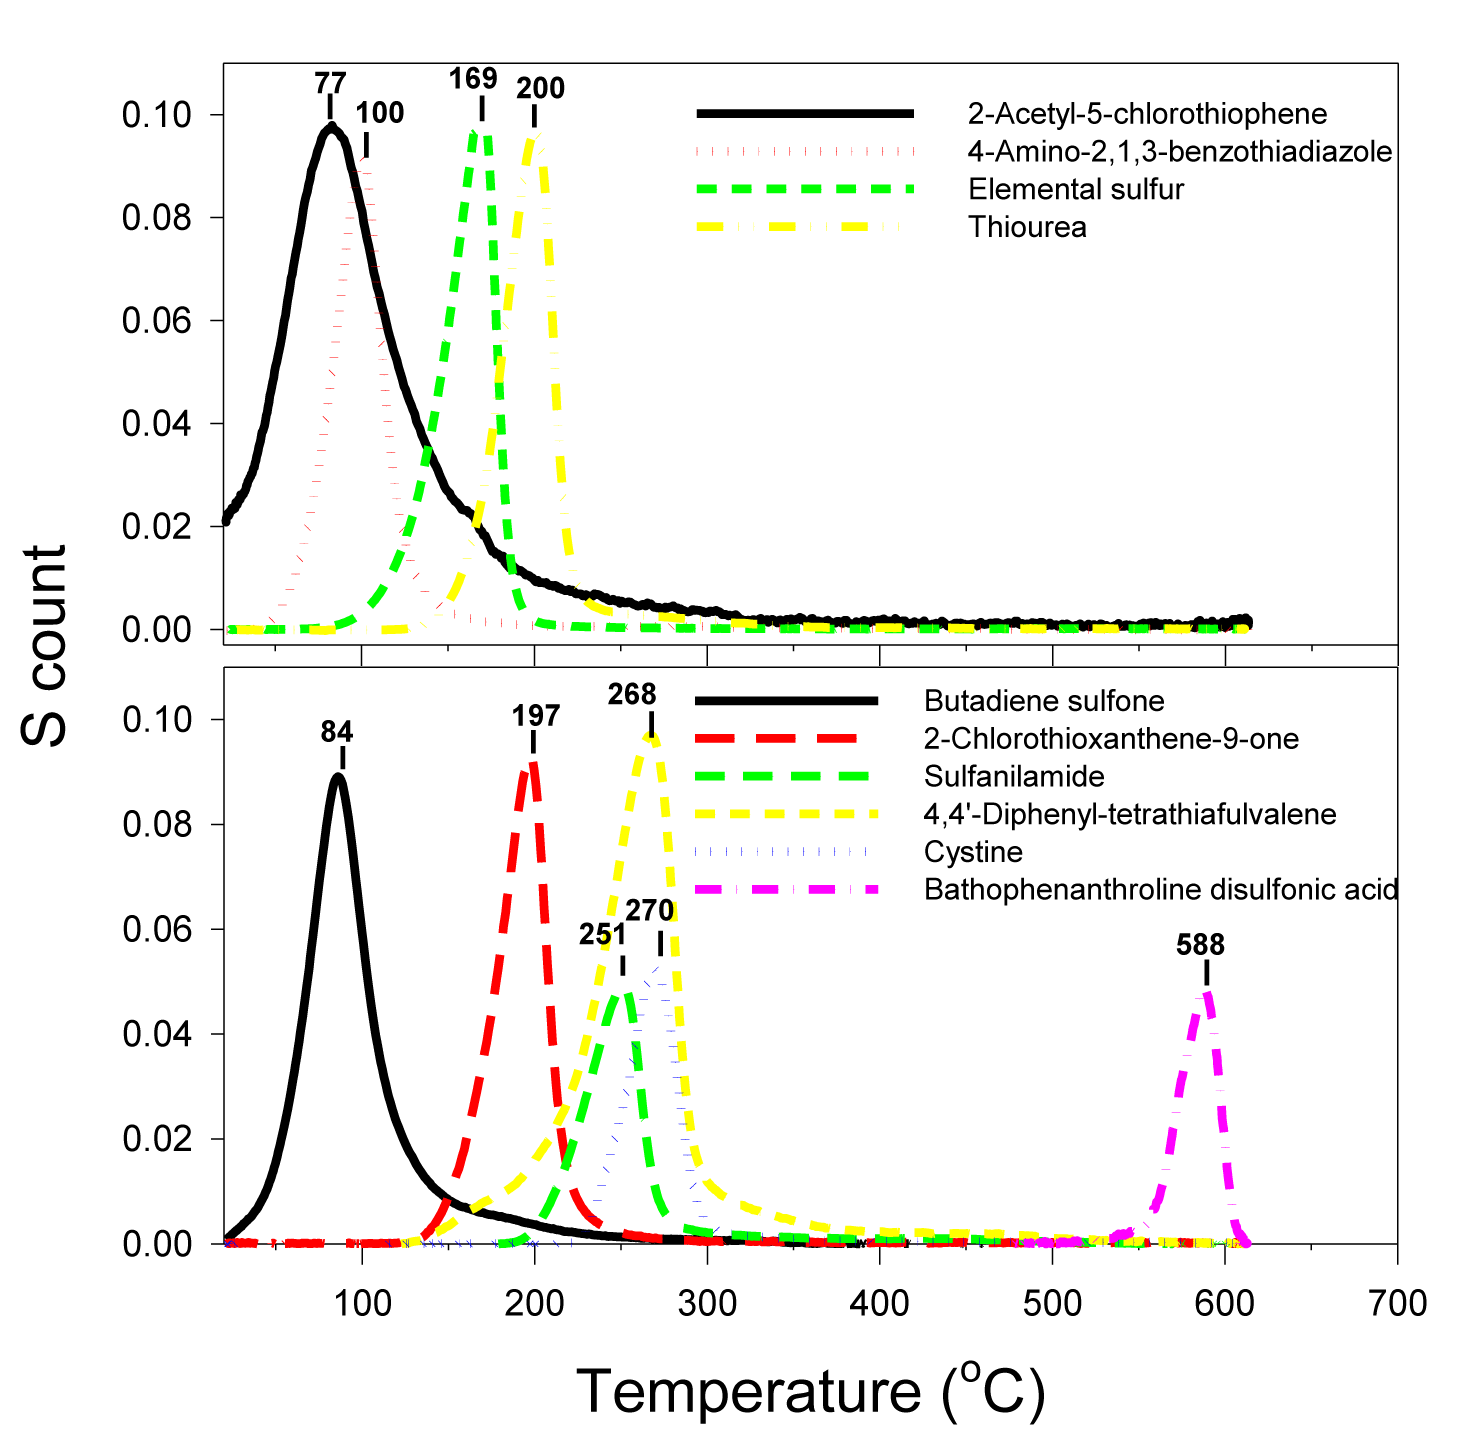
According to the peak distribution of the sulfur thermogram, the reference sulfur compounds can be classified into three categories: 1) single peak, 2) skewed peak, and 3) multiple peaks. The single-peak category (Figure 3) (Table 1) is represented by the compounds of 2-acetyl-5-chlorothiophene (melting point, or MP = 46-49°C), butadiene sulfone (MP = 64°C), 4-amino-2,1,3-benzothiadiazole (melting point, or MP = 68°C), elemental sulfur (MP = 115°C), 2-chlorothioxanthen-9-one (MP = 153°C), thiourea (MP = 182°C), sulfanilamide (MP = 166°C), 4,4’-diphenyl-tetrathiafulvalene (MP = 204°C -206°C), cystine (MP = 247°C) and bathophenathrolinedisulfonic acid (MP = 218°C-220°C). The sulfur peak temperatures follow their order of melting points except for sulfanilamide and bathophenathrolinedisulfonic acid. The thermograms of these sulfur compounds suggest that the sulfur compounds vaporized/decomposed at the characteristic temperature with single and relatively symmetrical peak (Table 1). MESTA is a scanning thermal method that has a kinetic effect on the thermogram peak temperature depending on the scanning rate (50°C/minute in this case). The kinetic effect shifts the peak temperature towards a higher value than its true evaporation/decomposition peak temperature (Figure 3) (Table 1).
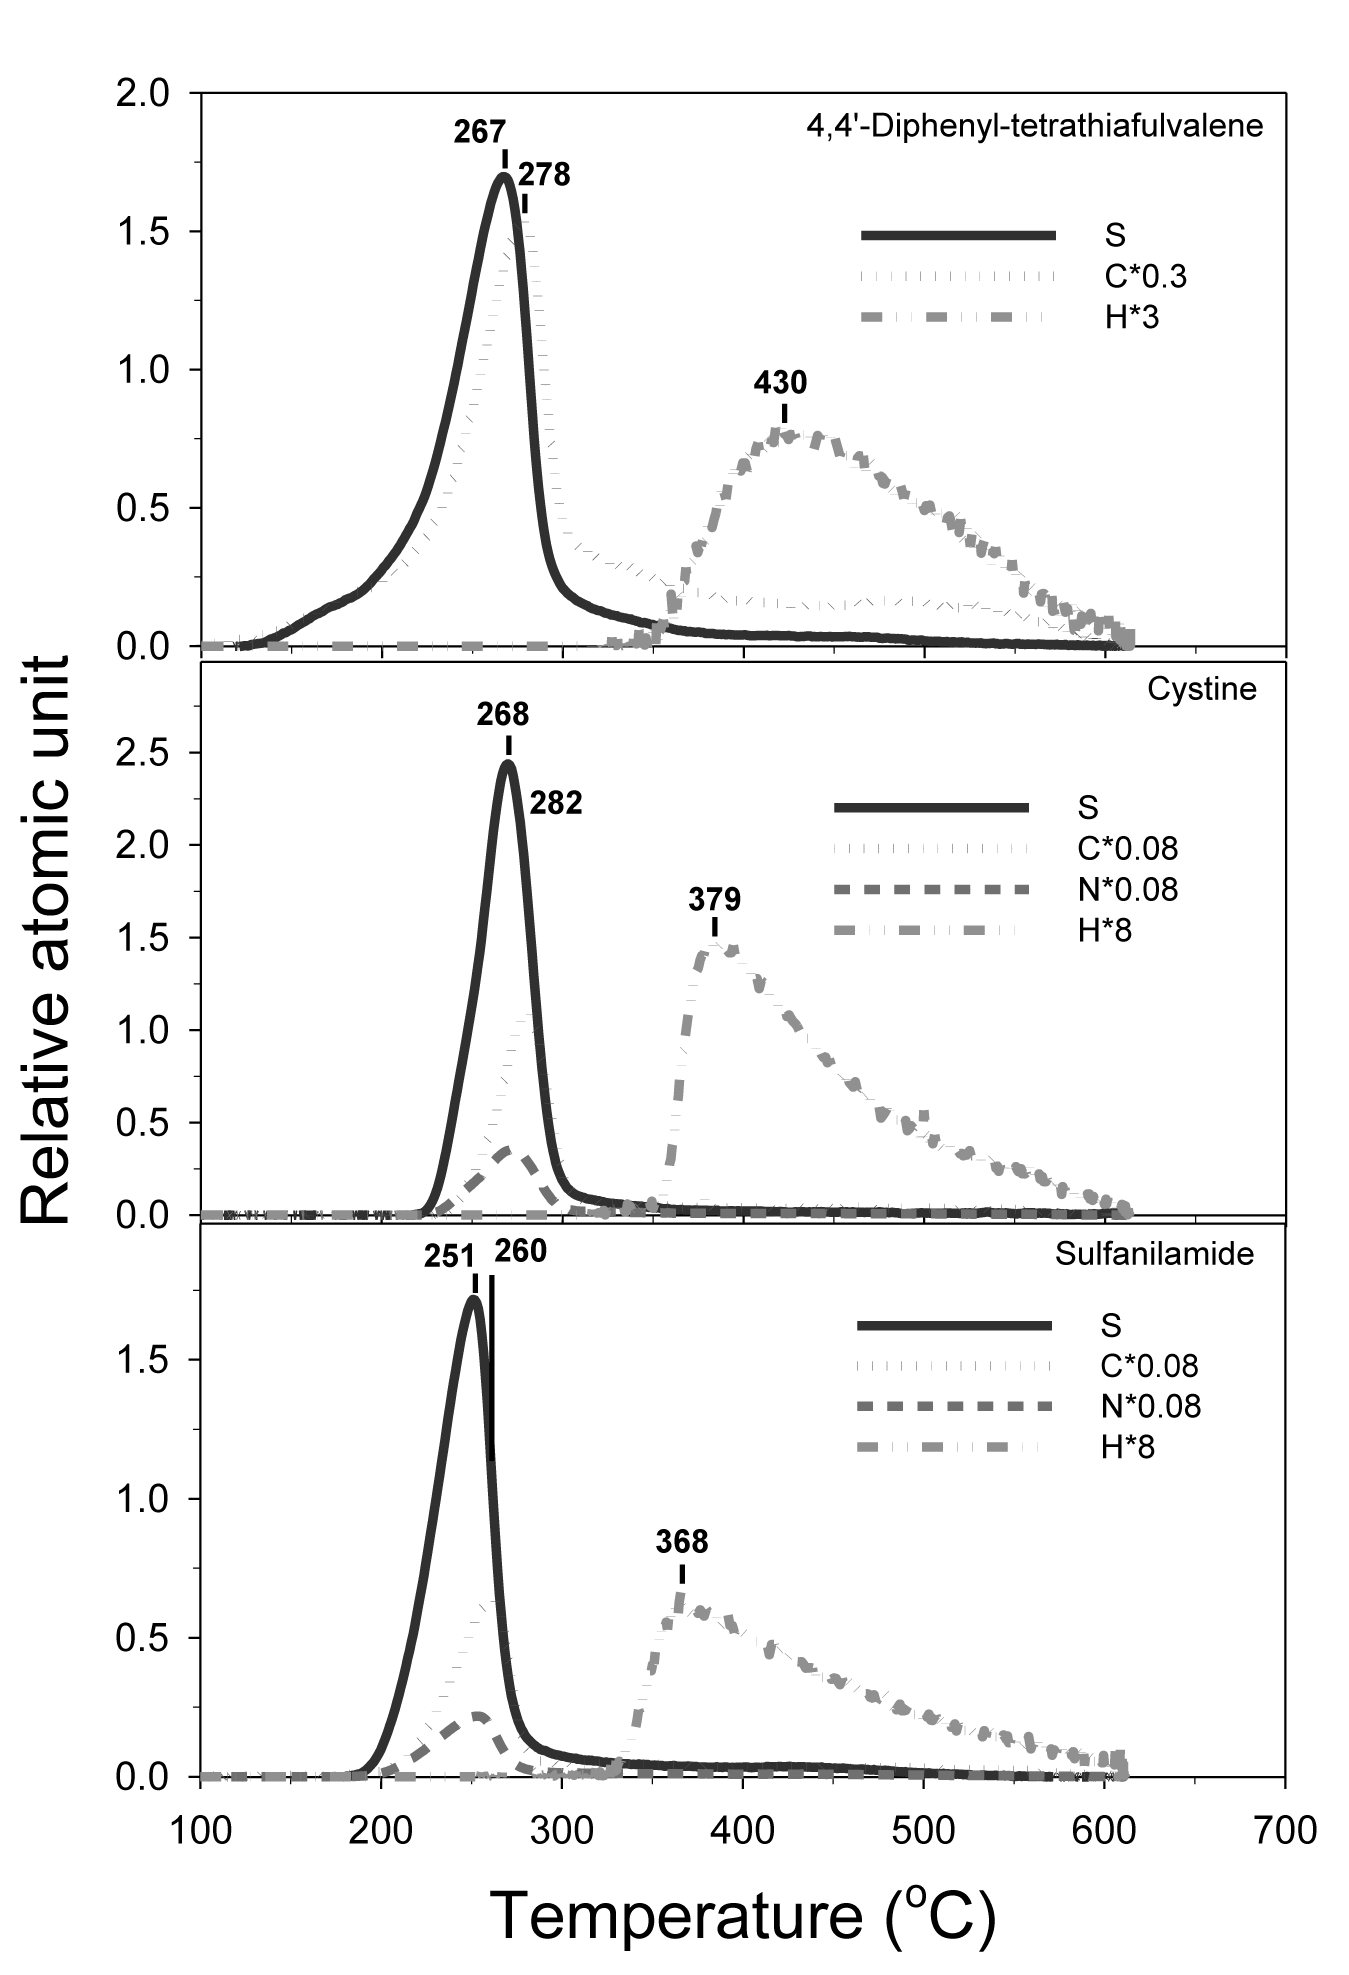
Some compounds had their peak temperature overlapped or clustered in a close range. However, the simultaneously generated companion C, N, and H thermograms can be used to differentiate among those compounds. For example, 4,4’-diphenyl-tetrathiafulvalene, cystine and sulfanilamide all have peaks overlapping in the temperature range between 250°C and 270°C (Figure 3). Since 4,4’-diphenyl-tetrathiafulvalene has no nitrogen and therefore can be easily recognized among the three. Cystine and sulfanilamide can be differentiated by their H/S ratios: the former was 12 and the latter was 8 (Figure 4).
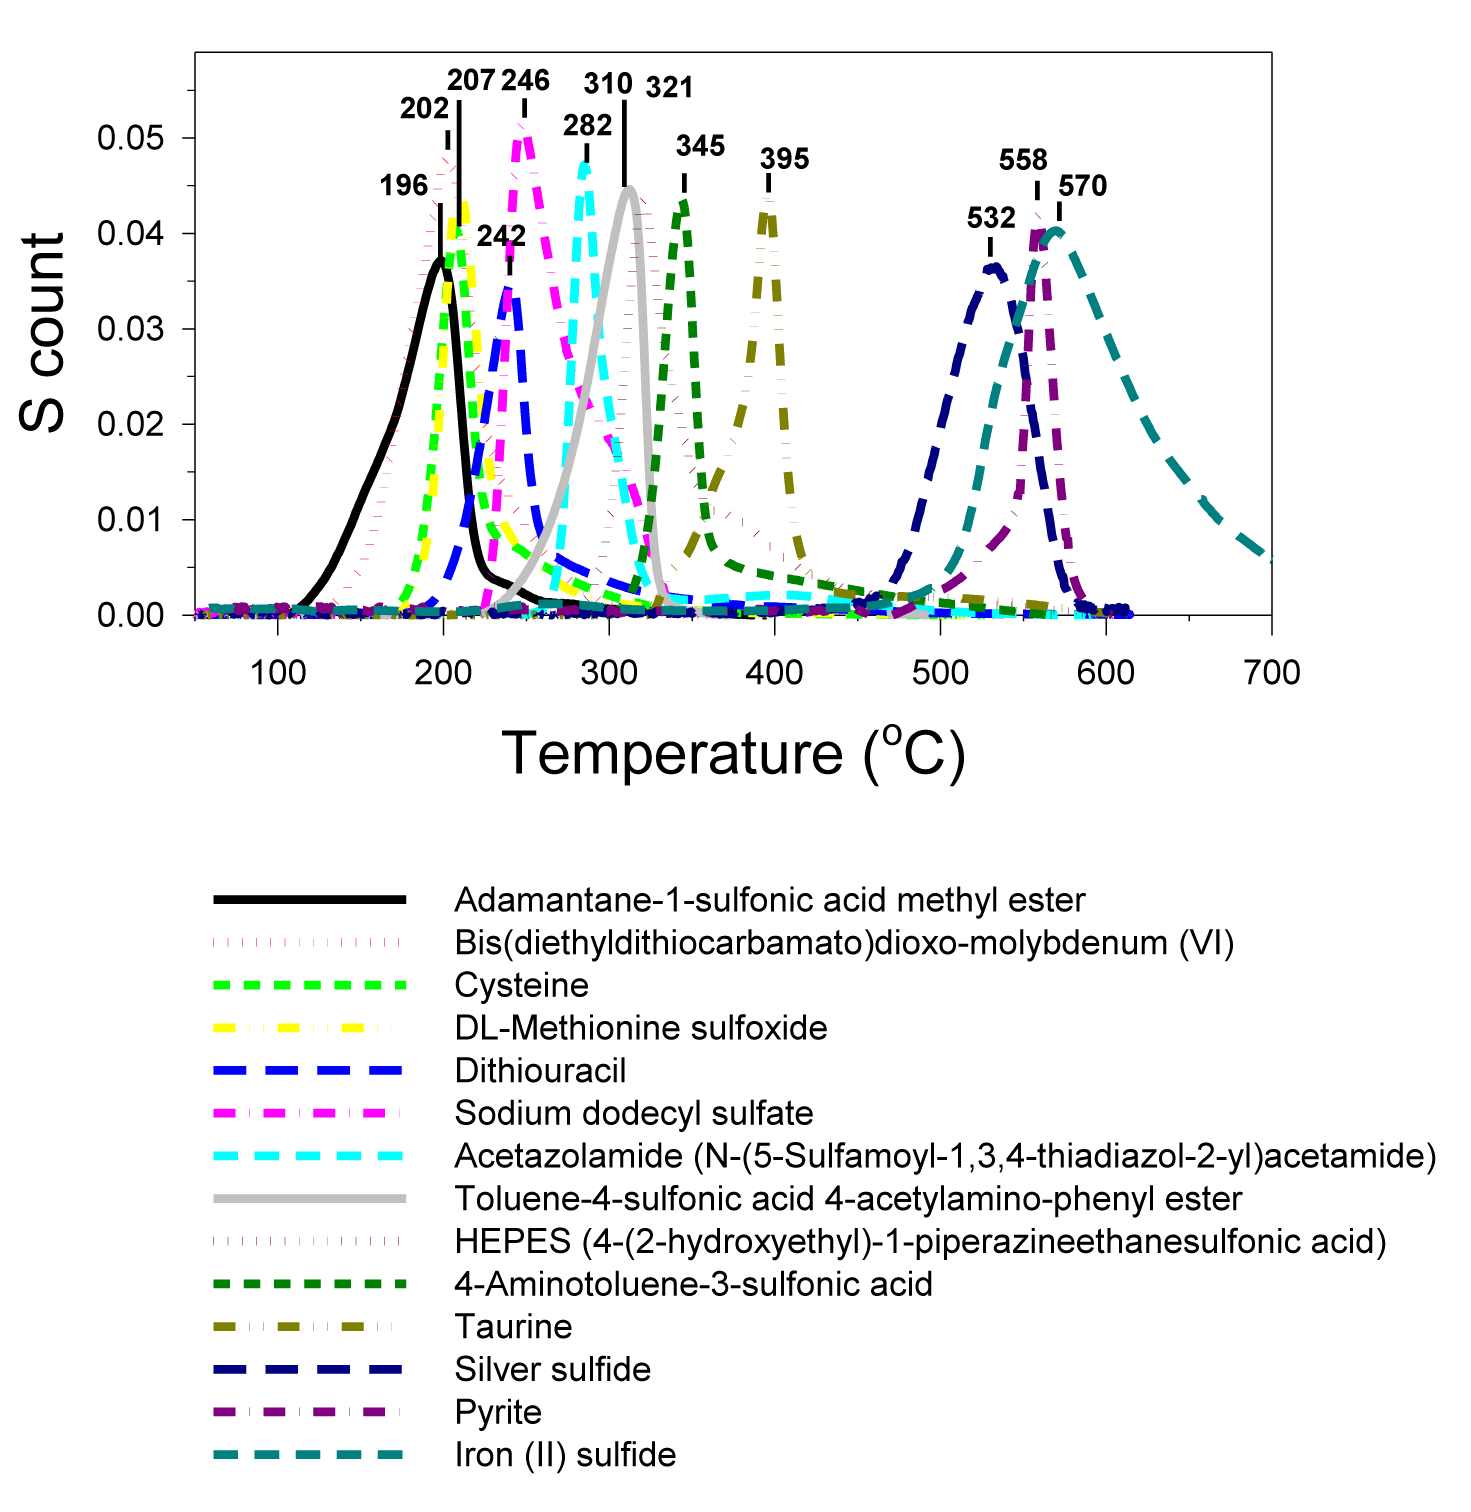
The skewed-peak category (Figure 5) (Table 1) is represented by bis(diethyldithiocarbamato) dioxomolybdenum(VI), DL-methionine sulfoxide, sodium dodecyl sulfate, HEPES (4-(2-hydroxyethyl)-1-piperazineethanesulfonic acid), cysteine, acetazolamide (N-(5-sulfamoyl-1,3,4-thiadiazol-2-yl) acetamide), dithiouracil, 4-aminotoluene-3-sulfonic acid, taurine, adamantine-1-sulfonic acid methyl ester, toluene-4-sulfonic acid 4-acetylamino-phenyl ester, silver sulfide, pyrite and iron (II) sulfide.
One possible explanation for the skewed peak would be the incongruent decomposition of sulfur functional groups during the thermal scanning process. For example, cysteine has its amide and sulfide functional groups exposed, which enables their interaction and causes slightly higher peak temperature than those non-interacted molecules resulting in a skewed peak (Figure 5). Cystine (Figure 3), the dimer of cysteine, has a single symmetric peak because the sulfide functional groups are locked up to each other and prevent the interaction with the amide functional groups.
The inorganic sulfides and bi-sulfide (pyrite) all have high melting points (836°C-1,188°C). Their MESTA peaks (561°C-585°C), however, were much lower than their melting points. Apparently, the oxygen in the carrier gas oxidized and decomposed the sulfides at much lower temperatures than their melting points. Inorganic sulfides could be oxidized when exposed to the air at room temperature, especially when they are in powder form. Partially oxidized inorganic sulfides probably were the reason for the skewness of their peaks. Freshly ground silver sulfide and iron bi-sulfide (pyrite) had sharper peaks than the stocked iron sulfide powder (Figure 5). The much broader and skewed peak of the stock iron sulfide reflected the partially oxidized iron sulfide.
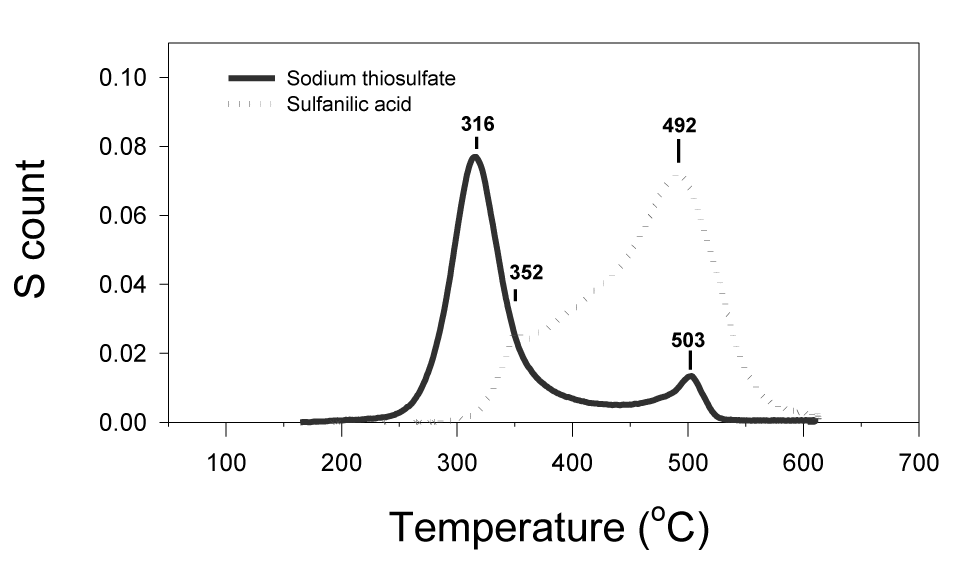
The multi-peak category (Figure 6) (Table 1) is represented by the compounds of sodium thiosulfate (Na2S2O3) and sulfanilic acid. Sodium thiosulfate had a major peak at 316°C and a minor peak at 503°C. Sulfanilic acid had a major peak at 492°C and a minor peak at 352°C.
We intentionally excluded solid sulfates (MP ≥ 884°C) from the MESTA by limiting the maximum temperature to 650°C. The onset temperature of the sodium sulfate peak was around 725-750°C. Vaporization of sodium sulfate cannot be completed even heated to 870°C, the maximum temperature achievable by the sample furnace. Not only the vaporization cannot be completed at 870°C, it could be re-condensed in the corners of the sample compartment where the temperature was slightly cooler. This can cause a serious cross-contamination problem for MESTA in sulfur analysis. Therefore, we set the maximum temperature of sulfur MESTA to 650°C before the onset of sulfate vaporization and excluded sulfate from the analysis. Sulfate salts can be analyzed by a 1200°C Multitek total sulfur analyzer.
Ammonium sulfate has a low MP at 235°C. When we ran MESTA on ammonia sulfate, there was no sulfur peak but two nitrogen peaks (226 and 283°C, data not shown). Obviously, ammonium sulfate was vaporized/decomposed during MESTA, but only nitrogen was carried out of the sample compartment leaving sulfate re-condensed somewhere in the sample boat. We verified this by analyzing the residual sulfur in the sample boat after the MESTA using the Multitek total sulfur analyzer and recovered the sulfate.
We also ran MESTA on sulfuric acid. The sulfur peak appeared at 382°C, which was slightly higher than its boiling point (337°C) (data not shown). We concluded that although solid sulfate salts, including ammonia sulfate, were excluded from MESTA below 650°C but sulfuric acid was included in the analysis.
Recovery of the reference organic and sulfide specimens
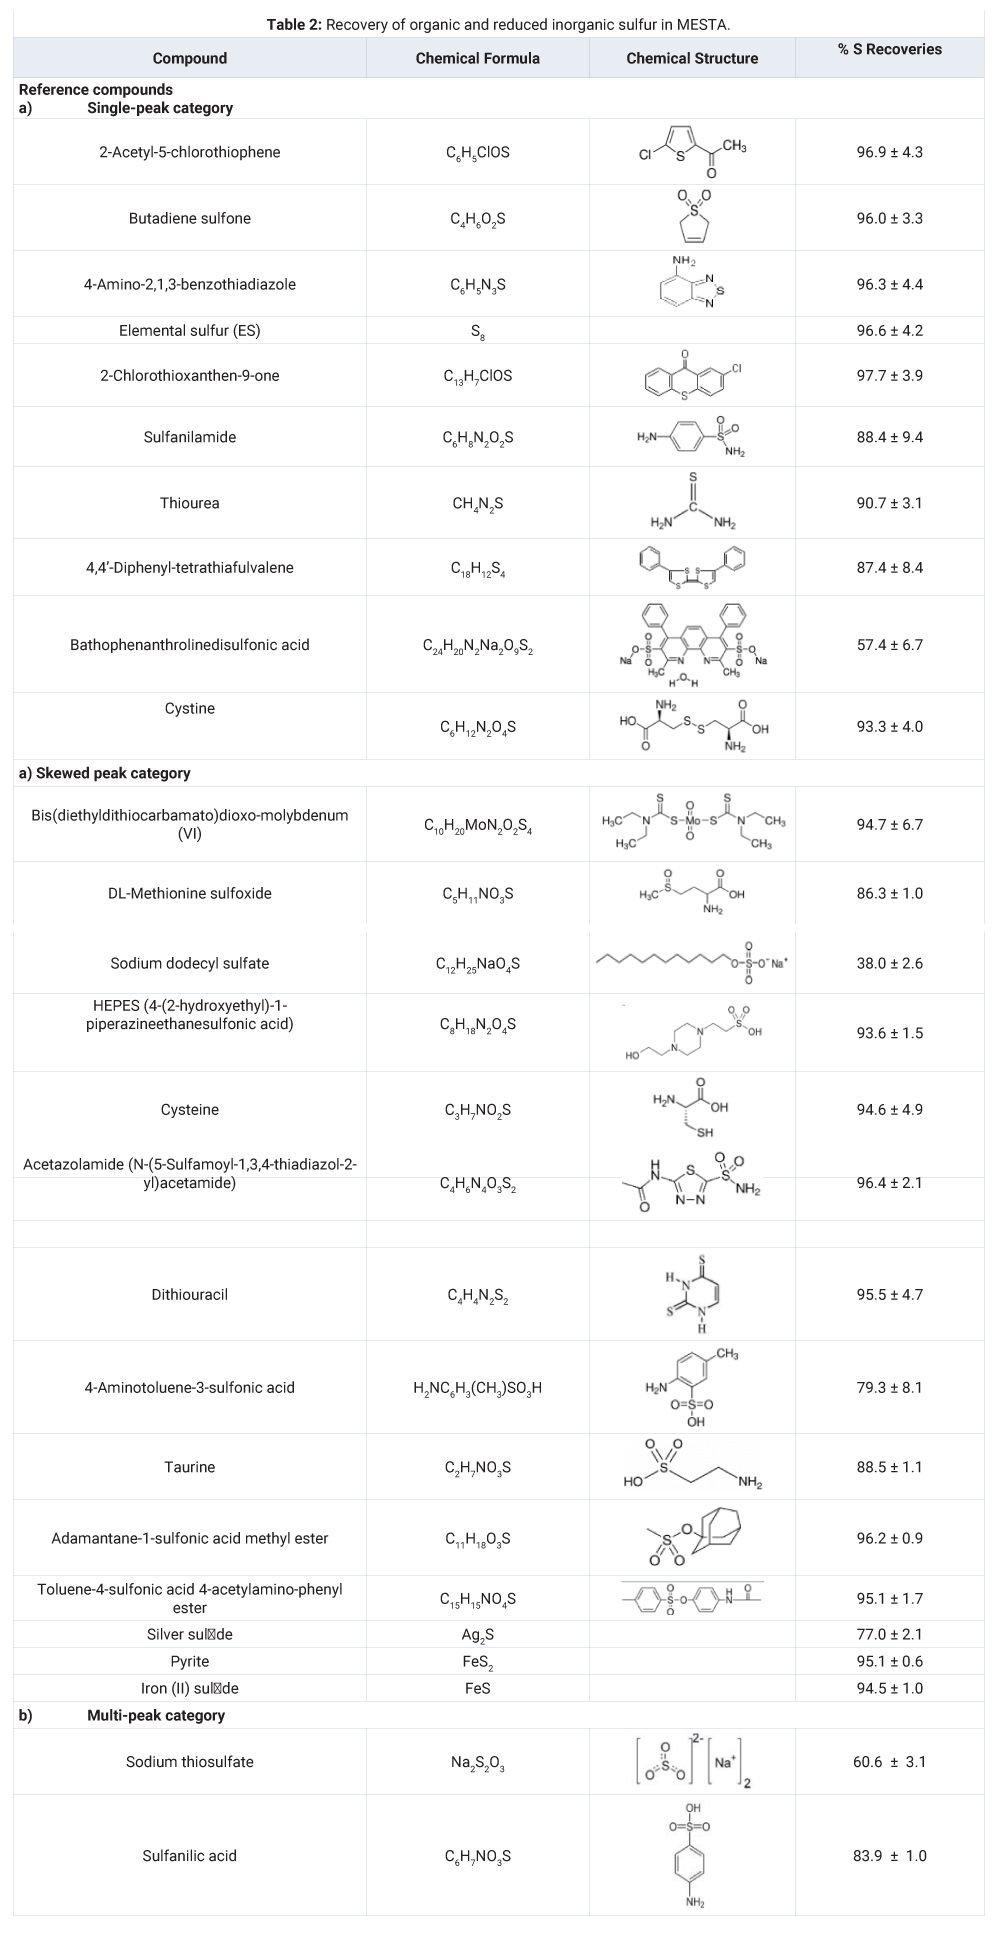
The S recoveries of the reference organic sulfur compounds and the reduced inorganic sulfur are listed in table 2. Two independent methods were used to calculate the S recoveries in MESTA. The two methods for S recovery agreed very well for the reference organic compounds. The S recovery of the iron sulfide by the first method was only 78% but that by the second method was 94.5%. This was because the iron sulfide specimen contained non-sulfur impurities. Excluding the non-sulfur impurity in the iron sulfide specimen, the iron sulfide was quantitatively recovered. Recoveries of the reference compounds and reduced inorganic sulfur specimens were in the range between 77.0% and 97.7%, except for bathophenanthrolinedisulfonic acid (57.4 ± 6.7%), sodium thiosulfate (60.6 ± 3.1%) and sodium dodecyl sulfate (38.0 ± 2.6%). The low recovery organic sulfur compounds all have sulfate functional groups with high oxidative status (+4 and +6) (Table 1). A significant part of sulfate functional group in those compounds have been turned into sulfate cations and bounded to the sample boat in MESTA. Those residual S in the sample boat after MESTA could be recovered by the 1200°C Multitek total S analyzer. The second method for S recovery estimate, however, could not differentiate the original sulfate content from that secondarily formed during MESTA. We suspect that the lower recovery of the silver sulfide specimen (77%) was one of those cases that it contained some sulfate impurity initially, which could not be detected by the 650°C MESTA but could by the 1200°C Multitek total S analyzer.
It has been pointed out in previous studies [11,12] that MESTA is a kinetic, thermal scanning process in which the deviation of a peak temperature of a thermogram from its true decomposition peak temperature is a function of the sample heating rate and the activation energy of the thermal decomposition. A comparison of MESTA thermograms among samples needs to be made under the same sample heating rate and the same composition of the carrier gas.
Conclusion
This study showed that the reference organic and reduced inorganic sulfur can be quantified and, thermochemically characterized directly by MESTA. Recoveries of sulfur of the references are very good except bathophenanthrolinedisulfonic acid (57.4 ± 6.7%), sodium thiosulfate (60.6 ± 3.1%) and sodium dodecyl sulfate (38.0 ± 2.6%). Those three compounds all contain sulfate functional groups, which became sulfate ions and bound to the sample boat during MESTA. The sulfur MESTA can be applied to solid, liquid, or mixed samples of pharmaceutical, petroleum, and environmental sources. The sulfur MESTA is rapid, sensitive, and inexpensive suitable for routine sulfur analysis. The companion carbon, nitrogen, and hydrogen thermograms, which are generated simultaneously along with the sulfur thermogram, can be used to provide constraints for the identification and characterization of the sulfur compounds. The MESTA fills a significant gap in routine sulfur analysis of solid samples. It is a convenient and powerful tool for the study of environmental sulfur cycles and sulfur-containing materials.
Acknowledgment
This work was partially funded by a grant from the National Science Foundation awarded to the authors (NSF Award # 0962970).
References
- Trudinger PA, Chemistry of the sulfur cycle. In: Tabatabai MA, editor. Sulfur in Agriculture, Agron Monogr. 27, ASA, CSSA, SSSA, Wisconsin; 1986. p.1-22.
- Schlesinger W, Bernhardt E. Biogeochemistry: An analysis of global change. 3rd ed. San Diego: Academic Press; 2013.
- Freney FR. Forms and reactions of organic sulfur compounds in soils. In: Tabatabai MA, editor. Sulfur in Agriculture, Agron Monogr. 27, ASA, CSSA, SSSA, Wisconsin; 1986. p.207-232.
- Blanchar RW. Measurements of sulfur in soils and plants. In: Tabatabai MA, editor. Sulfur in Agriculture, Agron Monogr. 27, ASA, CSSA, SSSA, Wisconsin; 1986. p.455-490.
- Kelemen SR, Afeworki M, Gorbaty ML, Sansone M, Kwiatek PJ, Walters CC, Freund H, Siskin M, Bence AE, Curry DJ, Solum M, Pugmire RJ, Vandenbroucke M, Leblond M, Behar F. Direct characterization of kerogen by x-ray and solid-state C-13 nuclear magnetic resonance methods. Energy Fuels. 2007;21:1548-1561. doi: 10.1021/ef060321h.
- Prietzel J, Thieme J, Tyufekchieva N, Paterson D, McNulty I, Kögel-Knabner I. Sulfur speciation in well-aerated and wetland soils in a forested catchment assessed by sulfur K-edge X-ray Absorption Near-Edge Spectroscopy (XANES). J Plant Nutr Soil Sci. 2009;172:393-409. doi: 10.1002/jpln.200800054.
- Manceau, Nagy K. Quantitative analysis of sulfur functional groups in natural organic matter by XANES spectroscopy. Geochim Cosmochim Acta. 2012;99:206-223. doi: 10.1016/j.gca.2012.09.033.
- Bolin TB, Birdwell JE, Lewan MD, Hill RJ, Grayson MB, Mitra-Kirtley S, Bake KD, Craddock PR, Abdallah W, Pomerantz AE. Sulfur species in source rock bitumen before and after hydrous pyrolysis determined by X‑ray absorption near-edge structure. Energy Fuels. 2016;30:6264-6270. doi: 10.1021/acs.energyfuels.6b00744.
- Marguí E, Resano M, Queralt I. A sustainable and simple energy dispersive X-ray fluorescence method for sulfur determination at trace levels in biodiesel samples via formation of biodiesel spots on a suitable solid support. Spectrochim Acta B. 2019;156:7-12. doi: 10.1016/j.sab.2019.04.003.
- Liu L, Song C, Tian S, Zhang Q, Cai X, Liu Y, Liu Z, Wang W. Structural characterization of sulfur-containing aromatic compounds in heavy oils by FT-ICR mass spectrometry with a narrow isolation window. Fuel. 2019;240:40-48. doi: 10.1016/j.fuel.2018.11.130.
- Hsieh YP. A novel Multielemental Scanning Thermal Analysis (MESTA) method for the identification and characterization of solid substances. J AOAC Int. 2007 Jan-Feb;90(1):54-9. PMID: 17373436.
- Hsieh YP, Bugna GC. Analysis of black carbon in sediments and soils using Multi-Element Scanning Thermal Analysis (MESTA). Org Geochem. 2008;39:1562-1571. doi: 10.1016/j.orggeochem.2008.07.015.
- Hsieh YP, Bugna G, Robertson K. Thermochemical properties of PM2.5 as indicator of combustion phase of fires. Atmosphere. 2018;9:230-243. doi: 10.3390/atmos9060230.
- Hsieh YP, Bugna GC, Robertson KM. Examination of two assumptions commonly used to determine PM2.5 emission factors for wild fires. Atmos Environ. 2016;147:274-283. doi: 10.1016/j.atmosenv.2016.10.012.
Content Alerts
SignUp to our
Content alerts.
 This work is licensed under a Creative Commons Attribution 4.0 International License.


