Medicine Group. 2023 November 24;4(11):1614-1617. doi: 10.37871/jbres1839.
A Case of Holothuroidea-like Erythrocytes
Katiukhin LN* and Nikitina ER
- Erythrocytes
- Ektacytometry
- Deformability
Abstract
Ektacytometric examination of red blood cells with morphological anomaly is presented. Confocal microscopy of the blood from the patient N. shows the abundance of RBCs in the form of representatives of the Holothuroidea. RBCs from control patients exhibited an elliptical diffraction pattern whereas patient’s N. RBCs generated a diamond shaped diffraction pattern. Erythrocytes of the patient N. have sharply reduced deformability, plasticity and water permeability of membranes. For the first time, we propose to evaluate the plastic properties of the blood cell membrane itself based on the results of the analysis at low shear stress.
Introduction
The results of ektacytometric blood test are presented. 11 people aged 45-60 from staff of the 1st Medical Institute by name I.P. Pavlov were examined. All studied patients did not have pronounced pathologies of the cardiovascular system. In one person, N., unexpressed weakness with a diagnosis of polychrome anemia was revealed.
RBC deformability, reported as the elongation index, was determined at 37 °C by using osmotic gradient ektacytometry [1]. A small amount (90 μl) of each RBC suspension was resuspended in high viscous medium (polyvinylpyrrolidone; PVP; viscosity 20 cP) and sheared into a Couette system. Elongation index was calculated based on the width and height of the theoretical ellipse fitted on the diffraction pattern. The osmotic deformability profile of red blood cells, the so-called osmoscan, characterizes the deformability of the entire erythrocyte pool, which are tracked in a wide range of osmolality, with a characteristic point of inversion the erythrocytes into isotropic sphere.
We measured elongation index of the RBC suspension under a defined shear stress (10.5 Pa) and at increasing osmolality (100 to 600 mOsm/kg) to determine several parameters: Omin (i.e., the osmolality at which RBC deformability value reaches a minimum in the hypotonic region of the curve), EImax (i.e., the highest RBC deformability) and Ohyper, which corresponds to the osmolality at half of the EImax in the hypertonic region of the curve. Omin reflects the osmotic fragility and the S/V ratio, EImax depends on the membrane deformability and RBC surface area, and Ohyper reflects MCHC or internal viscosity of the red blood cell. In addition, we defined two more parameters: the deformability value at the swelling point of erythrocytes, which, according to our view, is a measure of the water permeability of the membrane and the osmotic resistance of the red blood cells as ΔO = (Ohyper - Omin) [2]. The detected polymodality of the osmoscan under the conditions of low stresses of the shift of 1.0 Pa allows you to evaluate the heterogeneity of red cells according to morphological characteristics or anisocytosis of the erythrocytes in the zone (170-190) mOsm, (290-310) mOsm and (400-420) mOsm, i.e. o(ei1), o(ei1) and o(ei1), accordingly. These deformability indices are the high-quality indicators of the stiffness of the membranes of the corresponding forms of red blood cells.
The data were analyzed using Microsoft Excel 7.0. Experimental data were presented as the arithmetic means with their mean quadratic deviations. Statistical analysis was carried out using Student’s t test for 5% level of significance.
Results
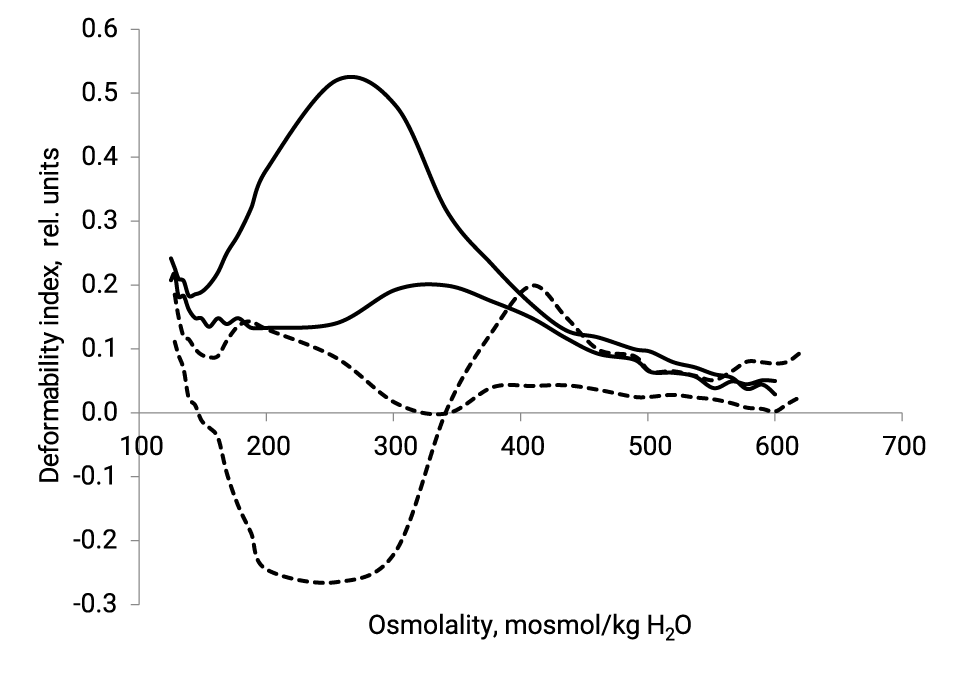
Results of osmotic RBC deformability are presented on figure 1 and in table 1.
| Table 1: Ektacitometric indexes of the red blood cells of the examined persons. | ||||||
| Patients | EImax | EImin | O(EImax) | Ohyper | Omin | ∆O |
| отн. ед. | мосмоль /кг H2O | |||||
| Healthy Patients, n = 10 | 0.526 ± 0.090 | 0.171 ± 0.080 | 268 ± 6 | 360 ± 11 | 139 ± 7 | 221 ± 12 |
| Case N. | 0.133 | 0.051 | 188 | 250 | 162 | 88 |
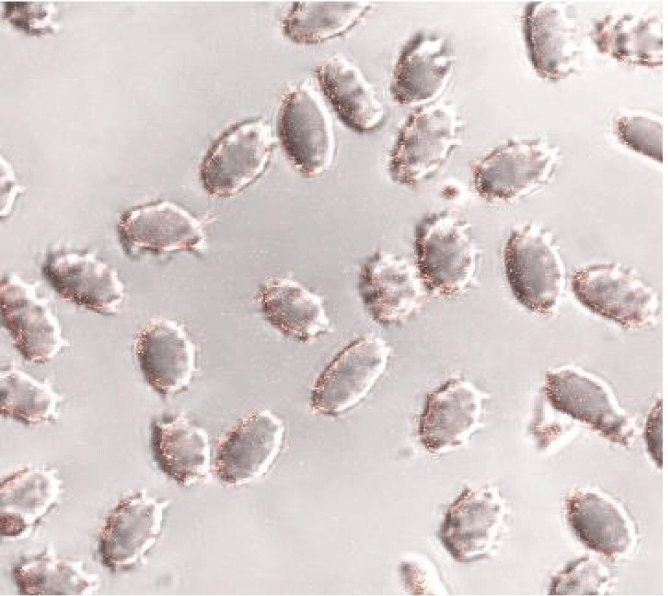
EImax of the patient N. have reduced by 4 times (by 75%), EImin - 3.5 times (by 70%), ∆O- in 2.5 times and Ohyper on 30%. The Omin point is shifted to the hypertensive region by 23 mOsm. The low-sheare-stress osmoscan of the blood of healthy patients have a distinct one peak o(ei2) at (290-310) mOsm. The low-sheare-stress osmoscanes of N. red blood cells is significantly changed by the appearance of a mode with negative values of “ei” in zones o(ei1) and o(ei2) and a pronounced peak of fashion o(ei3). A hematological analysis of the examined patients shows that haematocrit and the average volume of red blood cells are slightly reduced compared to healthy persons. However, these indicators do not go beyond the norm. Figure 2 shows the confocal picture of the N. erythrocytes.
Discussion
For researchers using ektacytometry, the interpretation of osmotic deformability profiles of red blood cells can be useful for a better understanding of the causes of violation of deformability. It has been established that healthy RBCs have a maximum deformability О(EImax) at around 290 mOsm, while dehydration of the cells causes a shift to the left in О(EImax). Since sickle RBC are susceptible to dehydration they have a much lower О(EImax) with a corresponding osmolality shifted of the maximum peak to the left [3,4]. N. erythrocytes in comparison with indicators in healthy individuals are significantly dehydrated and have increased internal viscosity (Ohyper), low water permeability of membranes (Omin) and a narrowed osmotic resistance range (ΔO). As a result of these reasons, they have 4 times less deformability and have a reduced spherical index (S/V), i.e. they turn out to be swollen compared to the red blood cells of healthy patients, as evidenced by the shift of the Omin to hypertensive region.
Measuring deformability in heterogenous blood is complicated by the fact that rigid and deformed cells do not properly align with the direction of flow in response to shear stress. Rather than producing a characteristic elliptical diffraction image thanks to discoid shape with a biconcave profile of normal erythrocytes, rigid cells produce a spherical pattern which results in a diamond-shaped diffraction pattern when overlaid on the ellipse produced by deformable cells. The degree of diffraction pattern distortion may be appreciated by complex mathematical analyses [5]. It can also be obtained by adjusting the opening of the camera aperture on the ektacytometer or the grey level of the fitting software to alter the diffraction pattern height [6]. However, details regarding how to adjust the grey level are not well defined and the camera aperture is not readily accessible. To circumvent these issues, the easily accessible camera gain can be used to adjust diffraction pattern heights [7].
We propose to evaluate the heterogeneity of cells in blood samples using osmotic deformability profiles with low shear stress. It is believed that the deformability of red blood cells with high shear stress basically affects their shape, or spherical (S/V) and internal viscosity, or the degree of hydration of hemoglobin. The results of previously performed studies on membrane drugs and whole cells showed that a decrease in red blood cell deformability at low shift voltage indicates an increase in the stiffness of the membrane [8,9]. It was later shown that a decreased RBC deformability at 3 Pa and below reflect a loss of membrane flexibility only [10]. We also showed that a change in the deformability indices of red blood cells at low-sheare-stress conditions, measured at 1.0 Pa, correlates with a change in the stiffness of membranes [11]. A comparison of the osmoscans remuved at 1Pa shows that the diffraction image of the N. erythrocytes are very distorted, unlike that in healthy persones. An elongation index is calculated on the basis of the geomerty of the ellipitical diffraction pattern like (L −W)/(L + W), where L and W are the length and width of the diffraction pattern, respectively. An increased elongation index at a given shear stress indicates greater cell deformation. The diamond shape generated by RBCs from patients with SCA in response to shear stress arises from the superposition of an elliptical pattern and a circular pattern. The elliptical shape arises from deformable erythrocytes and the circular pattern arises from rigid RBCs. The latter cells type tumbles in all directions, producing a circular diffraction pattern, rather than orienting properly along the flow vector [12,13]. At high shear stress, RBCs from control patients exhibited an elliptical diffraction pattern whereas RBCs from the person N. generated a diamond shaped diffraction pattern.
The analysis of the low-sheare stress osmoscans shows that in the blood of healthy patients predominantly the thorroidal red blood cells with peak in the zone (290-310) mOsm, while patient N. has red blood cells with a pronounced peak of fashion in zone (400-420) mOsm. According to confocal microscopy, this fraction is represented by swollen red blood cells with a sharply rough relief (holothurya-like) of the surface of the membranes.
So, ektacytometry provides a convenient and sensitive measure of the rheological properties of erythrocytes and the heterogeneity of blood populations. These data are important in the study of several disorders and are frequently of clinical relevance.
References
- Johnson RM. Ektacytometry of red blood cells. Methods Enzymol. 1989;173:35-54. doi: 10.1016/s0076-6879(89)73004-4. PMID: 2779431.
- Katyukhin LN. A method for evaluation of membrane permeability for water by the erythrocyte osmotic deformability profiles. Bull Exp Biol Med. 2014 May;157(1):116-8. doi: 10.1007/s10517-014-2505-1. Epub 2014 Jun 11. PMID: 24915951.
- Bor-Kucukatay M, Wenby RB, Meiselman HJ, Baskurt OK. Effects of nitric oxide on red blood cell deformability. Am J Physiol Heart Circ Physiol. 2003 May;284(5):H1577-84. doi: 10.1152/ajpheart.00665.2002. Epub 2003 Jan 9. PMID: 12521942.
- Belanger AM, Keggi C, Kanias T, Gladwin MT, Kim-Shapiro DB. Effects of nitric oxide and its congeners on sickle red blood cell deformability. Transfusion. 2015 Oct;55(10):2464-72. doi: 10.1111/trf.13134. Epub 2015 Apr 23. PMID: 25912054; PMCID: PMC4605849.
- Streekstra GJ, Dobbe JG, Hoekstra AG. Quantification of the fraction poorly deformable red blood cells using ektacytometry. Opt Express. 2010 Jun 21;18(13):14173-82. doi: 10.1364/OE.18.014173. PMID: 20588551.
- Rabai M, Detterich JA, Wenby RB, Hernandez TM, Toth K, Meiselman HJ, Wood JC. Deformability analysis of sickle blood using ektacytometry. Biorheology. 2014;51(2-3):159-70. doi: 10.3233/BIR-140660. PMID: 24898336; PMCID: PMC4469365.
- Renoux C, Parrow N, Faes C, Joly P, Hardeman M, Tisdale J, Levine M, Garnier N, Bertrand Y, Kebaili K, Cuzzubbo D, Cannas G, Martin C, Connes P. Importance of methodological standardization for the ektacytometric measures of red blood cell deformability in sickle cell anemia. Clin Hemorheol Microcirc. 2016;62(2):173-9. doi: 10.3233/CH-151979. PMID: 26444610; PMCID: PMC8957396.
- Klose HJ, Kelson S, Linderkamp O, Riegal K, Betke K. Microrheology of young and old red cells in childhood iron deficiency and hemolytic anemia. Biblthca Anat; 1981;20:p.178. R Yip, N Mohandas, M R Clark, S Jain, S B Shohet, P R Dallman. Red cell membrane stiffness in iron deficiency. Blood; 1983. 62(1):99-10.
- Yip R, Mohandas N, Clark MR, Jain S, Shohet SB, Dallman PR. Red cell membrane stiffness in iron deficiency. Blood. 1983 Jul;62(1):99-106. PMID: 6860798.
- Renoux C, Faivre M, Bessaa A, Da Costa L, Joly P, Gauthier A, Connes P. Impact of surface-area-to-volume ratio, internal viscosity and membrane viscoelasticity on red blood cell deformability measured in isotonic condition. Sci Rep. 2019 May 1;9(1):6771. doi: 10.1038/s41598-019-43200-y. PMID: 31043643; PMCID: PMC6494803.
- Davydov DA, Marchenko VN, Katiukhin LN. Gradient ektacitometry is an objective method for assessing the determinant of the deformation properties of red blood cells. Thrombosis, hemostasis and rheology. 2022;47-52. doi: 10.25555/THR.2022.2.1019.
- Renoux C, Parrow N, Faes C, Joly P, Hardeman M, Tisdale J, Levine M, Garnier N, Bertrand Y, Kebaili K, Cuzzubbo D, Cannas G, Martin C, Connes P. Importance of methodological standardization for the ektacytometric measures of red blood cell deformability in sickle cell anemia. Clin Hemorheol Microcirc. 2016;62(2):173-9. doi: 10.3233/CH-151979. PMID: 26444610; PMCID: PMC8957396.
- Parrow NL, Violet PC, Tu H, Nichols J, Pittman CA, Fitzhugh C, Fleming RE, Mohandas N, Tisdale JF, Levine M. Measuring Deformability and Red Cell Heterogeneity in Blood by Ektacytometry. J Vis Exp. 2018 Jan 12;(131):56910. doi: 10.3791/56910. PMID: 29364234; PMCID: PMC5908551.
Content Alerts
SignUp to our
Content alerts.
 This work is licensed under a Creative Commons Attribution 4.0 International License.


