Environmental Sciences Group. 2024 May 28;5(5):501-514. doi: 10.37871/jbres1920.
On the Sensitivity of the Potential Evapotranspiration of Egypt to Different Initial Conditions of the Soil Moisture Using a High-resolution Regional Climate Model
Samy A Anwar*
- Egypt
- ERA5
- Potential evapotranspiration
- RegCM4
- Soil moisture
Abstract
The present study investigated the sensitivity of the Potential Evapotranspiration (PET) of Egypt to different initial conditions of soil moisture using a high-resolution Regional Climate Model (RegCM4). To address this issue, two 32-year simulations were conducted from 1979 to 2010. The first two years were considered as spin-up. In the first simulation, the RegCM4 was initialized with the satellite product ESACCI (ESA) and the RegCM4 was initialized with version 3 of the Century Reanalysis Product (CEN) in the second simulation. The PET was computed using a calibrated version of the Hargreaves–Samani (HS) equation. In the two simulations, the RegCM4 was configured with the Community Land Model version 4.5 (CLM45). Era-Interim Reanalysis of 1.5 degrees (EIN15) was used to downscale the RegCM4 with 25 km grid spacing. The ERA5-based product (ERA5) was used as the observational dataset.
The results showed that switching between ESA and CEN didn’t induce a notable influence on the daily maximum air temperature. Regarding the daily minimum air temperature, the CEN outperforms the ESA concerning the Climate Research Unit (CRU). In comparison with the ERA5 product, the CEN was able to reduce the PET negative bias (0.8 to 1.8 mm day-1) better than the one noted in the ESA (0.8 to 3 mm day-1). On a point scale, the performance of the ESA/CEN varies with the location and month. Such a point was confirmed using different statistical metrics such as mean bias, Pearson correlation coefficient and standard deviation ratio. In conclusion, the CEN can be recommended to initialize the RegCM4 to ensure a reliable estimation of the PET of Egypt either in the present climate or under different future scenarios.
Introduction
The complexity of the climate system appears in the mutual interaction of various components such as the biosphere, hydrosphere and atmosphere. One of the key variables regulating such interactions is soil moisture [1]. Soil moisture is the amount of water stored in the unsaturated soil zone. Importance of the soil moisture appears in controlling plant transpiration and photosynthesis [2], and subsequent influences on the global water, energy and biogeochemical cycles. Additionally, the memory of the soil moisture in the climate system plays an important role in climate prediction. Such a role has been investigated using global/regional climate models [3].
For instance, the authors of [3] investigated the influence of soil moisture initialization on the boreal summer sub-seasonal prediction using the fifth version of the Global climate Forecast System (GFS). They reported that the forecast is accurate when the GFS is initialized with an observation-driven offline land surface model. Also, the authors of [4] reported that the forecast skill of the Weather Research and Forecasting (WRF) model is improved when the multiplication of the GFS soil moisture data is applied. Such improved performance was indicated by a high value of the Critical Success Index (CSI) and a low value of the Frequency Bias (FBIAS). Additionally, the authors of [5] reported that proper initialization of the soil moisture/temperature can improve the severity of thunderstorms in the monsoon regions.
In Egypt (an arid region in North Africa), the authors of [6] addressed the sensitivity of the daily Maximum (TMX) and Minimum air Temperature (TMN) to the initialized soil moisture (bare soil versus ESACCI satellite soil moisture product [7,8]) and land surface parameterization was investigated within the framework of the Regional Climate Model (RegCM4 - [9]). They observed that the TMX/TMN was sensitive to the initialized soil moisture in the sense that the RegCM4 had a higher TMX/TMN by 4/8°C when it was initialized with the ESACCI rather than the bare soil. Additionally, the community land model version 4.5 (CLM45 - [10]) outperforms the Biosphere-Atmosphere Transfer System (BATS - [11]) concerning the Climate Research Unit (CRU - [12]) and station observation. Furthermore, the forecast skills of the soil temperature of Egypt (depth 40 cm) were also improved with proper initialization of the soil moisture/temperature as reported by [13].
As discussed, the role of the initialized soil moisture (either from a reanalysis/satellite product) has been documented for the surface climate (in particular daily TMX/TMN) or soil temperature in different regions across the globe. As an initial condition, the influence of different products of the soil moisture can be applied for practical applications such as calculating the Potential Evapotranspiration (PET) in arid regions (where the effect of the initialized soil moisture can be obvious as reported by [6]). PET is defined as the maximum rate of evaporation given a healthy grass of height 0.12 m, a fixed surface resistance (of 70 s m-1) and an albedo of 0.23. The Food and Agriculture Organization (FAO) recommends the Penman-Monteith (PM; [14]) to estimate the PET because the PM relies on the physical exchange of the water and energy fluxes between the surface and atmosphere. In arid regions, the authors of [15,16] do not recommend the PM to estimate the PET because the PM is not the suitable method to estimate the PET under conditions of moisture surplus or very dry soil. Instead, there was an urgent need to estimate the PET using a simple empirical method (to give the same order of magnitude of the PM values).
Various methods were suggested to compute the PET under different climate regimes such as temperature-based formula (e.g. Hargreaves-Samani; HS [17,18]), radiation-based method (e.g. Priestley-Taylor method; [19]) and mass-transfer based method ([20]). Among the available methods, the HS (and its calibrated version) has shown its performance in computing the PET in different regions across the globe [21-23]. Also, the authors of [24] used different regional climate models (and their ensemble average) to estimate the PET of Spain using a calibrated version of the HS. It is important to highlight that the PET was optimized by calibrating the coefficients of the HS using station observation, reanalysis products or regional climate models. Based on the available meteorological inputs, the PET (using the HS equation) can be computed in two ways: 1) temperature-only method ([17,18]) and 2) radiation-temperature formula [25].
To the present day, the PET has not been optimized using different products of soil moisture (as an initial condition of the regional climate model) in arid regions. In the present study, the influence of two products of the initialized soil moisture (ESACCI and version 3 of the century reanalysis product [26]) on the Potential Evapotranspiration of Egypt (PET) was investigated within the framework of RegCM4. To achieve this purpose, these points were addressed: 1) sensitivity of the TMX/TMN and PET to the initialized soil moisture products concerning the CRU/ERA5-land-based product [27] on a grid-cell scale, 2) evaluation of the PET climatological annual cycle for ten locations following [28]. For the present study, a temperature-only-based formula was employed. This work was organized as follows: Section 2 describes the experiment design; Section 3 shows the results of the study. Section 4 provides the discussion and conclusion.
Materials and Methods
Model description
The present study used the International Center of Theoretical Physics (ICTP) Regional Climate Model (RegCM). The RegCM is a widely used model and can be used for various applications such as regional process studies, pale climate simulations, future climate projections, chemistry-climate interactions aerosol effects and, biosphere-atmosphere interactions [29]. Also, it passed through various developmental stages from RegCM1 [30], RegCM2 [31,32], RegCM3 [33] and RegCM4 [34]. Currently, a new version has been released [35] and it includes a new dynamical non-hydrostatic core. The RegCM4 has two dynamical cores: hydrostatic [31] and non-hydrostatic [35,36]. For this study, the RegCM4 with a hydrostatic core was employed following [6]. Additionally, the RegCM4 comprises various physical schemes of each component such as 1) radiation (Modified Community Climate Model version 3 - CCM3; [37] and Rapid Radiation Transfer System - RRTM; [38]), 2) land surface (e.g., BATS; [10] and CLM45; [11]), planetary boundary layer (HOLTSLAG - HOLT; [39] and University of Washington - UW; [40]) and cumulus convection (e.g. Emanuel; [41]). The reader can find additional details about the RegCM4 model in [9].
Based on the recommendation of [2], the radiation and boundary layer schemes of [38,40] were utilized in the present work. Concerning the PET, the RegCM4 has shown its potential skills using the HS equation and its calibrated version in various regions across the globe such as Egypt ([42]), Bulgaria ([43]) and Tropical Africa ([44]). Another important feature (in the RegCM4) is incorporating the global satellite soil moisture product (ESACCI) as an initial condition. This feature has been implemented for seasonal forecasts in monsoon regions across the globe because of the long-term memory of the soil moisture in these regions [3]. In Egypt, the RegCM4 has proven its sensitivity to the ESACCI (compared to initialization from bare soil) concerning the solar radiation budget, heat transfer, and daily maximum and minimum air temperature as reported by [6]. For the present study, the Century reanalysis product has been implemented in the RegCM4 code in a way similar to the ESACCI.
Experiment design
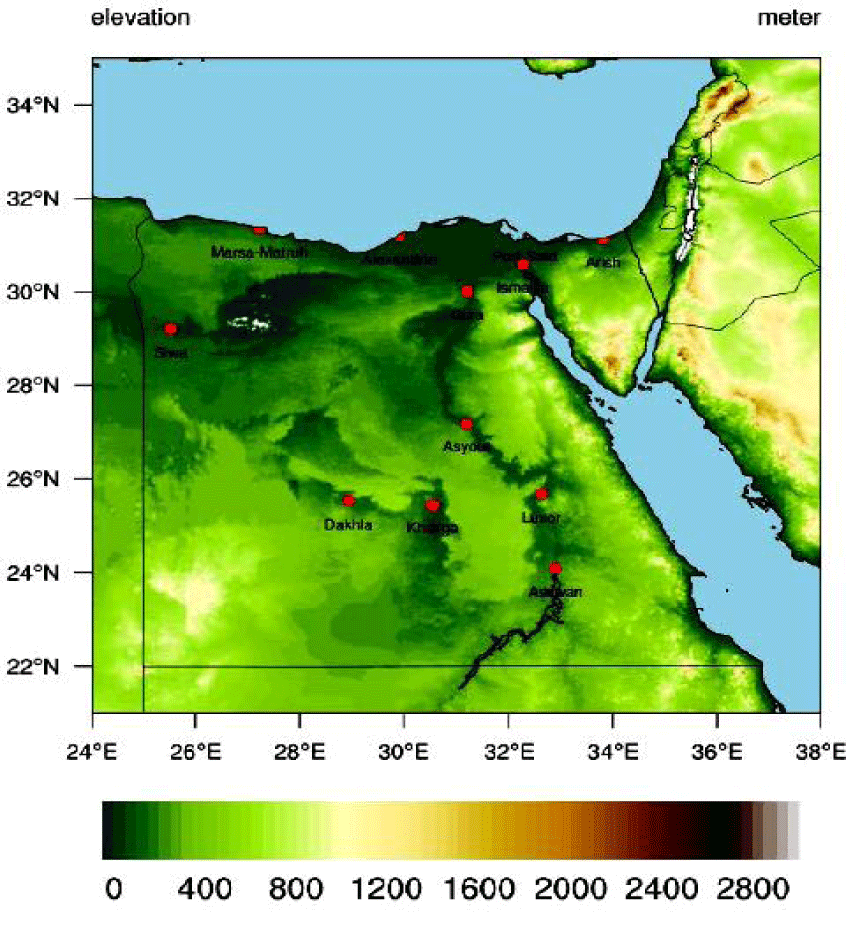
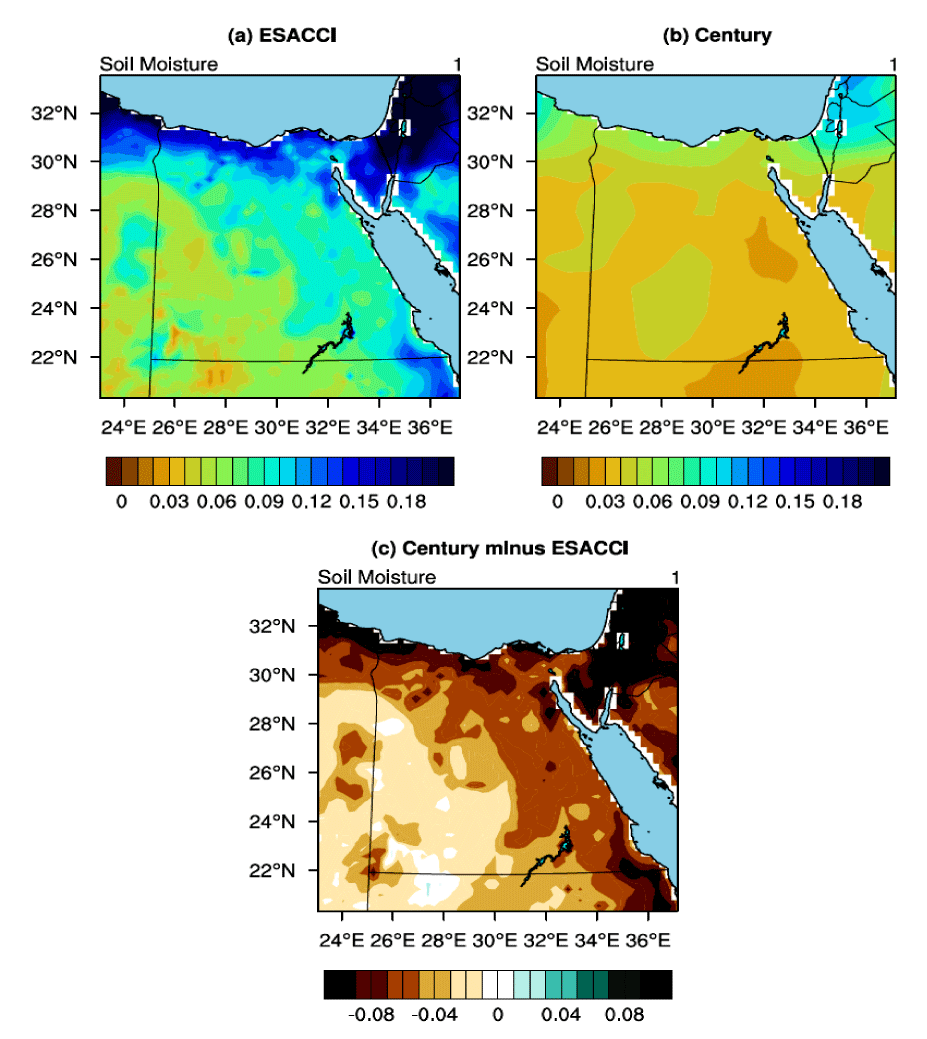
In this work, the RegCM4 was configured to comprise the Egypt domain. Caution was taken to ensure that the selected domain was far from the boundary to avoid unnecessary noise propagating from the surrounding regions (such as mountains). That is, there was a separating area between the selected domain and the lateral boundary condition (provided by the low horizontal resolution of the general circulation model). The ERA-Interim reanalysis of 1.5 degrees (EIN15; [45]) was used to downscale the RegCM4 with 25 km grid spacing, and 60 grid points in the zonal and meridional directions. To ensure a proper selection of the Egypt domain, the RegCM4 was centered at 30º latitude and 27º longitude following [6]. Figure 1 shows the domain topography including the coordinates of ten locations (to evaluate the RegCM4 on a point scale). To compare the ESACCI (ESA) and Century (CEN), two 32-year simulations were conducted from 1979 to 2010. The interpolated ESA and CEN (as well as the difference between the CEN and ESA) on the curvilinear grid of the RegCM4 are shown in figure 2. The community land model version 4.5 (CLM45; [10]) was used based on the recommendation of [6].
It is important to highlight that the ESA was considered as the reference simulation following [6], while the CEN was considered as the experimental simulation. The first two years were considered for equilibration of the soil moisture [46]. To observe the difference between the ESA and CEN, the temperature-only version of the HS equation was considered in this study. The temperature version of the HS can be written as:
where Ra is the extraterrestrial solar radiation (expressed in mm day-1 to match the PET unit; [14]). Tmax, Tmin and TmaxTmean are the daily 2 m maximum, minimum and mean air temperature respectively (ºC). PETHS is the potential evapotranspiration (in mm day-1). To ensure a low PET bias (compared to the ERA5-land-based product; [47]), the HS equation has been calibrated. The new formula is written as:
The PET (before the calibration) is referred to as HS and after the calibration is HSnew. Figure S1 shows the PET (before and after calibrating the HS equation) concerning the ERA5-land-based product (ERA5). From figure S1, it can be noticed that calibrating the HS coefficient (17.8) to (20.8) succeeded in reducing the PET negative bias, particularly in the summer season followed by the autumn, spring and finally the winter. In equation 2, it can be seen the dependence of PET on the difference between Tmax and Tmin. To evaluate the PET climatological annual cycle for the ten locations (Figure 1), three statistical metrics were used: 1) Mean Bias (MB), Pearson Correlation Coefficient (CORR) and Standard Deviation Ratio (STD; between Standard Deviation - SD of the RegCM4 to the one of the utilized observational dataset).
where N represents the total number of records for both the RegCM4 and observational dataset, and Si and Ri represent the RegCM4 and Observational Dataset (OBS) for each month i, respectively.
Observational data
To evaluate the RegCM4 model performance, various datasets were used.
Climate Research Unit (CRU [12]): in the present study version 4.07 was used. CRU spans the period 1901 to 2022 and it is available in 0.5º horizontal grid spacing. Also, CRU is based on the up-scaling of station observations across the globe. Additionally, it includes various variables such as maximum, minimum and mean air temperature, diurnal temperature range, vapor pressure deficit, potential evapotranspiration, total precipitation and number of frost days on a monthly time scale. In this study, CRU was used to evaluate the simulated Maximum (TMX) and Minimum air Temperature (TMN) on a seasonal climatology basis.
ERA5-land-based product (hPET [47]): this product was used to evaluate the Potential Evapotranspiration (PET). Also, hPET (ERA5 for short) calculates the PET based on the Penman-Monteith equation and it retrieves the meteorological inputs from the offline land model of the ERA5 (ERA5-land; [48]). ERA5 is available in 0.1º grid spacing in the period of 1981 to 2022 over a hierarchy of time scales (hourly, daily sum and monthly mean/sum). It is important to highlight that ERA5 was used as the observational dataset over other available products such as CRU, MODIS16 (based on the Moderate Resolution Imaging Spectroradiometer MODIS; [49]) and Global Land Evaporation Amsterdam Model (GLEAM; [50]) because MOD16 and GLEAM compute the PET over vegetated land units only. On the other hand, CRU is available only on a monthly time scale. Additionally, CRU has some limitations in computing the PET such as: 1) wind speed is calculated based on the climatology period of 1961-1990; and 2) some derived variables (such as surface net radiation) are calculated using a simple empirical formula based on the total cloud cover.
It is important to mention that there were no long-term records available to evaluate the ERA5 in Egypt. Also, it was difficult to evaluate the ERA5 at the time of experiments. Therefore, ERA5 was used to evaluate the RegCM4 both spatially and for the ten locations following [42,51]. For the RegCM4’s output to be compared with the CRU/ERA5, the CRU/ERA5 product was bilinearly interpolated on the RegCM4 curvilinear grid following [42-44]. The significant bias (between the RegCM4 and CRU) and difference (between CEN and ESA) was calculated for every grid point using a student t-test with alpha equals to 5%. The climatological annual cycle (for each location) was extracted (from the RegCM4 output) using netCDF Operator (NCO; https://nco.sourceforge.net/) and bilinear interpolation method [52-54].
Results
Qualitative analysis
Before conducting the qualitative analysis between the ESA and CEN, it was important first to compare the soil moisture of the two products and calculate the difference between them. Figure 2a, it can be observed that the ESA possesses high values of soil moisture (0.09 to 0.18 mm3 mm-3) along the Mediterranean (29-32ºN) and Red Sea coasts (22-30ºN and 32-36ºE), and low values of the soil moisture (0.02 to 0.06 mm3 mm-3) elsewhere. Concerning the CEN, it can be noticed that soil moisture values range between 0.02 to 0.06 mm3 mm-3 overall Egypt domain (Figure 2b). In figure 2c, it can be seen that the CEN is lower than the ESA by 0.05 to 0.1 mm3 mm-3 overall Egypt domain except for the area (22-30ºN and 26-30ºE), where the difference between the two soil moisture products ranges between 0.01 and 0.05 mm3 mm-3. The authors of [6] showed that a significant decrease in the total surface albedo was noticed due to switching between bare soil and ESA. However, in this study, no significant difference was noted in the total surface albedo despite the noted difference in the soil moisture between the two products.
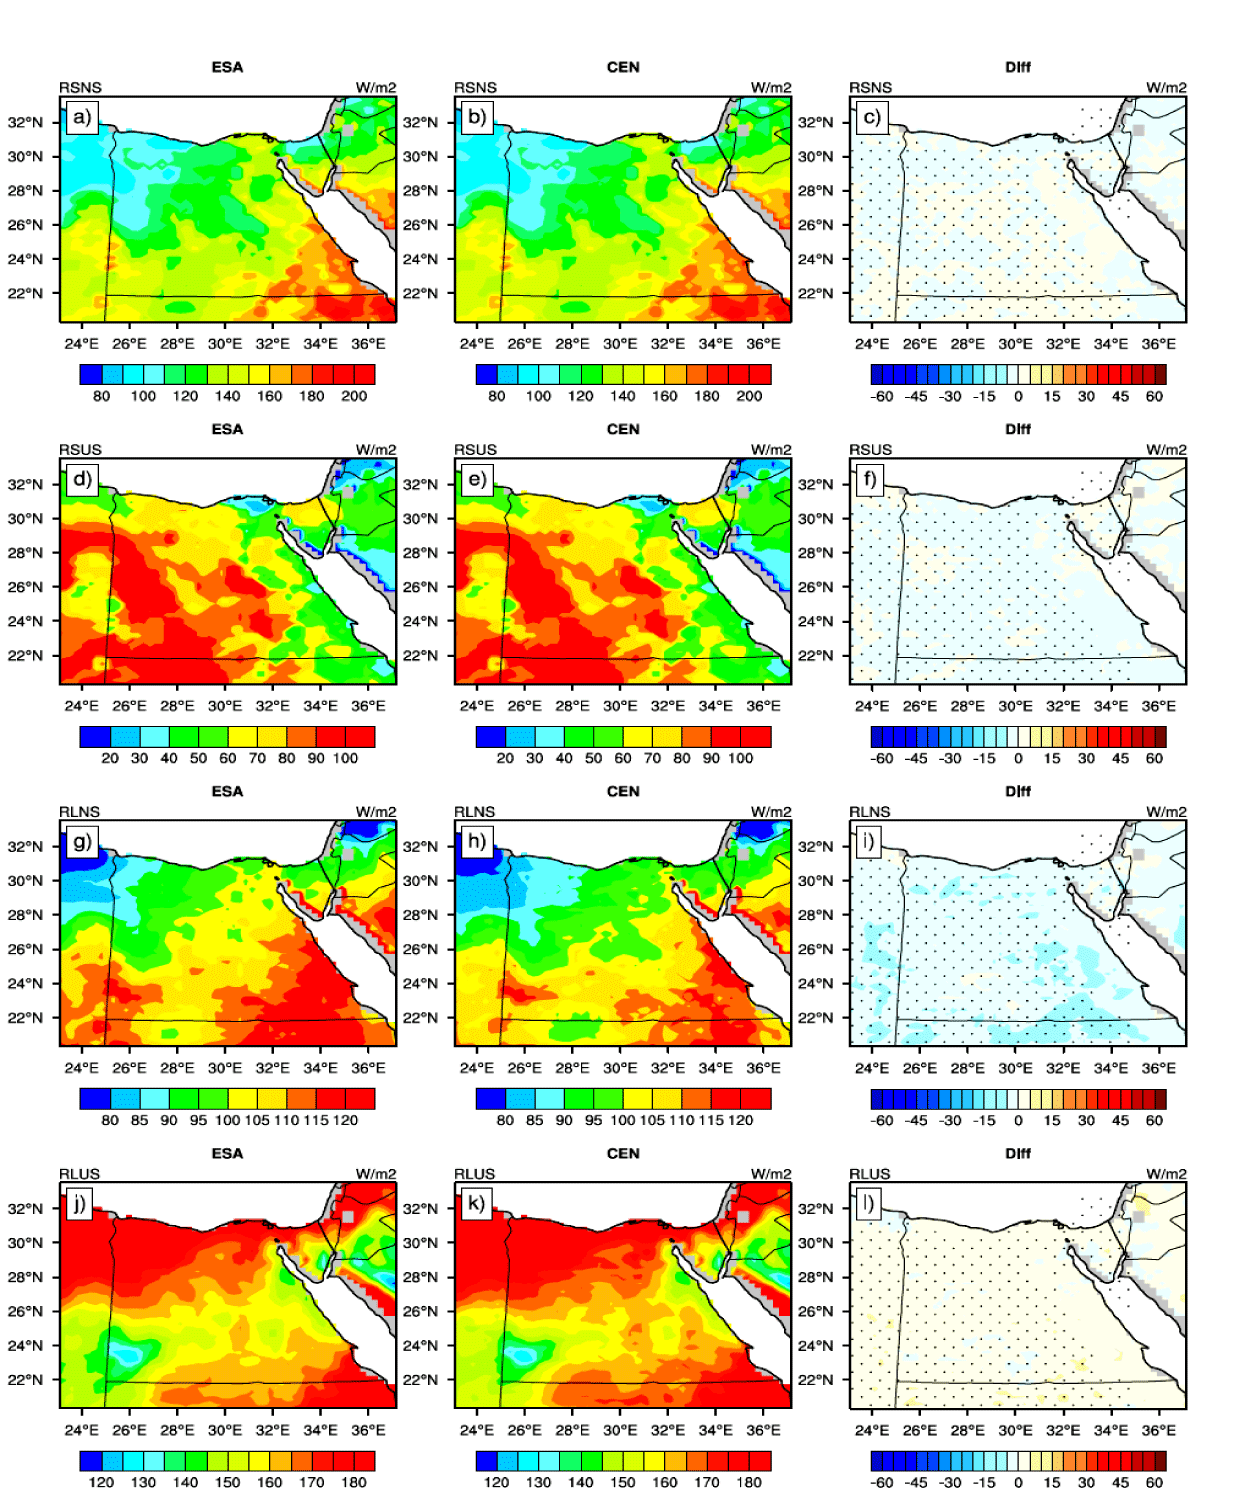
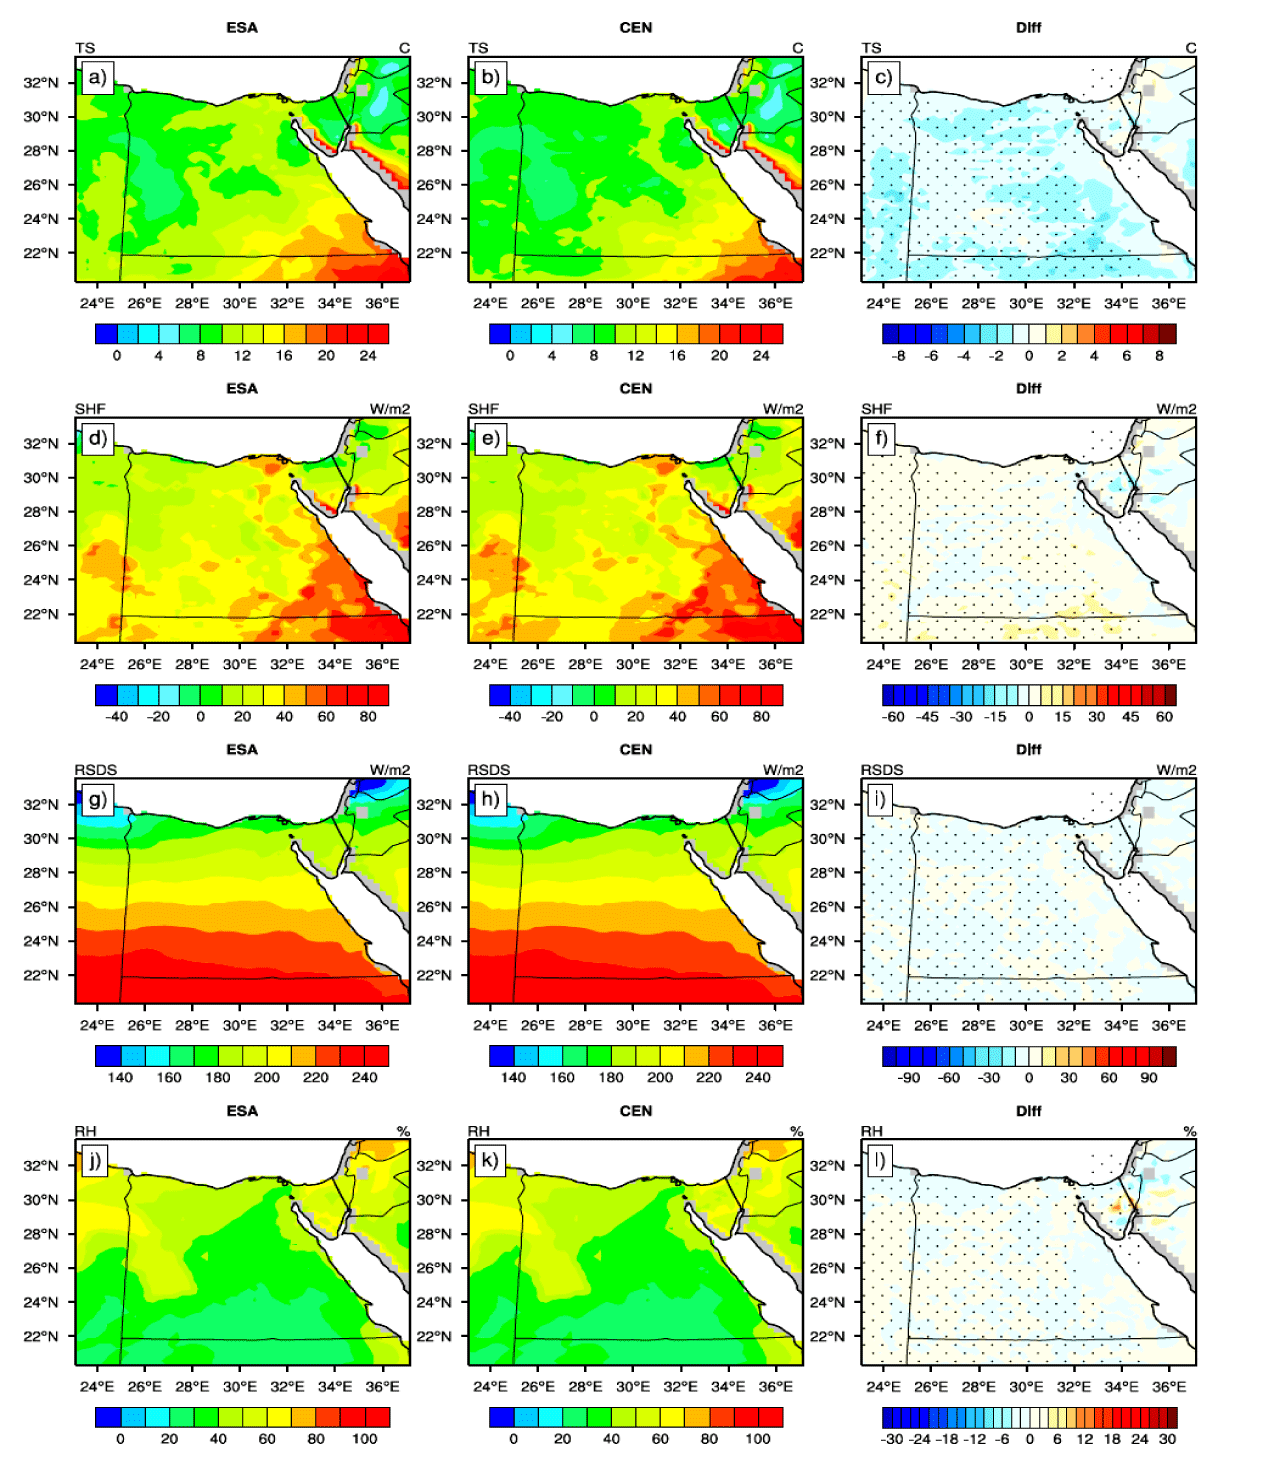
Such behavior can explain why the solar radiation budget (reflected and incoming net surface solar radiation) was not perturbed (i.e., there was no significant difference between the ESA and CEN). However, a significant difference between the ESA and CEN was noticed concerning the longwave radiation budget (Figure 3). From figure 3, it can be observed that both reflected and incoming surface net shortwave radiation exhibit a similar spatial pattern and the significant difference (using a t-test with alpha equal to 5%) was only about 5 W m-2 (Figure 3c,f). On the other hand, it can be seen that the CEN has a lower (higher) surface net (emitted) longwave radiation by 15-25 (10-15) W m-2 than the one noted in the ESA (Figure 3i,l). The long wave radiation budget was perturbed because switching from the ESA to CEN caused a decrease in the ground temperature (by 1 to 4ºC and 5ºC; Figure 4c). Additionally, no significant difference was noted concerning the global incident Solar Radiation (RSDS), Sensible Heat Flux (SHF) and near-surface Relative Humidity (RH) (Figure 4f,i,l). Such a finding can explain why the daily Maximum Air Temperature (TMX) was not affected by the initial condition of the soil moisture. Regarding the TMN, a notable difference was observed as discussed in section 3.2.
The influence of soil moisture initialization on the TMX/TMN
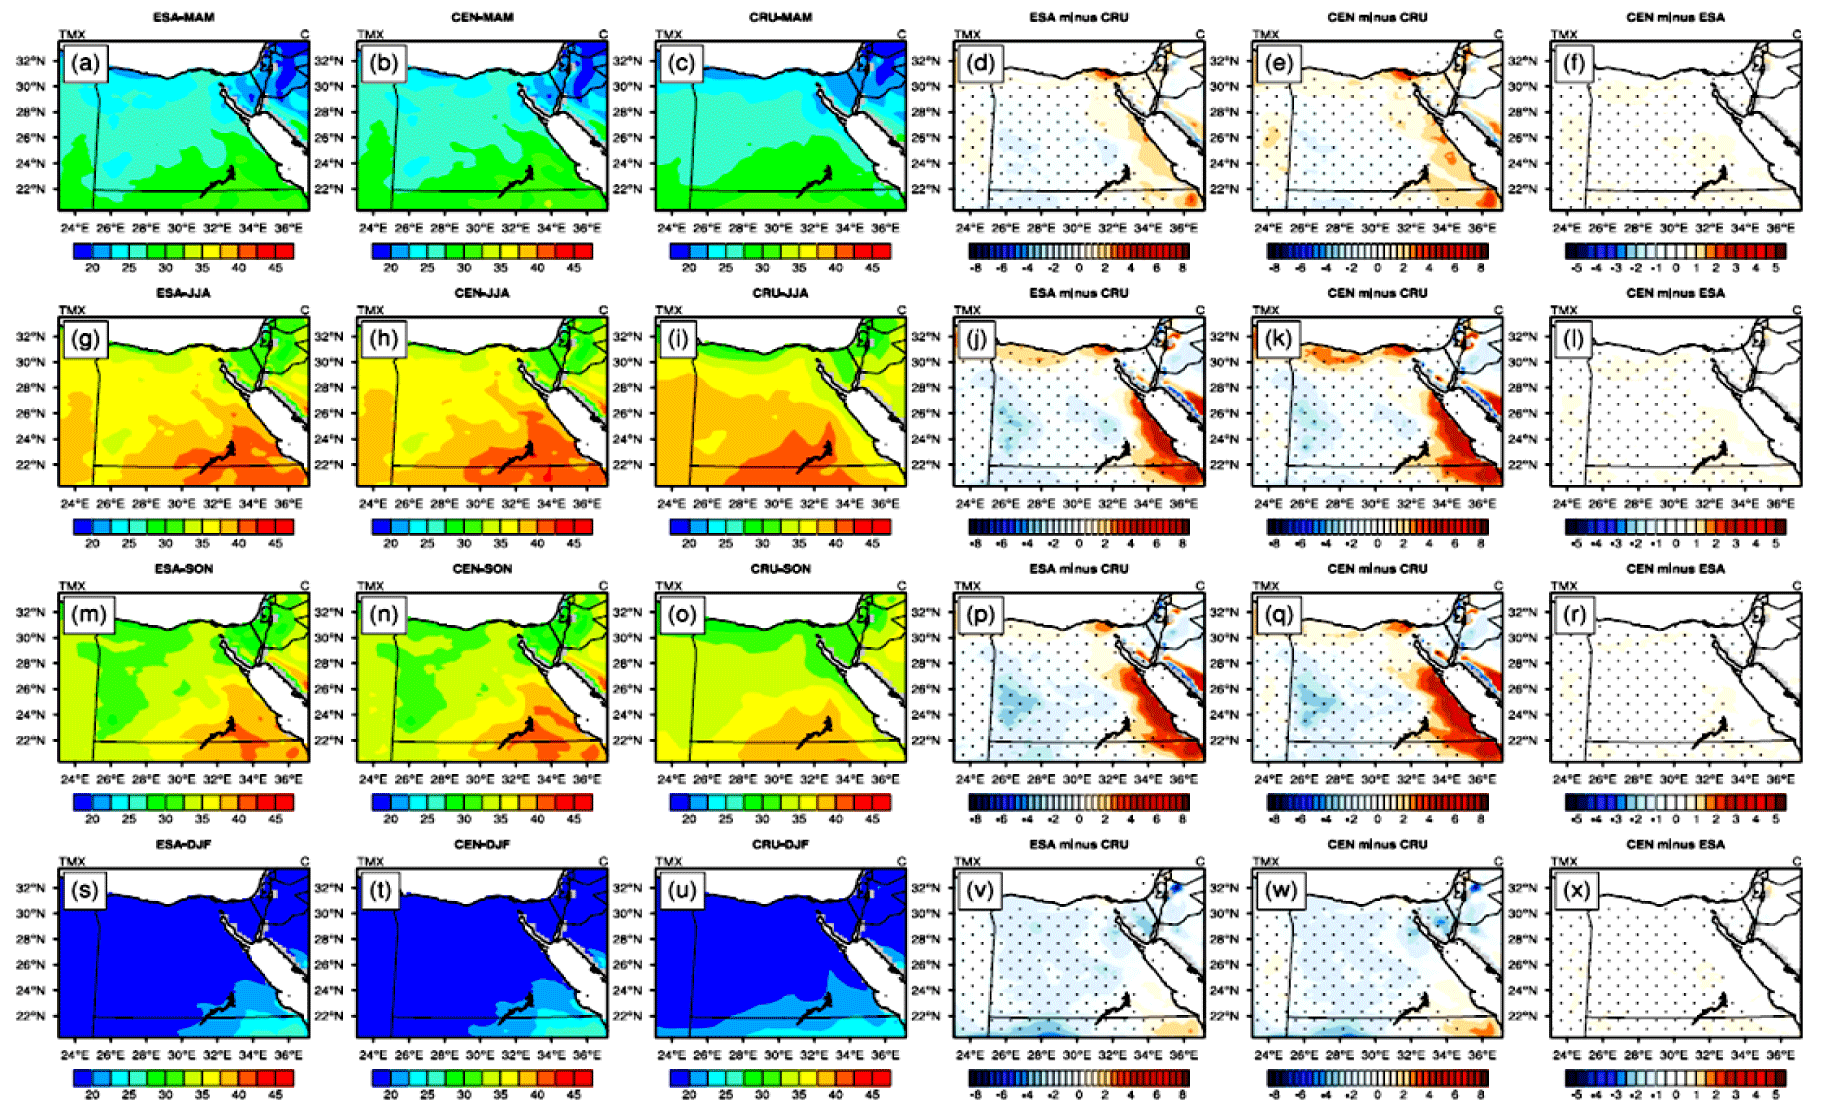
Figure 5 shows the simulated TMX (by ESA/CEN) concerning the CRU for the seasons: spring (March-April-May; MAM), summer (June-July-August; JJA), autumn (September-October-November; SON) and winter (December-January-February; DJF). From figure 5, it can be noticed that the ESA/CEN was able to reproduce the spatial pattern of the TMX concerning the CRU in all seasons (Figure 5a-c,g-i,m-o,s-u). Furthermore, a warm bias (1-5ºC) was observed along the Red Sea coast and 1-3ºC elsewhere in the seasons MAM, JJA and SON (Figure 5d-e,j-k,p-q,v-w). In the DJF season, the situation was different because a cold bias of 1-3ºC was noticed overall in Egypt. From a qualitative point of view, the significant difference between CEN and ESA was only about + 0.5ºC in some regions. Additionally, it can be observed that no configuration was better than the other one in comparison with the CRU in all seasons. Such behavior can be attributed to the fact that the solar radiation budget was not perturbed by non-observable changes in the sensible heat flux (despite the noted changes in the ground temperature; see section 3.1). Regarding the TMN, the situation was different from the one observed in the TMX concerning the spatial pattern and magnitude of bias.
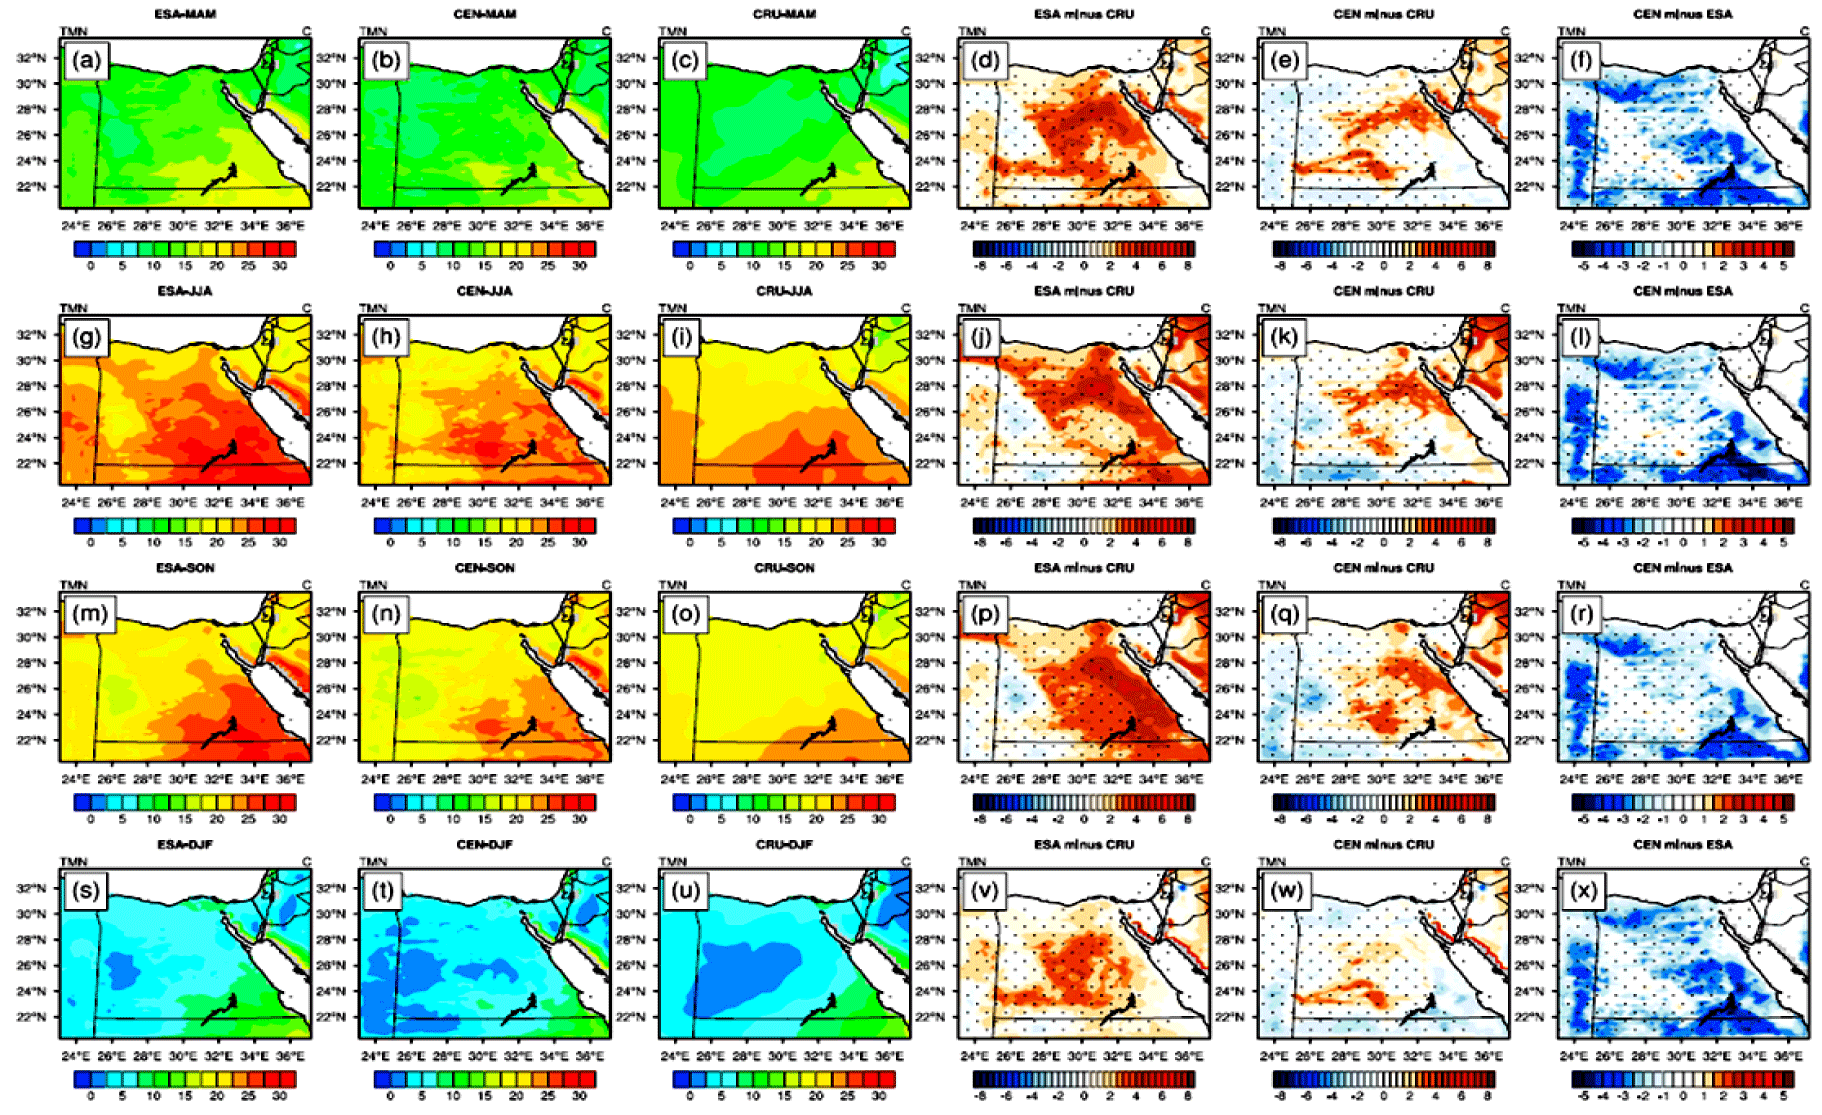
Figure 6 shows the simulated TMN (by ESA/CEN) concerning the CRU in the MAM, JJA, SON and DJF. From figure 6, it can be noticed that the CEN was able to reproduce the spatial pattern of the TMN (better than the ESA) in all seasons compared to the CRU (Figure 6a-c,g-i,m-o,s-u). Additionally, the CEN was able to reduce the warm bias (noted in the ESA) particularly, in the MAM, JJA and SON. For instance, the ESA shows a warm bias of 1-6ºC overall in Egypt in the MAM, JJA and SON (Figure 6d,j.p). For the DJF, the warm bias approached 4ºC (Figure 6v). Regarding the CEN, a warm bias of 1-3ºC was noticed over the majority of Egypt in all seasons with a cold bias of 0.5-2ºC elsewhere (Figure 6e,k,q,w). Qualitatively, the CEN has a lower TMN than the ESA by 1-3ºC (Figure 6f,l,r,x). This noted behavior can be attributed to the fact that switching between ESA and CEN imposed on considerable effect on the ground temperature, long wave radiation budget and eventually the TMN. It is important to highlight that, the difference was less than the one noted in [6] because of the transition from bare soil to the ESA. However, in this work, the RegCM4 was initialized with a soil moisture product in the two simulations despite the difference between them concerning the order of magnitude.
The influence of soil moisture initialization on the PET
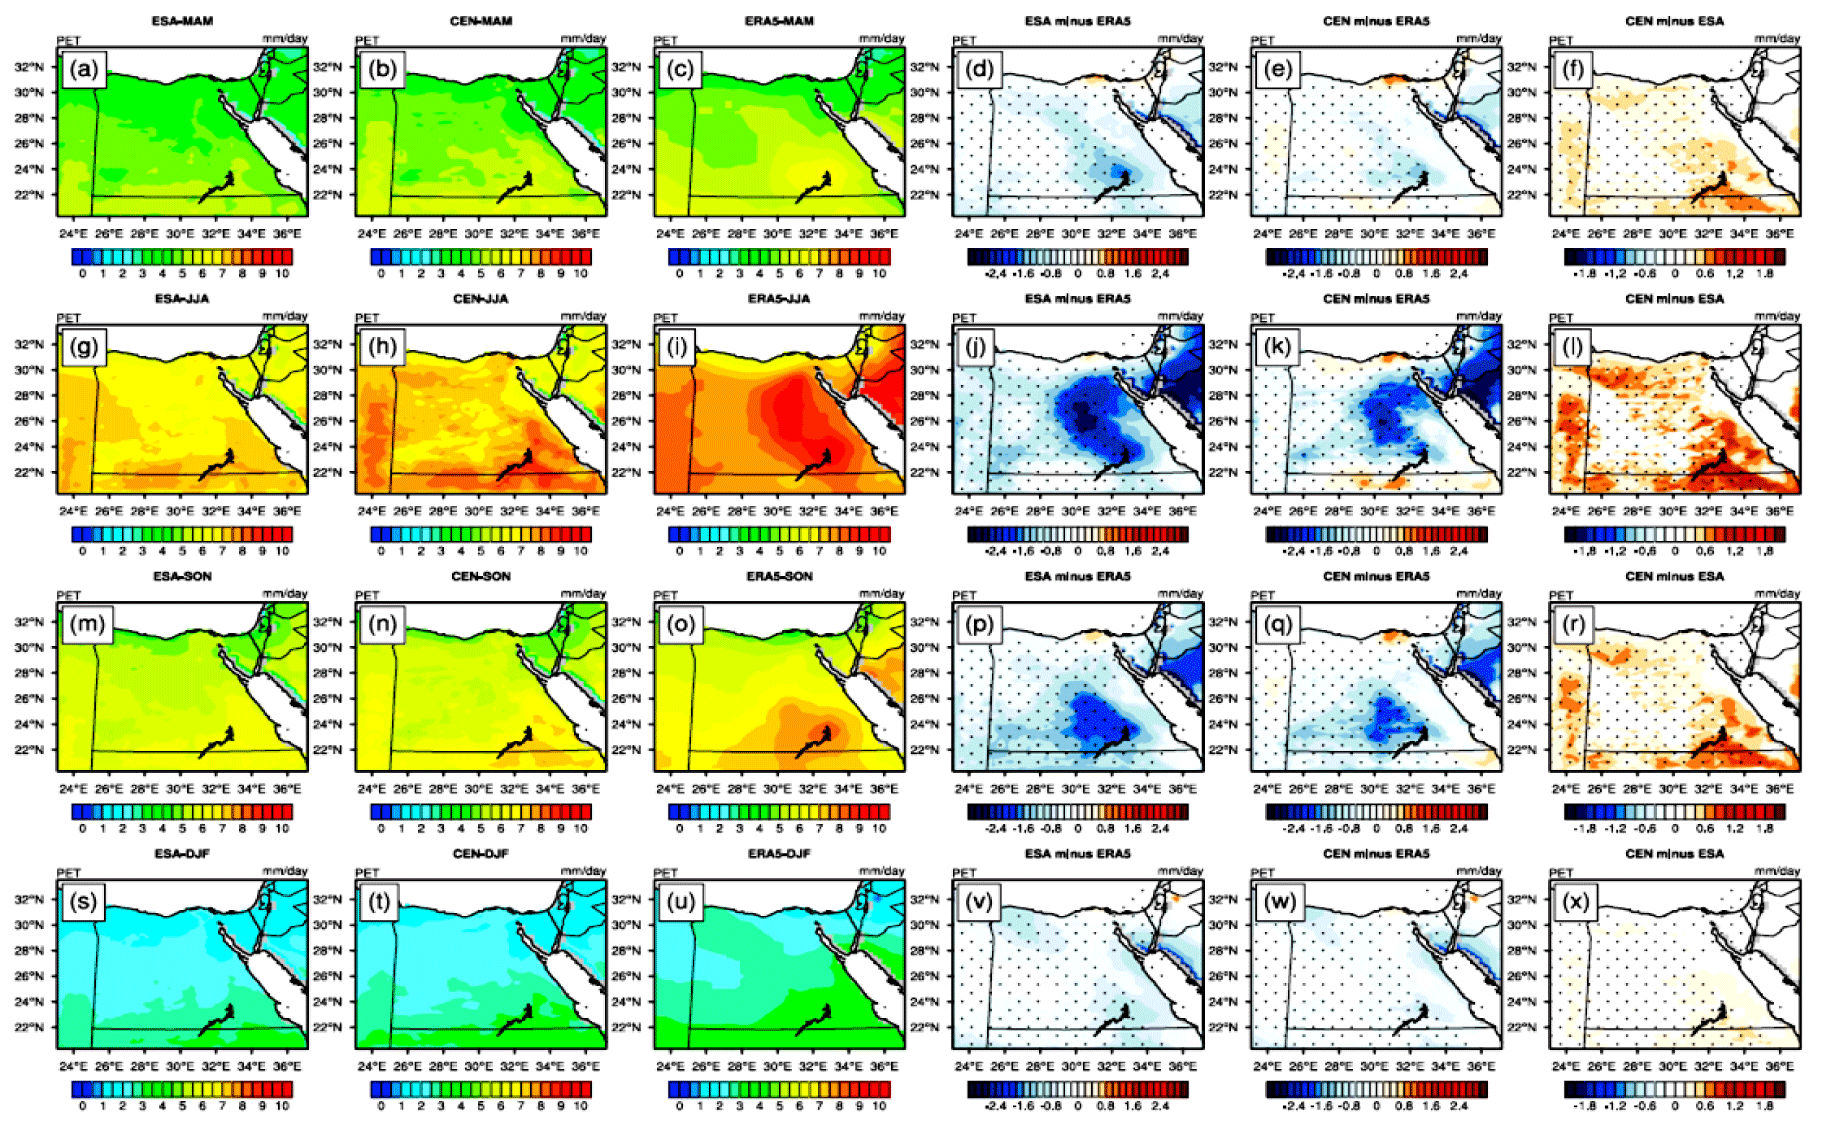
In this section, the influence of the initialized soil moisture on the PET (as a function of the TMX/TMN) was investigated. Figure 7 shows the simulated PET (by the ESA/CEN) concerning the ERA5 in the MAM, JJA, SON and DJF. From figure 7, it can be observed that both ESA/CEN were able to reproduce the PET spatial pattern concerning the ERA5 in all seasons (Figure 7a-c,g-i,m-o,s-u). However, the CEN showed potential skills in reducing the PET bias better than the ESA. For instance, the ESA showed a negative PET bias of 0.4 to 1.8 mm day-1, while the CEN showed a negative PET bias of 0.4 -1.2 mm day-1 in the MAM season (Figure 7d,e). Also, the CEN has a higher PET than the ESA by 0.4-1.2 mm day-1 (Figure 7f). In the JJA season, the negative PET bias range was 0.4-3 mm day-1 (by the ESA) (Figure 7j). On the other hand, the CEN expressed a negative PET bias of 0.6-2 mm day-1 with a positive PET bias of 0.6-1 mm day-1 along the Mediterranean coast (Figure 7k). Additionally, the CEN was higher than the ESA (by 0.4-1.2 mm day-1) particularly, over Lake Nasser (22-24ºN and 31-32ºE; Figure 7l).
Regarding the SON season, it can be seen that the ESA exhibited a negative PET bias of 0.6-2.4 mm day-1 particularly; in the region of 22-26ºN and 30-34ºE (Figure 7p). On the other hand, the CEN expressed a negative PET bias of 0.6-1.8 mm day-1 (Figure 7q). That is, the CEN has a higher PET than the ESA by 0.4-0.8 mm day-1 (Figure 7r). In the DJF season, the situation is different from the other seasons because both ESA/CEN showed a PET bias of -0.4 to -1.2 mm day-1 (Figure 7v,w). However, the extension of the PET bias (in the ESA) was larger than the one observed in the CEN. That is, the CEN is higher than the ESA (by 0.2-0.4 mm day-1) particularly, in the region of 22-26ºN and 30-34ºE (Figure 7x). This noted behavior of the simulated PET can be attributed to the fact that: 1) there is no difference between the ESA and CEN concerning the TMX and 2) the CEN is colder than the ESA regarding the TMN. Therefore, the CEN showed a bigger difference (between TMX and TMN) than the one observed in the ESA. Eventually, the CEN exhibited a lower negative PET bias than the ESA in comparison with the ERA5 in all seasons particularly, in the JJA.
PET climatological annual cycle
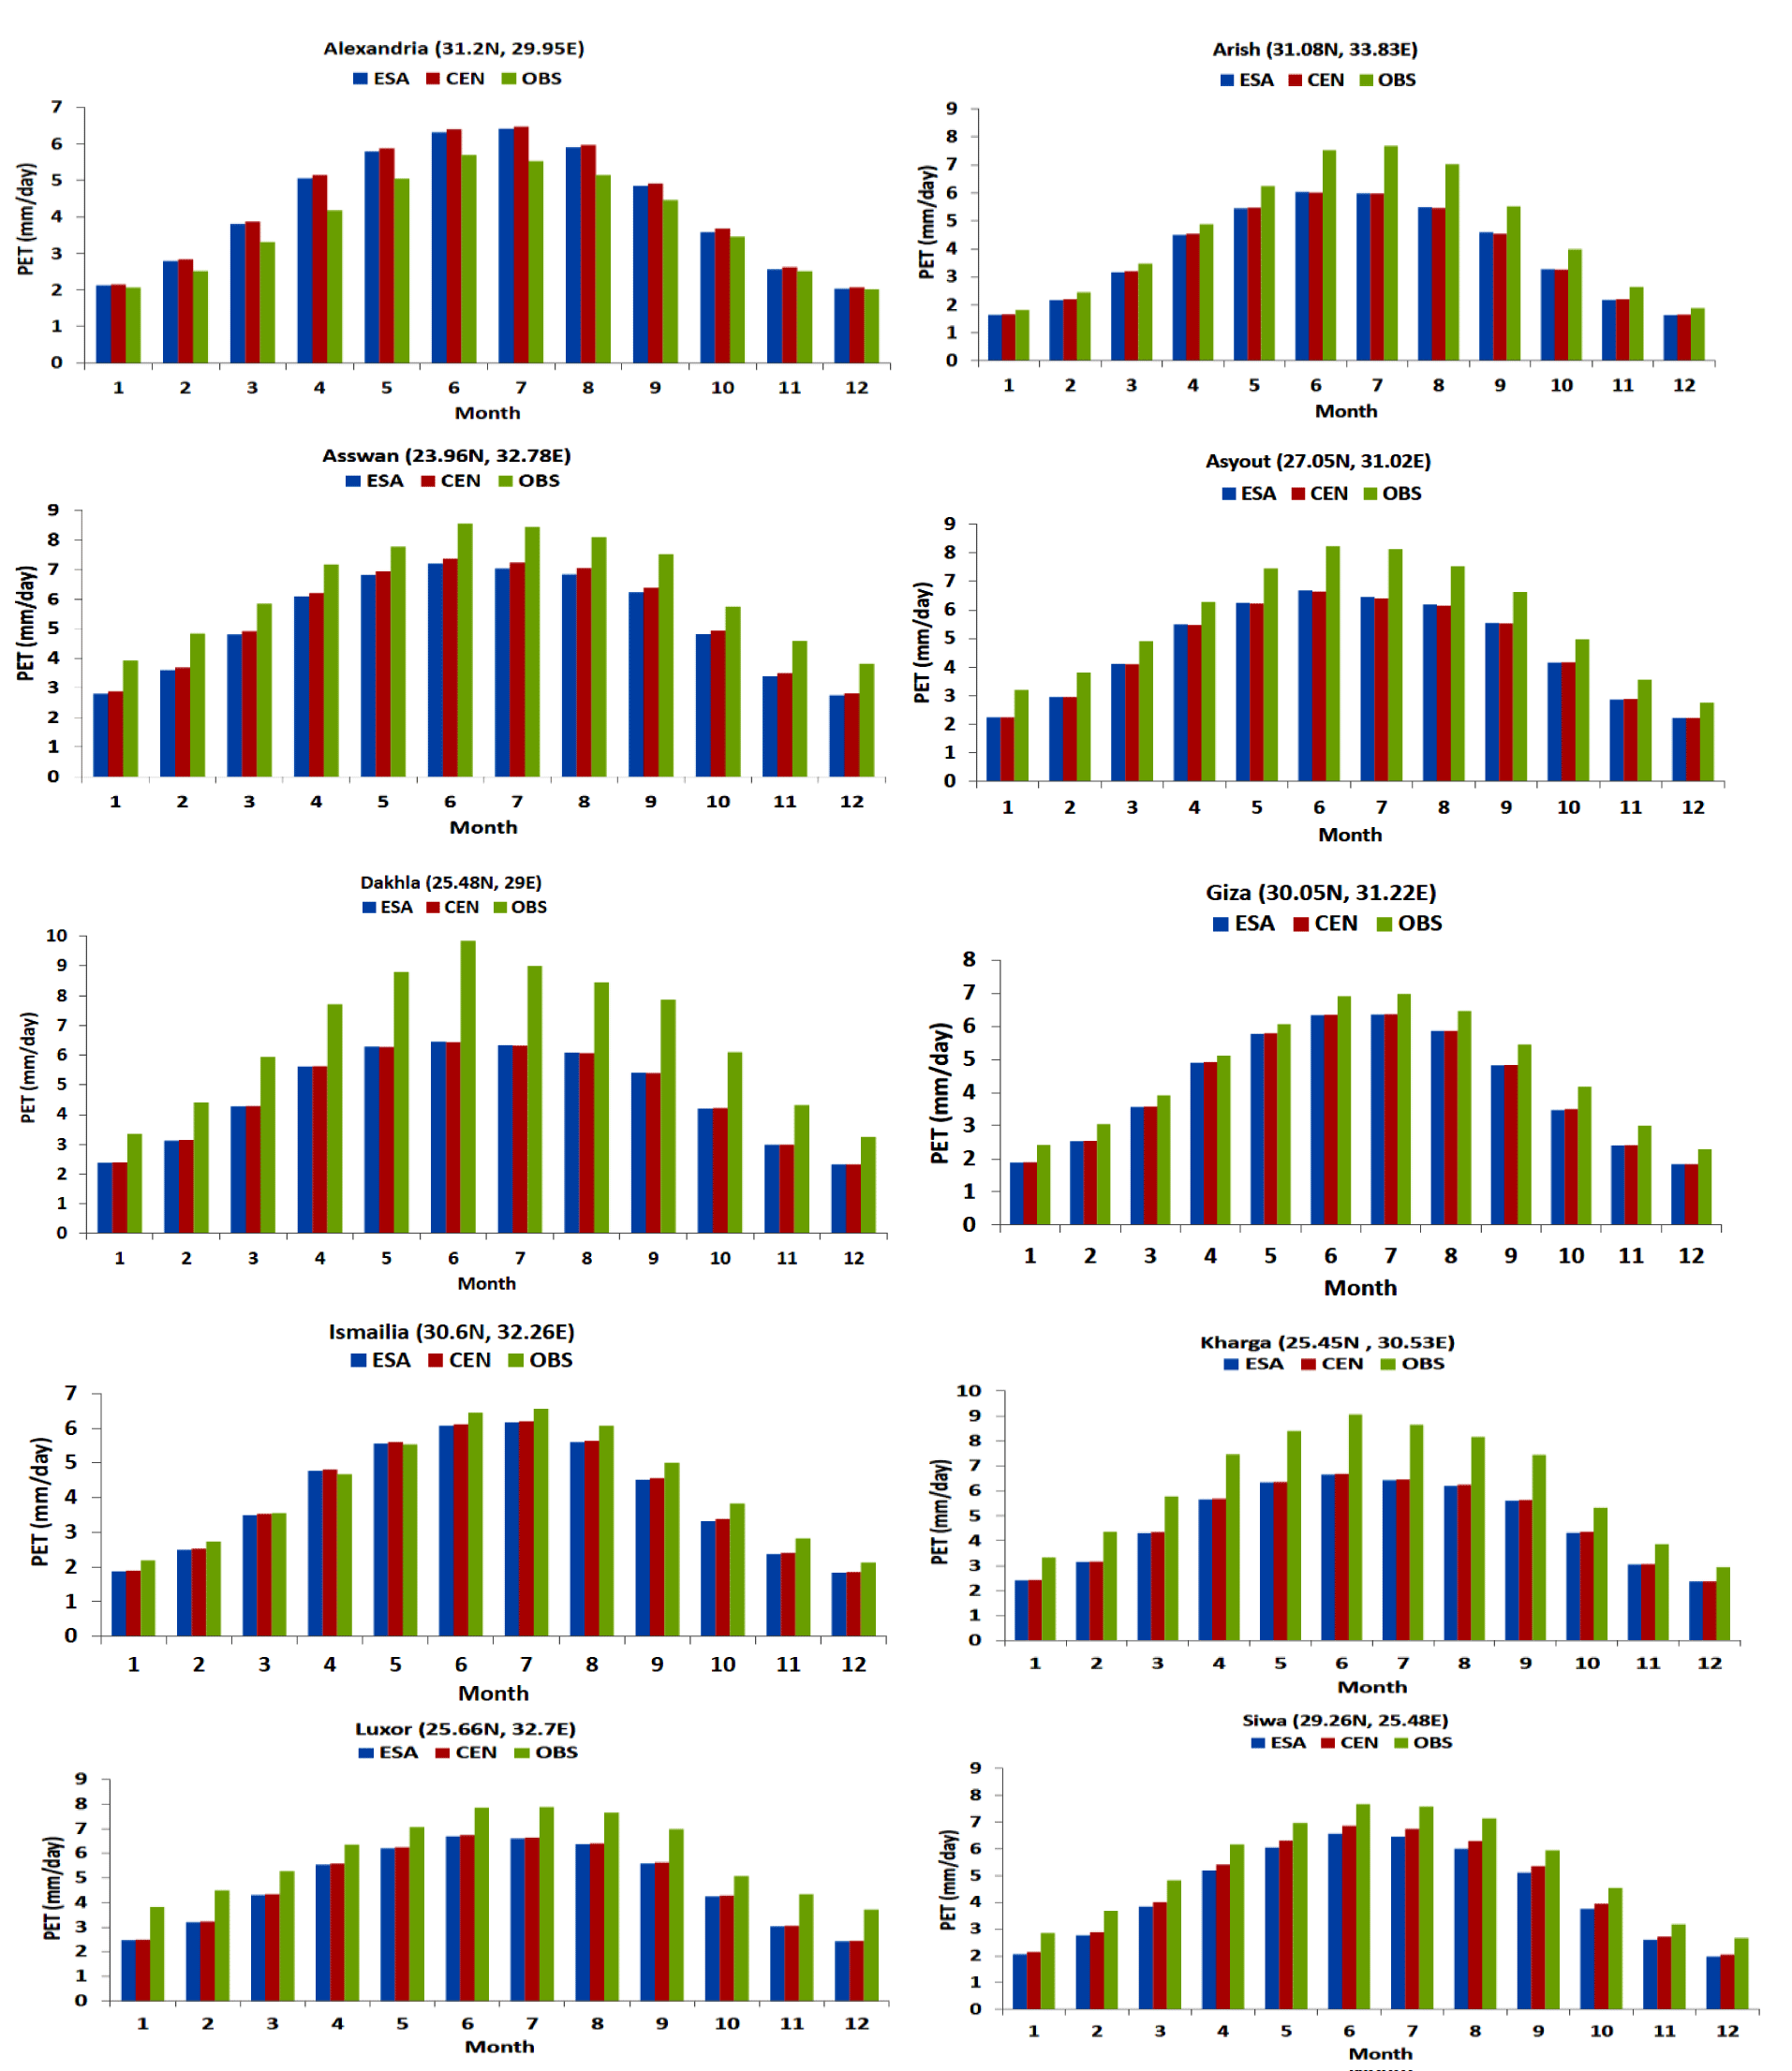
To further investigate the influence of ESA/CEN on the simulated PET, the climatological annual cycle was plotted for ten locations (Figure 1). From figure 8, it can be observed that the RegCM4’s performance varies with location and month. For example in Alexandria, both ESA and CEN overestimated the PET from January to October, while ESA/CEN was close to the ERA5 (OBS). Quantitatively, the CEN has a higher MB than the ESA (the MBCEN equals + 0.505 mm day-1 and MBESA equals + 0.441 mm day-1); also there was no clear difference (between the ESA and CEN) concerning the CORR and STD. In Arish, the ESA and CEN underestimated the PET particularly from April to December. However, there was a difference between ESA and CEN regarding the MB, CORR and STD. Additionally, the CEN outperforms the ESA in Asswan. This was quantitatively confirmed as the MBCEN equals + 1.03 mm day-1 and the MBESA equals + 1.16 mm day-1; while the STDCEN equals 0.989 and the STDESA equals 0.966. Finally, there was no difference between the ESA and CEN concerning the CORR. Regarding Assyut; the CEN has a higher PET than the ESA (the MBCEN equals + 1.039 mm day-1 and the MBESA equals + 1.025 mm day-1; STDCEN equals 0.854 and STDESA equals 0.844). But there was no difference between the ESA and CEN for the CORR. For Dakhla, both ESA/CEN underestimate the PET (MBESA/CEN equals = - 1.96 mm day-1) concerning the OBS. Such behavior was confirmed with a low STD (STDESA/CEN equals 0.687/0.683).
The ESA and CEN showed a similar performance concerning the OBS in Giza. This point was confirmed with an MBESA/CEN of -0.5 mm day-1, CORRESA/CEN of 0.996 and STDESA/CEN of 0.997. In addition, both ESA and CEN underestimate the PET in comparison with the OBS. In Ismailia, the situation was different because the performance of the ESA/CEN varies with the month. For example, both ESA and CEN underestimate the PET in January, February and from June to December. On the other hand, they are close to the OBS from March till May. Overall, the MBESA equals -0.29 mm day-1 and the MBESA equals -0.25 mm day-1 with no difference noted concerning the CORR and STD. Additionally, the PET was underestimated (by the ESA/CEN) concerning the OBS in Kharga. Such behavior was quantitatively confirmed with an MBESA/CEN of -1.52 mm day-1, CORRESA/CEN of 0.735 and STDESA/CEN of 0.997. In Luxor, both ESA and CEN were close to each other and they underestimated the PET (in all months concerning the OBS). From a quantitative point of view, the MBCEN equals + 1.12 mm day-1 and MBESA equals + 1.15 mm day-1; while STDCEN equals 1.031 and STDESA equals 1.026 with CORRESA/CEN of 0.99. Finally in Siwa, the CEN outperforms the ESA because the MBCEN equals -0.7 mm day-1 and the MBESA equals -0.9 mm day-1; while the STDCEN equals 0.967 and STDESA equals 0.924 with a CORRESA/CEN of 0.998.
Discussion and Conclusion
Soil moisture plays an important role in the climate system. Indeed, such a point has been confirmed in controlling plant transpiration and photosynthesis [2] using the global/regional climate model [3]. Because of the long-term memory of the soil moisture, the role of different products of the initialized soil moisture was explored using the global/regional climate model [3,4]. Additionally, the authors of [5] documented the role of soil moisture initialization in improving the forecast of thunderstorm severity. In Egypt, the authors of [6] examined the sensitivity of the daily TMX/TMN to the soil moisture status and land surface parameterization within the framework of the RegCM4. They reported that the RegCM4 was sensitive to the status of the soil moisture. Furthermore, a difference between the BATS and CLM45 was noticed when the RegCM4 was initialized with the ESACCI. However, the role of different products of the initialized soil moisture (in simulating the PET in arid regions such as Egypt) has not been investigated till the present day.
In the present study, the sensitivity of the daily TMX/TMN and PET of Egypt to different products of soil moisture (ESACCI as a satellite and Century as a reanalysis) was investigated concerning various reanalysis products. The ERA-Interim reanalysis was used to downscale the RegCM4 with 25 grid spacing from 1979 to 2010. The ERA5/CRU products were used (as the observational dataset) to evaluate the PET and TMX/TMN. The results showed that switching between ESACCI (ESA) and Century (CEN) didn’t impose a considerable impact on the solar radiation budget. Such behavior explains why the sensible heat flux and TMX weren’t sensitive to the initialized soil moisture product. However, the long wave radiation budget was notably perturbed by the influence of the ground temperature and eventually, the TMN was affected. Additionally, the CEN was found to outperform the ESA (in all seasons concerning the CRU).
Concerning the PET, it was noticed that the CEN outperforms the ESA (in all seasons in comparison with the ERA5). Such behavior was attributed to the fact that the CEN showed a larger difference (between the TMX and TMN) than the one noted in the ESA, which explains the ability of the CEN to reduce the noted PET negative bias (in the ESA) concerning the ERA5. On a point scale, it was observed that the behavior of the ESA/CEN varies with the location and month. In comparison with the results reported by [6], it was noticed that only TMN was affected. However, it can be seen that the TMN changes played an important role in controlling the PET changes. Additionally, the CEN has proved its efficiency in a proper simulation of the TMN and eventually the PET. In conclusion, the CEN (as an initial condition) can be recommended for future studies of conducting a regional PET map of Egypt either in the present climate or under different future scenarios. Future work will consider the role of different physical parameterizations affecting the PET, manipulating a new version of the RegCM (with a new dynamical core; [36]), other reanalysis/satellite products of the soil moisture and linear-scaling bias correction method (to reduce the PET bias; [55]).
Acknowledgment
Egyptian Meteorological Authority (EMA) is acknowledged for providing the computational power to conduct the model simulations. ECWMF is acknowledged for providing the ERA5 reanalysis product from the web link https://cds.climate.copernicus.eu/. Climate Research Unit is acknowledged for providing the monthly mean of the TMX/TMN datasets.
Supplementary File
Funding
No funding was received for this study.
Institutional Review Board Statement
Not applicable.
Data Availability Statement
Not applicable.
Informed Consent Statement
Not applicable.
Conflicts of Interest
There is no conflict of interest.
References
- Seneviratne SI, Corti T, Davin EL, Hirschi M, Jaeger EB, Lehner I, Orlowsky B, Teuling AJ. Investigating soil moisture–climate interactions in a changing climate: A Review. Earth Science Reviews. 2010;99:125-161. doi: 10.1016/j.earscirev.2010.02.004.
- Anwar SA, Zakey AS, Robaa SM, Wahab MM. The influence of two land-surface hydrology schemes on the regional climate of Africa using the RegCM4 model. Theor Appl Climatol. 2019;136:1535. doi: 10.1007/s00704-018-2556-8.
- Seo E, Lee MI, Jeong JH, et al. Impact of soil moisture initialization on boreal summer subseasonal forecasts: mid-latitude surface air temperature and heat wave events. Clim Dyn. 2019;52:1695-1709. doi: 10.1007/s00382-018-4221-4
- Zhang H, Liu J, Li, H Meng, X, Ablikim A. The impacts of soil moisture initialization on the forecasts of weather research and forecasting model: A case study in xinjiang, China. Water. 2020;12:1892. doi: 10.3390/w12071892.
- Osuri KK, Nadimpalli R, Mohanty UC, Chen F, Rajeevan M, Niyogi D. Improved prediction of severe thunderstorms over the Indian Monsoon region using high-resolution soil moisture and temperature initialization. Sci Rep. 2017 Jan 27;7:41377. doi: 10.1038/srep41377. PMID: 28128293; PMCID: PMC5269717.
- Anwar SA, Mostafa SM. Assessment of the sensitivity of daily maximum and minimum air temperatures of Egypt to soil moisture status and land surface parameterization using RegCM4. Eng Proc. 2023;56:115. doi: 10.3390/ASEC2023-15353.
- Dorigo W, Wagner W, Albergel C, Albrecht F, Balsamo G, Brocca L, Chung D, Ertl M, Forkel M, Gruber A, Haas E, Hamer P, Hirschi M, Ikonen J, Jeu R de, Kidd R, Lahoz WA, Liu YY, Miralles D, Mistelbauer T, Nicolai-Shaw N, Parinussa R, Pratola C, Reimer C, Schalie R van der, Seneviratne SI, Smolander T, Lecomte P. ESA CCI soil moisture for improved earth system understanding: State-of-the art and future directions. Remote Sens. Environ. 2017;203:185-215. doi: 10.1016/j.rse.2017.07.001.
- Gruber A, Scanlon T, van der Schalie R, Wagner W, Dorigo W. Evolution of the ESA CCI soil moisture climate data records and their underlying merging methodology. Earth Syst Sci Data. 2019;11:717-739. doi: 10.5194/essd-11-717-2019.
- Giorgi F, Coppola E, Solmon F, Mariotti L, Sylla MB, Bi X, Elguindi N, Diro GT, Nair V, Giuliani G, Turuncoglu UU, Cozzini S, Güttler I, O’Brien TA, Tawfik AB, Shalaby A, Zakey S, Steiner AL, Stordal F, Sloan LC, Branković C. RegCM4: Model description and preliminary tests over multiple CORDEX domains. Clim. Res. 2012;52:7-29. doi: 10.3354/cr01018.
- Oleson KW, Lawrence DM, Bonan GB, Drewniak B, Huang M, Koven CD, Levis S, Li F, Riley WJ, Subin ZM Swenson SC, Thornton PE, Bozbiyik A, Rosie F, Heald C, Kluzek E, Lamarque JF, Lawrence PJ, Leung LR, Lipscomb WH, Muszala S, Ricciuto DM, Sacks WJ, Sun Y, Tang J, Yang ZL. Technical description of version 4.5 of the Community Land Model (CLM); NCAR technical note NCAR/TN-503þ STR; National Center for Atmospheric Research. 2013. doi: 10.5065/D6RR1W7M.
- Dickinson RE, Henderson-Sellers A, Kennedy PJ. Biosphere-Atmosphere Transfer Scheme (BATS) version 1e as coupled to the ncar community climate model (No. NCAR/TN-387þ STR). University Corporation for Atmospheric Research. 1993. doi: 10.5065/D67W6959.
- Harris I, Osborn TJ, Jones P, Lister D. Version 4 of the CRU TS monthly high-resolution gridded multivariate climate dataset. Sci Data. 2020;7(1):109. doi: 10.1038/s41597-020-0453-3.
- Anwar SA. Simulating daily soil temperature in Egypt using a high-resolution regional climate model: sensitivity to soil moisture and temperature initial conditions. Eng Proc. 2023;56:106. doi: 10.3390/ASEC2023-15368.
- Allen GR, Pereira SL, Raes D, Smith M. Crop evapotranspiration: Guidelines for computing crop water requirements; report 56; food and agricultural organization of the united nations (FAO): Rome. 1998.
- Brutsaert W, Parlange MB. Hydrologic cycle explains the evaporation paradox. Nature. 1998;396(6706):30-30. doi: 10.1038/23845.
- Spinoni J, Barbosa P, Bucchignani E, Cassano J, Cavazos T, Cescatti A, Christensen JH, Christensen OB, Coppola E, Evans JP, Forzieri G, Geyer B, Giorgi F, Jacob D, Katzfey J, Koenigk T, Laprise R, Lennard CJ, Kurnaz ML, Li D, Llopart M, McCormick N, Naumann G, Nikulin G, Ozturk T, Panitz HJ, da Rocha RP, Solman SA, Syktus J, Tangang F, Teichmann C, Vautard R, Vogt JV, Winger K, Zittis G, Dosio A. Global exposure of population and land-use to meteorological droughts under different warming levels and SSPs: A CORDEX-based study. Int J Climatol. 2021;41(15):6825-6853. doi: 10.1002/joc.7302.
- Hargreaves GH, Samni ZA. Estimation of potential evapotranspiration. J Irrig Drain Div Proc Am Soc Civ Eng. 1982;108:223-230.
- Hargreaves GH, Samani ZA. Reference crop evapotranspiration from temperature. Appl Eng Agr. 1985;1(2):96-99. doi: 10.13031/2013.26773.
- Priestley CHB, Taylor RJ. On the assessment of surface heat flux and evaporation using large-scale parameters. Mon Weather Rev. 1972;100:81-92. doi: 10.1175/1520-0493(1972)100<0081:OTAOSH>2.3.CO;2.
- Rohwer C. Evaporation from free water surface. USDA Tech Null. 1931;217:1-96.
- Raziei T, Pereirab LS. Estimation of ETo with Hargreaves–Samani and FAO-PM temperature methods for a wide range of climates in Iran. Agricultural Water Management. 2013;121:1-18. doi: 10.1016/j.agwat.2012.12.019.
- Rajabi A, Babakhani Z. The study of potential evapotranspiration in future periods due to climate change in west of Iran. Int J Clim Chang Strateg Manag. 2018;10:161-177. doi: 10.1108/IJCCSM-01-2017-0008.
- Elagib NA, Musa AA. Correcting Hargreaves–Samani formula using geographical coordinates and rainfall over different timescales. Hydrological Processes. 2022;37:14790. doi: 10.1002/hyp.14790.
- Giménez PO, García-Galiano SG. Assessing Regional Climate Models (RCMs) ensemble-driven reference evapotranspiration over Spain. Water. 2018;10(9):1181. doi: 10.3390/w10091181.
- Hargreaves GL, Allen RG. History and evaluation of Hargreaves evapotranspiration equation. J Irrigat Drain Eng. 2003;129:53-63. doi: 10.1061/(ASCE)0733-9437(2003)129:1(53).
- Slivinski LC, Compo GP, Whitaker JS, Sardeshmukh PD, Giese BS, McColl C, Allan R, Yin X, Vose R, Titchner H, Kennedy J, Spencer LJ, Ashcroft L, Brönnimann S, Brunet M , Camuffo D, Cornes R, Cram TA, Crouthamel R, Domínguez-Castro F, Freeman EJ, Gergis J, Hawkins Ed, Jones PD, Jourdain S, Kaplan A, Kubota H, Le Blancq F, Lee TC, Lorrey A, Luterbacher J, Maugeri M, Mock CJ, Kent Moore GW, Przybylak R, Pudmenzky C, Reason C, Slonosky VC, Smith CA, Tinz B, Trewin B, Valente MA, Wang XL, Wilkinson C, Wood K, Wyszyński P. Towards a more reliable historical reanalysis: Improvements for version 3 of the twentieth century reanalysis system. Q J R Meteorol Soc. 2019;145:2876-2908. doi: 10.1002/qj.3598.
- Singer M, Asfaw D, Rosolem R, Cuthbert MO, Miralles DG, MacLeod D. Michaelides K. Hourly Potential Evapotranspiration (hPET) at 0.1degs grid resolution for the global land surface from 1981-present. Sci Data 2021;8:224. doi: 10.1038/s41597-021-01003-9.
- Anwar SA, Srivastava A. On the sensitivity of potential evapotranspiration in Egypt to different dynamical downscaling options and boundary layer schemes using a high-resolution regional climate model. Eng Proc. 2023;56:116. doi: 10.3390/ASEC2023-15357.
- Giorgi F. Thirty years of regional climate modeling. Where are we and where are we going? J Geophys Res. 2019;124:5696-5723. doi: 10.1029/2018JD030094.
- Giorgi F, Bates GT. The climatological skill of a regional model over complex terrain. Mon Wea Rev. 1989;117:2325-2347. doi: 10.1175/1520-0493(1989)117<2325:TCSOAR>2.0.CO;2.
- Giorgi F, Marinucci MR, Bates GT. Development of a second generation Regional Climate Model (RegCM2). Part I: Boundary layer and radiative transfer processes. Mon Wea Rev.1993;121:2794-2813.
- Giorgi F, Marinucci MR, Bates GT, DeCanio G. Development of a second generation regional climate model (RegCM2). Part II: Convective processes and assimilation of lateral boundary conditions. Mon Wea Rev. 1993;121:2814-2832.
- Pal JS, Giorgi F, Bi X, Elguindi N, Solmon F, Gao X, Rauscher SA, Francisco R, Zakey A, Winter J, Ashfaq M, Syed FS, Bell JL, Diffenbaugh NS, Karmacharya J, Konaré A, Martinez D, Rocha RP, Sloan LC, Steiner AL. The ICTP RegCM3 and RegCNET: Regional climate modeling for the developing World. Bull Amer Meteor Soc. 2007;88:1395-1409. doi: 10.1175/BAMS-88-9-1395.
- Giorgi F, Coppola E, Solmon F, Mariotti L, Sylla MB, Bi X, Elguindi N, Diro GT, Nair V, Giuliani G, Turuncoglu UU, Cozzini S, Güttler I, O'Brien TA, Tawfik AB, Shalaby A, Zakey AS, Steiner AL, Stordal F, Sloan LC, Brankovic C. RegCM4: Model description and preliminary tests over multiple CORDEX domains. Clim Res. 2021;52:7-29.
- Coppola E, Stocchi P, Pichelli E, Torres Alavez JA, Glazer R, Giuliani G, Di Sante F, Nogherotto R, Giorgi F. Non-Hydrostatic RegCM4 (RegCM4-NH): Model description and case studies over multiple domains. Geoscientific Model Development. 2021;14(12):7705-7723. doi: 10.5194/gmd-14-7705-2021.
- Giorgi F, Coppola E, Giuliani G, Ciarlo JM, Pichelli E, Nogherotto R, Raffaele F, Malguzzi P, Davolio S, Stocchi P, Drofa O. The Fifth Generation Regional Climate Modeling System, RegCM5: Description and Illustrative Examples at Parameterized Convection and Convection-Permitting Resolutions. J Geophys Res Atmos. 2023. doi: 10.1029/2022JD038199.
- Kiehl JT, Hack J, Bonan G, Boville B, Breigleb B, Williamson D, Rasch P. Description of the ncar community climate model (ccm3), National Center for Atmospheric Research Technical Note NCAR/TN-420+STR. 1996;95.
- Mlawer EJ, Taubman SJ, Brown PD, Iacono MJ, Clough SA. Radiative transfer for inhomogeneous atmosphere: RRTM, a validated correlated-k model for the longwave. J Geophys Res. 1997;102(16):663-16,682.
- Holtslag AAM, Boville BA. Local versus nonlocal boundary layer diffusion in a global model. J Clim. 1993;6:1825-1842. doi: 10.1175/1520-0442(1993)006<1825:LVNBLD>2.0.CO;2.
- Grenier H, Bretherton CS. A moist PBL parameterization for large scale models and its application to subtropical cloud topped marine boundary layers. Mon Weather Rev. 2001;129:357-377. doi: 10.1175/1520-0493(2001)129<0357:AMPPFL>2.0.CO;2.
- Emanuel KA, Zivkovic-Rothman M. Development and evaluation of a convection scheme for use in climate models. J Atmos Sci. 1999;56:1766-1782. doi: 10.1175/1520-0469(1999)056<1766:DAEOAC>2.0.CO;2.
- Anwar SA, Lazić I. Estimating the potential evapotranspiration of Egypt using a regional climate model and a high-resolution reanalysis dataset. Environ Sci Proc. 2023;25:29. doi: 10.3390/ECWS-7-14253.
- Anwar SA, Malcheva K, Srivastava A. Estimating the potential evapotranspiration of Bulgaria using a high‑resolution regional climate model. Theor Appl Climatol. 2023;152:1175-1188. doi: 10.1007/s00704-023-04438-9.
- Anwar SA, Mamadou O, Diallo I, Sylla MB. On the influence of vegetation cover changes and vegetation-runoff systems on the simulated summer potential evapotranspiration of tropical Africa using RegCM4. Earth Syst Environ. 2021;5:883-897. doi: 10.1007/s41748-021-00252-3.
- Hersbach H, Bell B, Berrisford P, Hirahara S, Horanyi A, Muñoz- Sabater J, Nicolas J, Peubey C, Radu R, Schepers D, Simmons A, Soci C, Abdalla S, Abellan X, Balsamo G, Bechtold P, Biavati G, Bidlot J, Bonavita M, De Chiara G, Dahlgren P, Dee D, Diamantakis M, Dragani R, Flemmin, J Forbes R, Fuentes M, Geer A, Haimberger L, Healy S, Hogan RJ, Holm E, Janiskova M, Keeley S, Laloyaux, P, Lopez P, Lupu C, Radnoti, G, de Rosnay P, Rozum I, Vamborg F, Villaume S, Thépaut JN. The ERA5 global reanalysis. QJR Meteorol Soc. 2020;146:1999-2049. doi: 10.1002/qj.3803.
- Steiner AL, Pal JS, Rauscher SA, Bell JL, Diffenbaugh NS, Boone A, Sloan LC, Giorgi F. Land surface coupling in regional climate simulations of the West African monsoon. Clim Dyn. 2009;33(6):869-892. doi: 10.1007/s00382-009-0543-6.
- Singer MB, Asfaw DT, Rosolem R, Cuthbert MO, Miralles DG, MacLeod D, Quichimbo EA, Michaelides K. Hourly potential evapotranspiration at 0.1° resolution for the global land surface from 1981-present. Sci Data. 2021 Aug 24;8(1):224. doi: 10.1038/s41597-021-01003-9. PMID: 34429438; PMCID: PMC8385079.
- Muñoz-Sabater J, Dutra E, Agustí-Panareda A, Albergel C, Arduini G, Balsamo G, Boussetta S, Choulga M, Harrigan S, Hersbach H, Martens B, Miralles DG, Piles M, Rodríguez-Fernández, N J, Zsoter E, Buontempo C, Thépaut JN. ERA5-Land: A state-of-the-art global reanalysis dataset for land applications. Earth Syst Sci Data. 2021;13:4349-4383. doi: 10.5194/essd-13-4349-2021.
- Chen H, Zhu G, Zhang K, Bi J, Jia X, Ding B, Zhang Y, Shang S, Zhao N, Qin W. Evaluation of evapotranspiration models using different lai and meteorological forcing data from 1982 to 2017. Remote Sensing. 2020;12(15):2473. doi: 10.3390/rs12152473.
- Martens B, Miralles DG, Lievens H, van der Schalie R, de Jeu RAM, Fernández-Prieto D, Beck HE, Dorigo WA, Verhoest NEC. GLEAM v3: Satellite-based land evaporation and root-zone soil moisture. Geosci. Model Dev. 2017;10:1903-1925. doi: 10.5194/gmd-10-1903-2017.
- Anwar SA, Srivastava A. On the sensitivity of potential evapotranspiration in Egypt to different dynamical downscaling options and boundary layer schemes using a high-resolution regional climate model. Eng Proc. 2023;56:116. doi: 10.3390/ASEC2023-15357.
- Perez J, Menendez M, Mendez FJ, Losada IJ. Evaluating the performance of CMIP3 and CMIP5 global climate models over the north-east Atlantic region. Clim Dyn. 2014;43:2663-2680. doi: 10.1007/s00382-014-2078-8.
- Hamed MM, Nashwan MS, Shahid S. Inter-comparison of historical simulation and future projection of rainfall and temperature by cmip5 and cmip6 GCMS over Egypt. Int J Climatol. 2022a;42:4316-4332. doi: 10.1002/joc.7468.
- Hamed MM, Nashwan MS, Shiru MS, Shahid S. Comparison between CMIP5 and CMIP6 models over mena region using historical simulations and future projections. Sustainability. 2022b;14:10375. doi: 10.3390/su141610375.
- Mostafa, SM, Anwar SA, Zakey AS, Wahab MMA. Bias-correcting the maximum and minimum air temperatures of Egypt using a high-resolution regional climate model (RegCM4). Eng Proc. 2023;31:73. doi: 10.3390/ASEC2022-13852.a
Content Alerts
SignUp to our
Content alerts.
 This work is licensed under a Creative Commons Attribution 4.0 International License.


