> Biology Group. 2021 October 30;2(10):1018-1034. doi: 10.37871/jbres1345.
Antimicrobial Spectrum, Growth/Killing Kinetics, Conventional/Molecular Assay of Characterizing Non-Leguminous Endophytic Bacteria and Fungi from helianthus annuus, Carica papaya and Lycoperesicum solanum
Osuntokun OT1*, Azuh VO1, Adejoro BF1 and Akele EO2
2Biorepository & Clinical Virology, University Teaching Hospital, Ibadan, Oyo State, Nigeria
- Antimicrobial spectrum
- Growth/killing kinetics
- Conventional/molecular assay
- Non-leguminous Eendophytic bacteria
- helianthus annuus
- Carica papaya
- Lycoperesicum solanum
Abstract
The aim of this study is to comparative study between conventional and molecular assay of isolation, identification and characterization of non-leguminous endophytic bacteria and fungi in the leguminous root samples. The plant root samples, helianthus annuus, Carica papaya and Lycoperesicum solanum (Sunflower root and stem, pawpaw root and stem, and tomato root and stem from Adekunle Ajasin University School farm, Akungba Akoko, Ondo state, Nigeria. The isolation of endophytic bacteria were performed using the conventional method of isolation (biochemical test) and characterization were done using both the conventional and molecular method of bacteria characterization. The antibiotic susceptibility test (Antibiogram) was observed using disc diffusion. The four bacteria identified were Bacillus cereus, Enterobacter sp. Actnomycoses sp. and Aeromonas sp. for conventional method and Fusarium solani, Fusarium vortecelium and Bacillus thuringiensis for molecular method as confirmatory point of view. In this study, all isolated organisms tends to be Gram positive using the gram staining technique. Antibiogram shows the zones of inhibition with diameter ranging from 0-20 mm, Enterobacter sp. were more sensitive to the various antibiotics used. Ultraviolet spectrophotometer was also used to determine the growth dynamic as well as the death rate of the isolates, the addition of antibiotics (ciprofloxacin) to the isolates at the 24th hour speed up the death rate of the isolates from non-leguminous endophytic bacteria. After the preliminary identification of the bacteria isolates and the confirmatory identification of both bacteria and fungi isolates of the non-leguminous endophytic microorganism, it was noted that the preliminary identification was only able to achieve the genus level of taxonomic characterization, While the molecular method confirm the molecular sub level identification of isolates depletes the absolute taxonomic identification and characterization to the sub-species level. The results of this study validates the use of molecular sequencing for the assay identification and characterization of non-leguminous endophytic bacteria and fungi as the easy and best mode of identification of both bacteria and fungi isolates as a veritable tools for research purposes.
Introduction
Endophytic microbes brings nutrients to plants include those that fix atmospheric nitrogen in plant tissues. These types of endophytes include actinorhizal and rhizobial symbioses. Because of sensitivity of nitrogenases to oxygen, the few families of plants that engage in nitrogen-fixing symbioses sequester microbes in low oxygen nodules where nitrogen is fixed and transferred to root tissues [1].
Another type of nutritional endophytic symbiosis involves microbes that inhabit both endophytic tissues and extend out into soil. Dark septate endophytes and mycorrhizal fungi establish this kind of symbiosis with many families of plants. Hyphae of these fungi grow endophytically in roots, and the mycelia extending into soil acquire nutrients and mobilize it back to plants. Another nutrient acquisition mechanism involves the liberation of nutrients from insects by microbes that extend between, or cycle between, plants and decaying insects. In this process insects consume plants, accumulating nitrogen and other nutrients in their bodies; degradation of insects by microbes that are also symbiotic with plants results in transfer of nutrients to plants [2].
Sunflowers are botanically classified as helianthus annuus. They are a large plant and are grown throughout the world because of their relatively short growing season. Domesticated sunflowers typically have a single stalk topped by a large flower. This is significantly different from the smaller, multiply branched wild sunflower. During the growing season, the individual flowers are each pollinated, seed development then begins moving from the outer rim of the flower toward the centre. It generally takes 30 days after the last flower is pollinated for the plant to mature.
It is a deep rooted crop and pulls out water from below the root zone of soil. It show positive response on limitation of precipitation, soil water and irrigation to growth and yield [2]. Sunflower yield in low due to less and improper use of fertilization. All the nutrients are important but nitrogen is most essential, because it increase in root and leaf length, leaf area duration, photosynthesis and increase seed yield [3]. There are many responsible factors for increasing yield per hector but management of fertilizers is more important for increasing growth, development and yield of sunflower crop. Nitrogen is consider essential nutrient for sunflower crop, which increased vegetative growth and seed yield, but excessive fertilization increased plant height and lodging [4].
Tomato (Lycopersicum solanum) is a perishable vegetable widely cultivated and consumed worldwide [5]. It is rich in nutrients, vitamins, dietary fibres, and phytochemicals [6]. It is known to be a very profitable crop that provides high returns for small scale farmers in most developing countries [7]. However, isolation and identification of microorganisms that are associated root of tomatoes have gained some research focus [8].
The presence of bacteria with a potential risk to humans like Alcaligenes faecalis, Acinetobacter baumannii, Bacillus cereus, Burkholderia cepacia, Chromobacterium violaceum, Enterobacter hormaechei, Pseudomonas aeruginosa, Proteus vulgaris, Pantoea agglomerans, Serratia marcescens and Staphylacoccus sp. in the rhizosphere of many plants has been reported previously [8]. It has been also reported that potential pathogens may internalize tissues of pre-harvest lettuce, alfalfa, cress and tomatoes [8]. P. aeruginosa, a dominant pathogen infecting the lungs of cystic fibrosis patients and capable of infecting various tissues and organs [9]. Some fungi has been claimed to be identified by various authors, some of which include; Pyrenochaeta lycopersici, Fusarium oxysporum, Pythium sp. and Rhizoctonia sp., Phytophthora nicotiana var. nicotiana, Phytophthora parasitical and P. capsici [9].
A more in-depth knowledge on the status of microbial endophytes and their beneficial activities in the sub-Saharan African cropping systems is, however, still lacking. Fungal root endophytes are a phylogenetically diverse group primarily occurring within the Ascomycota, although some belong to the Basidiomycota. Piriformospora indica (Phyllum Basidiomycota) and particular isolates within Trichoderma and Fusarium species (Phylum Ascomycota) have been reported to enhance growth of various plant species and to induce resistance to pests like insects and nematodes [10]. Some research has also revealed positive effects of Dark Septate Endophytes (DSE) which comprise a group of asexual ascomycetes and are characterized by dark melanized septa on plant growth, yield and nutrient uptake [11].
In Nigeria, pawpaw is one of the most popular, cheapest, economically important fruit tree grown and consumed for its nutritional content [12]. Pawpaw (Carica papaya L.) belongs to the family Caricaceae with over 22 species and only one member of the genus Carica that is cultivated as a fruit tree while the other three genera (Cyclicomorpha, Jarilla and Jacaratia are grown primarily as ornamentals [13]. Pawpaw (C. papaya. L) is short lived, with a hollow unbranched herbaceous stem. It is dual or multipurpose early bearing, space conserving crop. Papaya may be monoecious or hermaphrodite.
Pawpaw (C. papaya L.) Extracts have exhibited inhibitory effects on gram-positive bacteria and gram-negative bacteria. These organisms include: Bacillus subtilis, Escherichia coli, Salmonella typhi, Staphylococcus aureus, Enterobacter cloacae and Proteus vulgaris [14]. Aspergillus niger, Rhizopus nigricans, Aspergillus flavus, Rhizopus oryzae and Fusarium moniliforme of fungal origin are responsible for post-harvest losses in pawpaw.
Materials and Methods
Collection of samples
Mature plant specimen of three leguminous plants; helianthus annuus, Lycopersicum solanum and Carica papaya were randomly collected from the school farm of Adekunle Ajasin University, Akungba-Akoko (7.2704 °N, 5.2241°E) in triplicates. The plant specimen were authenticated by the Department of Microbiology, Faculty of Science.
Serial dilution of plant samples
Serial dilution was carried out on the plant root samples collected. 9mls of distilled water was measured using sterile syringe and needle into ten (10) test tubes and corked with cotton wool and covered with aluminum foil and sterilized in an autoclave at 121°C for 15 minutes in order to prevent contamination. After sterilization the water was allowed to cool to about 35°C-40°C. 1 g of the macerated root sample was measured and dispersed into the 9 mL of water contained in the first test tube making 10-1 dilution using a sterile syringe and needle, from 10-1 dilution, aliquots of 1mL into the second test tube containing 9 mL of sterile water making 10-2, this process was repeated for other test tubes until the 10-10 test tube was prepared.
Bacteria isolation from plant sample
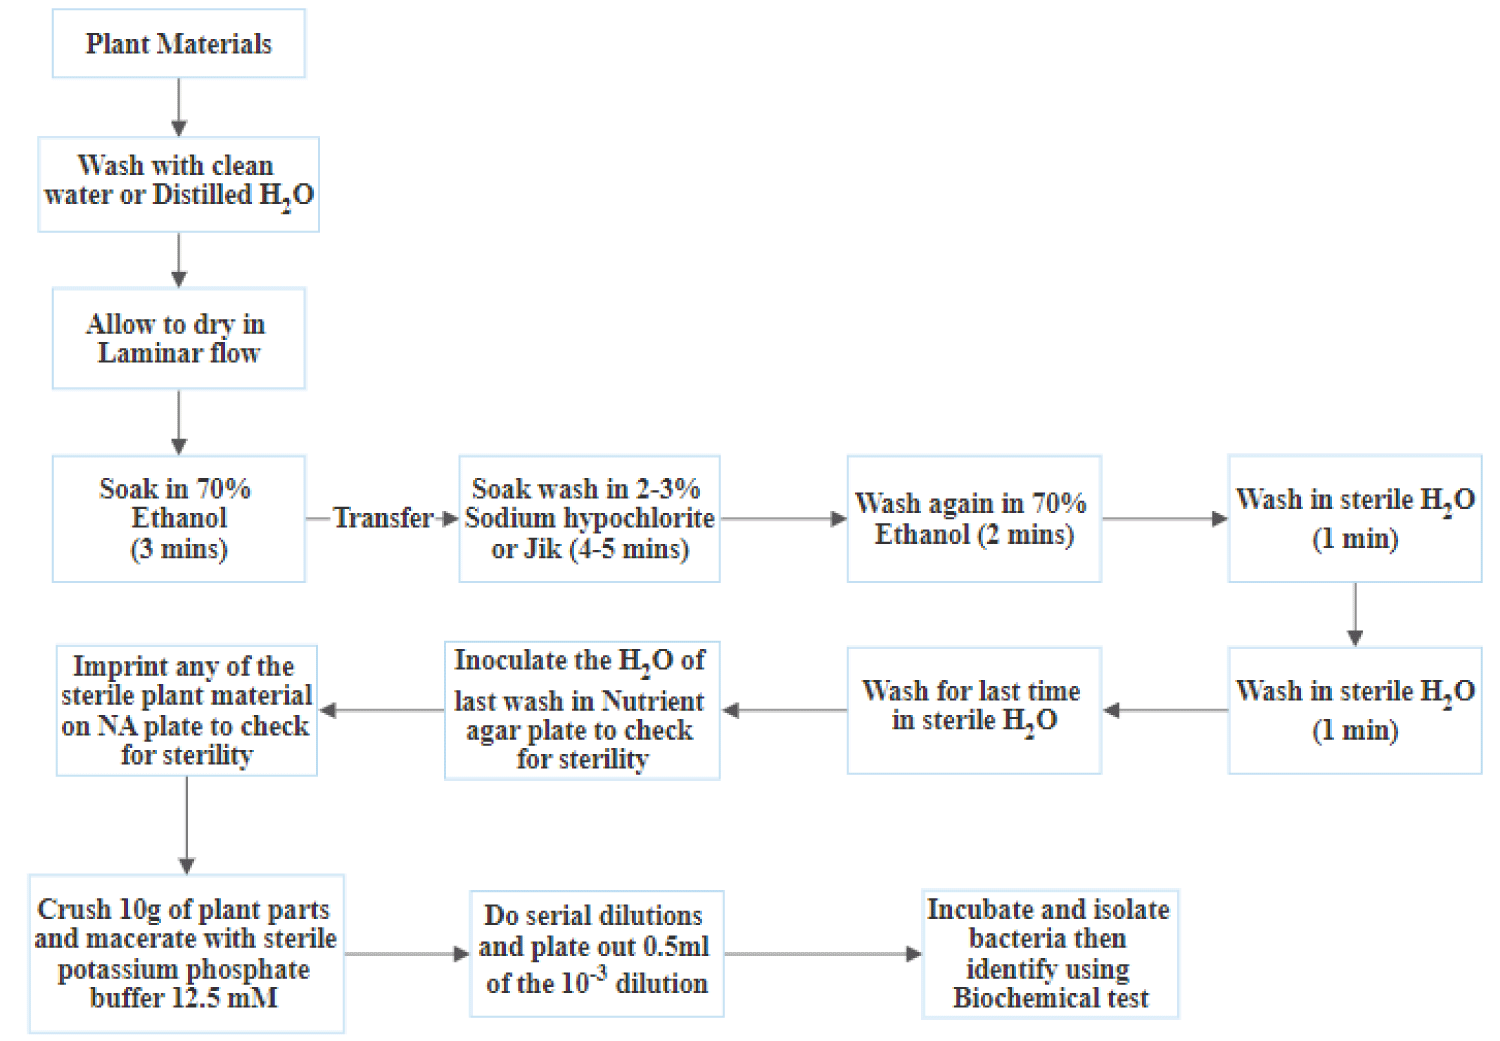
The samples collected were separately washed with tap water, followed by surface sterilization using 70% ethanol for 30 seconds, 2% Sodium Hypochlorite (NaOCl) for 5 minutes, 3% Hydrogen peroxide for 30 seconds and then rinsed five times with distilled water, to remove epiphytic microbes. Ten grams of these samples were cut to 2-3 cm pieces and macerated using sterilized mortar and pestle with 12.5 mm potassium phosphate buffer (pH 7.1), followed by a 10-fold serial dilution where 0.5 ml of the 10-3 dilution was plated using the pour plate method on Nutrient Agar supplemented with Cycloheximide (100 μg/mL) to inhibit fungal growth. Inoculated Petri plates were incubated at 37°C for 24 hours. After the incubation time, the Colony Forming Units (CFU) for each plate was estimated [15]. Isolates differing in morphological appearance were selected and were streaked onto new plates until pure cultures were obtained. Pure cultures of bacterial isolates were maintained on NA slants and were stored at 4°C.
Efficiency of surface sterilization plant sample
The efficiency of surface sterilization procedure was necessarily checked by imprint method, also success of the surface sterilization method was confirmed by the absence of any microbial growth on media plates impregnated with 50 μl aliquots of the final rinse water. This was done to avoid isolation of epiphytic organisms, the surface sterilization was considered successful as there was no growth [16].
Pour plate technique for enumeration of non-leguminous endophytic bacteria count from plant sample
From the serial dilution above, 0.5 mL of the 10-7 and 10-10 from each root samples was spread evenly into two Petri-dishes respectively using Nutrient Agar for helianthus annuus, and both Nutrient Agar and Potato Dextrose Agar for Solanum lycopersicum and Carica papaya. The prepared agar (NA) and (PDA) was allowed to cool to 45°C and aseptically poured into the Petri-dishes (about 20 mL each) to make a plate. The plates was rotated clockwise and anti-clockwise to ensure even distribution of the sample within the medium and also to allow the agar form a uniform layer [16].
Incubation of non-leguminous endophytic bacteria isolates from plant sample
After the agar has been cooled and gelled, the Petri-dishes was inverted to prevent condensation dropping from the lid into the agar and then incubated in the incubator at 37°C for 24-78 hours.
Total bacteria count of non-leguminous endophytic bacteria isolates from plant sample
After 24 to72 hours of incubation, the plates were examined thoroughly and the plates containing 10-7 was discarded due to lack of distinct colony, other plate used in microbiological culture of 10-10 was properly observed. The total colonies were counted using a colony counter. The count can also be done easily by dividing the plate into four quarters, the first quarter counted first and recorded then the second quarter till the fourth quarter which was noted and recorded (17).
Identification of non-leguminous endophytic bacteria isolates from plant sample
Preliminary identification of the bacterial isolate where based on their morphological characteristics and result from various biochemical tests carried out on them. Each of the endophytic isolate were cultured on media and observed after 24h of incubation for their morphological characteristics. Biochemical characteristics were determined according to the methods of Olutiola [18] and examined according to the Bergey's Manual of Determinative Bacteriology [19]. This was done to confirm the identity of the endophytic bacteria isolates.
Isolation of non-leguminous endophytic bacteria isolates from plant sample isolation method (sub-culturing)
Nutrient agar was prepared according to manufacturer instruction. The homogenized agar was poured into sterilized McCartney bottles and autoclaved at 121°C for 15 minutes. The bottles containing media was placed in slanting position and allowed to cool. After cooling, distinct colonies was sub-cultured by streaking on the slants. This was done by using sterile inoculating loop to pick part of the colony and inoculated on the solidified media in the bottle (slant). After the streaking process, the slants were incubated at 37 °C for 24 hours. The slants will further be kept in the refrigerator to serve as stock culture for subsequent test during identification. This process was carried out aseptically to avoid contamination [17].
Morphological characterization of non-leguminous endophytic bacteria isolates from plant sample
The appearance of the colony of each isolate on the agar media was studied and characteristics such as shape, edge, pigment, opacity, elevation and surface were observed as described by Olutiola [18].
Gram staining of non-leguminous endophytic bacteria isolates from plant sample
This test was carried out on 24h old cultures of the isolate in order to determine their gram reaction and cellular morphology. The gram reaction differentiates bacteria into gram positive and gram-negative bacteria. A smear of the culture between 18 to 24 hours was prepared on a clean grease free microscope slide with a drop of sterile distilled water and mixed. The smear was allowed to dry and then heat-fixed by passing the slide over a spirit flame once or twice. The heat-fixed smear was flooded with crystal violet and allowed to stain for 60s after which the stain was poured off and rinsed with water, the slide was flooded with iodine solution and will be allowed to stand for another 60s and then poured off and rinsed with water, the smear was decolorized with 95% ethanol and rinsed immediately after 10s with water. The smear was further counter stained with safranin for another 60s after which was gently rinsed off with water. It was air-dried and examined under the oil immersion objectives of 100x light microscope. The gram reaction, shape and arrangement of cell were then recorded [20].
Biochemical test for preliminary identification of non-leguminous endophytic bacteria isolates from plant sample
Catalase test: The inability of strict anaerobes to synthesize catalase, peroxidase, or superoxide dismutase may explain why oxygen is poisonous to these microorganisms. In the absence of these enzymes, the toxic concentration of H2O cannot be degraded when these organisms are cultivated in the presence of oxygen. Organism capable of producing catalase rapidly degrade hydrogen peroxide which is a tetramer containing four porphyrin heme groups (i.e. iron groups) that will allow the enzyme to react with hydrogen peroxide [15].
The enzyme catalase is present in most cytochrome containing aerobic and facultative anaerobic bacteria. Catalase has one of the highest turnover numbers of all enzyme such that one molecules of catalase can convert millions of molecules of hydrogen peroxide to water and oxygen in a second. Catalase production and activity can be detected by adding the substrate H2O2 to an approximately incubated (18-to 24-h) slant culture. Organisms which produces the enzyme break down the hydrogen peroxide, and the resulting oxygenproduction produces bubbles in the reagent drop, indicating a positive test. Organisms lacking the cytochrome system also lack the catalase enzyme and are unable to break down hydrogen peroxide, into O2 and water and thus are catalase negative [20].
Oxidase test: This was carried out using oxidase reagent as described by Baker, et al. (2001). Two drops of freshly-prepared oxidase reagent (1% aqueous tetramethyl-p-phenylene diamine hydrochloride solution) were placed on a piece of filter paper. A part of the colony of the bacterial isolate was collected using one end of sterile grease free glass slide and smeared across the filter paper impregnated with the oxidase reagent and observed for deep purple colour within 10 seconds.
Citrate test: The agar used in citrate test is Simmon’s Citrate Agar; it is used to test an organism ability to utilize citrate as a source of energy. The medium contain citrate as the sole carbon source and Inorganic Ammonium Salts (NH4HPO4) as the source of nitrogen. It was done by dissolving the agar and gently heat with mixing and boiling until it dissolved. A 5 ml was dispensed into each tube and autoclaved at 121°C for 15 min. It was cooled and slanted before the test organism was streaked with a light inoculum. It was then be incubated aerobically at 37°C for 5 days and examined. Those that changed from original colour (green) to blue or yellow were considered positive. While those that retained the green colour were considered negative. Un-inoculated control tubes were included then the results were then recorded [20].
Indole test: Some microbes are capable of hydrolyzing the amino acid tryptophan and one of the end products is indole. The latter reacts with 4-dimethyl amino benzyladehyde to form a dark red dye. Each of the bacterial isolates were cultured in sterile nutrient broth for 48h at 37°C. 2 ml of chloroform were added to the broth culture and mixed gently. About 2 ml of Kovac’s reagent were later added, shaken gently and allowed to stand for 20min. A red colour at the reagent layer indicates indole production [21]. The results were then recorded.
Sugar fermentation test: A situation whereby carbohydrates are utilized in the partial or total absence of oxygen is referred to as fermentation. But sugar is utilized in the presence of oxygen such reactions are known as oxidation. Sterilization of the basal medium was done using an autoclave at 121°C for 15min. Ten percent (10%) sterile solution of the test sugar (glucose, fructose, mannitol, dextrose and galactose) was added, inverted Durham tubes was put into each tube. Different isolates were inoculated into each test tube according to the labeling using a sterile inoculating loop. Un-inoculated tubes serve as controls. The results were examined daily for up to 7days in which methyl red indicator changed to yellow. A yellow coloration indicated growth and acid production. Also, the upper part of the Durham tubes was examined to detect any accumulated gas which indicated gas production [20,22] results were then recorded.
Motility test: A little immersion oil was placed round the edge of a cavity slide and then a loopful of the bacterial colony was transferred to the centre of a clean dry cover slip with a sterile inoculating lop. The cavity slide was inverted over the cover slip such that the culture drop was in the centre of the slide depression. The culture drop appeared hanging. This was examined immediately for motility under the oil immersion microscope [22].
Methyl red test: Using a Pasteur's pipette, 10 drops of methyl red pH indicator was added to each tube and the tube was swirled gently to mix the drops into the broth. Each tube was examined for color change. Bacteria that produce many acids from the breakdown of dextrose (glucose) in the MR-VP medium cause the pH to drop to 4.2. At this pH, methyl red becomes red, a red color represents a positive test. Bacteria that produce fewer acids from the breakdown of glucose drop at pH to 6.0. At this pH, methyl red is yellow and this represents a negative test [22].
Voges-prokauer test: This test was carried out by inoculating MR-VP medium and incubating at 37°C for 2 days. It was then tested with methyl red and then 0.6mL of alpha napthol sodium (about 15 drops) and 0.2mL of 40% KOH (about 10 drops) was added. It was shakes and examined for the red colour of a positive reaction after 15 minutes to 1hour. A positive reaction developed a red color after 15-60 min. Under alkaline conditions and in the presence of oxygen, acetyl-methyl-ethanol will be oxidized to diacetyl which reacts with creatine to give a red colour, creatine is present in peptone [23].
Antibiogram (antibiotic susceptibility test) of non-leguminous endophytic bacteria isolates from plant sample
The test was performed to determine the phenotypic resistant of the bacterial isolates to commonly used antibiotics. These tests were carried out following the Kirby-Bauer disc diffusion method of [23]. Inoculum from culture of bacteria isolates on nutrient agar slants were inoculated into test tubes containing sterilized nutrient broth and incubated at 37°C for 18h which serve as the stock for the test. Mueller-Hinton agar was prepared and sterilized, then dispensed into sterilized Petri dishes. The plates were allowed to cool for about 15min so as to allow it to gel and excess surface moisture to be absorbed. The inoculum was introduced into plates by streaking before applying the antibiotics impregnated discs. Two types of discs were used; Cephalosporin antibiotic discs (Oxoid); Cefuroxime (30 µg), Ceftazidime (30 µg), Cefoxitin (30 µg), Cefpodoxime (10 µg), Cefepime (30 µg) and Multi-test Predetermined commercial Gram negative and Gram positive discs which were applied to the surface of the well labeled inoculated agar plated aseptically using sterile forceps. The discs were then placed firmly by slightly pressing on the inoculated plates with the sterilized forceps to ensure complete contact with the agar. After 24h of incubation, each plates was examined, susceptibility to each antibiotics were indicated by a clear zone. The zone of inhibition were measured using a calibrated ruler was held on the back of the inverted petri plate and was recorded [23].
Fungi isolation from non-leguminous plant sample
Pour Plate method was used for inoculation, 0.5ml of dilution (107, 1010) each dilution was carefully inoculated into the centre of three different sterile Petri dishes, after which the sterilized prepared PDA media (Potato Dextrose agar) is poured aseptically into each Petri dish and mixed together with the inoculums by combination of to and fro and circular. Antibiotics (Chloramphenicol) were added to inhibit the growth of bacteria. The plates were then allowed to gel and then placed in a sterile incubator in inverted form. After 72 hours, the growth (colonies) became visible and due to morphological appearance, each colony was sub-cultured using PDA and antibiotics were also added to further inhibit the growth of bacteria [23].
Preliminary identification of fungal isolates from non-leguminous plant sample
The pure isolates were subjected to microscopic examination. Clean greased free slide was used for the identification. A drop of water was mounted in the center of the slide, then a small portion of the fungal mycelium was cut out with a sterile inoculating needle. The cut piece was put directly in the water droplet and tease out. A drop of Lactophenol blue cotton stain was put directly in the teased out mycelium. A cover slide was then placed over the teased portion and mounted on the microscope stage. The viewing was first done with the lower magnification (x10), then the higher magnification objective lens (x40). The nature of the mycelium, the types of fruiting body and the spore structure served as the criteria for the identification of the isolates. The isolates were identified and confirmed with the mycological Atlas and compendium of soil fungi [15].
Confirmatory molecular identification of non-leguminous endophytic bacteria and fungi isolates bacteria DNA extraction from non-guminous endophytic bacteria isolates
DNA was extracted using the protocol stated by Pawlowski K, et al. [1. Briefly, Single colonies grown on medium were transferred to 1.5 ml of liquid medium and cultures were grown on a shaker for 48 h at 28 ºC. After this period, cultures were centrifuged at 4600 g for 5 min. The resulting pellets were resuspended in 520 μl of TE buffer (10 mMTris-HCl, 1mM EDTA, pH 8.0). Fifteen microliters of 20% SDS and 3μl of Proteinase K (20 mg/ml) were then added. The mixture was incubated for 1 hour at 37ºC, then 100μl of 5 M NaCl and 80μL of a 10% CTAB solution in 0.7 M NaCl were added and votexed. The suspension was incubated for 10 min at 65ºC and kept on ice for 15 min. An equal volume of chloroform: isoamyl alcohol (24:1) was added, followed by incubation on ice for 5 min and centrifugation at 7200g for 20 min. The aqueous phase was then transferred to a new tube and isopropanol (1:0.6) was added and DNA precipitated at –20ºC for 16 h. DNA was collected by centrifugation at 13000 g for 10 min, washed with 500μl of 70% ethanol, air-dried at room temperature for approximately three hours and finally dissolved in 50 μl of TE buffer [24].
Molecular fungi DNA extraction from non-leguminous endophytic fungi isolates
Approximately 100 mg of fungi mycellia was grinded with Dellaporta extraction buffer (100 mMTrls pH 8, 51 ml EDTA pH 8, 500 mMNaCI, 10 mMmcrcaptoethanol) and DNA extracted as described briefly. Each sample was grinded in 1000µl of the buffer in a sterilized sample bags. Mix was collected in sterile eppendorf tube and 40 µl of 20% SDS was then added, this was followed by brief vortexing and incubated at 65°C for 10minutes. At room temperature, 160µl of 5 M potassium acetate was then added vortexed and centrifuged at 10000 g for 10 minutes. Supernatant where collected in another eppendorf tube and 400µl of cold iso propanol was added mixed gently and kept at -20°C for 60 minutes. Centrifugation was at 13000 g for 10minutes to precipitate the DNA after which supernatant was gently decanted and ensured that the pellet was not disturbed. DNA was then washed with 500µl of 70% ethanol by centrifuging at 10000g for 10 minutes. Ethanol was decanted and DNA air-dried at room temperature until no trace of ethanol was seen in the tube. Pellet was then re-suspended in 50µl of Tris EDTA buffer to preserve and suspend the DNA [25].
Bacteria polymerase chain reaction from non-leguminous endophytic bacteria isolates
PCR sequencing preparation cocktail consisted of 10 µl of 5x GoTaqcolourless reaction, 3µl of 25mM MgCl2, 1µl of 10 mM of dNTPs mix, 1µl of 10pmol each 27F 5’- AGA GTT TGA TCM TGG CTC AG-3’ and - 1525R, 5′-AAGGAGGTGATCCAGCC-3′ primers and 0.3units of Taq DNA polymerase (Promega, USA) made up to 42µl with sterile distilled water 8μl DNA template. PCR was carried out in a GeneAmp 9700 PCR System Thermalcycler (Applied Biosystem Inc., USA) with a Pcr profile consisting of an initial denaturation at 94°C for 5 min; followed by a 30 cycles consisting of 94°C for 30s, 50°C for 60s and 72°C for 1 minute 30 seconds; and a final termination at 72°C for 10mins. And chill at 4oC.GEL [26].
Fungi Polymerase Chain Reaction|(PCR) Analysis from non-leguminous endophytic fungi isolates
To use the ITS gene for characterization of fungi, ITS universal primer set which flank the ITS1, 5.8S and ITS2 region can be used; PCR sequencing preparation cocktail consisted of 10 µl of 5x GoTaqcolourless reaction, 3µl of 25mM MgCl2, 1µl of 10mM of dNTPs mix, 1µl of 10 pmol each ITS 1: 5’ TCC GTA GGT GAA CCT GCG G 3’and - ITS 4: 5’ TCC TCC GCT TAT TGA TAT GC 3’primers and 0.3units of Taq DNA polymerase (Promega, USA) made up to 42µl with sterile distilled water 8μl DNA template. PCR was carried out in a GeneAmp 9700 PCR System Thermalcycler (Applied Biosystem Inc., USA) with a PCR condition include a cycle of initial denaturation at 94°C for 5min, followed by 35cycles of each cycle comprised of 30secs denaturation at 94°C, 30secs annealing of primer at 55°C, 1.5 min extension at 72°C and a final extension for 7min at 72°C [22].
Bacteria Polymerase Chain Reaction|(PCR) from non-leguminous endophytic bacteria isolates
PCR sequencing preparation cocktail consisted of 10µl of 5x GoTaqcolourless reaction, 3µl of 25mM MgCl2, 1µl of 10mM of dNTPs mix, 1µl of 10 pmol each 27F 5’- AGA GTT TGA TCM TGG CTC AG-3’ and -1525R, 5′-AAGGAGGTGATCCAGCC-3′ primers and 0.3units of Taq DNA polymerase (Promega, USA) made up to 42µl with sterile distilled water 8μl DNA template. PCR was carried out in a GeneAmp 9700 PCR System Thermalcycler (Applied Biosystem Inc., USA) with a PCR profile consisting of an initial denaturation at 94°C for 5 min; followed by a 30 cycles consisting of 94°C for 30s, 50°C for 60s and 72°C for 1 minute 30 seconds; and a final termination at 72°C for 10mins. And chill at 4°C.GEL [27,28].
Fungi PCR analysis (Procedure)
To use the ITS gene for characterization of fungi, ITS universal primer set which flank the ITS1, 5.8S and ITS2 region can be used; PCR sequencing preparation cocktail consisted of 10 µl of 5x GoTaqcolourless reaction, 3µl of 25mM MgCl2, 1µl of 10mM of dNTPs mix, 1µl of 10 pmol each ITS 1:5’ TCC GTA GGT GAA CCT GCG G 3’and - ITS 4: 5’ TCC TCC GCT TAT TGA TAT GC 3’primers and 0.3units of Taq DNA polymerase (Promega, USA) made up to 42µl with sterile distilled water 8μl DNA template. PCR was carried out in a GeneAmp 9700 PCR System Thermalcycler (Applied Biosystem Inc., USA) with a PCR condition include a cycle of initial denaturation at 94°C for 5 min, followed by 35cycles of each cycle comprised of 30secs denaturation at 94°C, 30secs annealing of primer at 55°C, 1.5 min extension at 72°C and a final extension for 7min at 72°C [29].
Molecular integrity from non-leguminous endophytic bacteria isolates
The integrity of the amplified gene fragments was checked on a 1.5% Agarose gel ran to confirm amplification. The buffer (1XTAE buffer) was prepared and subsequently used to prepare 1.5% agarose gel. The suspension was boiled in a microwave for 5minutes. The molten agarose was allowed to cool to 60°C and stained with 3µl of 0.5g/ml Ethidium bromide (which absorbs invisible UV light and transmits the energy as visible orange light). A comb was inserted into the slots of the casting tray and the molten agarose was poured into the tray. The gel was allowed to solidify for 20minutes to form the wells. The 1XTAE buffer was poured into the gel tank to barely submerge the gel. Two microliter (2 l) of 10X blue gel loading dye (which gives colour and density to the samples to make it easy to load into the wells and monitor the progress of the gel) was added to 4µl of each PCR product and loaded into the wells after the 100bp DNA ladder was loaded into well 1. The gel was electrophoresed at 120V for 45 minutes visualized by ultraviolet trans-illumination and photographed. The sizes of the PCR products were estimated by comparison with the mobility of a 100bp molecular weight ladder that was ran alongside experimental samples in the gel [30].
Purification of amplified product from non-leguminous endophytic bacteria isolates
After gel integrity, the amplified fragments were ethanol purified in order to remove the PCR reagents. Briefly, 7.6 µl of Na acetate 3M and 240µl of 95% ethanol were added to each about 40µl PCR amplified product in a new sterile 1.5µl tube eppendorf, mix thoroughly by vortexing and keep at -20°C for at least 30min. Centrifugation for 10mins at 13000g and 4°C followed by removal of supernatant (invert tube on trash once) after which the pellet were washed by adding 150µl of 70% ethanol and mix then centrifuge for 15min at 7500g and 4°C. Again remove all supernatant (invert tube on trash) and invert tube on paper tissue and let it dry in the fume hood at room temperature for 10-15min. then resuspend with 20µl of sterile distilled water and kept in -20°C prior to sequencing. The purified fragment was checked on a 1.5% Agarose gel ran on a voltage of 110V for about 1hr as previous, to confirm the presence of the purified product and quantified using a nano drop of model 2000 from thermo scientific [31].
Molecular sequencing from non-leguminous endophytic bacteria isolates
The amplified fragments were sequenced using a Genetic Analyzer 3130xl sequencer from Applied Biosystems using manufacturers’ manual while the sequencing kit used was that of big dye terminator v3.1 cycle sequencing kit. Bio- Edit software and MEGA 6 were used for all genetic analysis [32].
Growth dynamic and death rate of isolates using ultra violet spectrophotometer
Growth dynamic refers to the rate at which cells of microorganism grow at a given time. This test was done to determine the rate of growth of the isolates as well as their killing time in due time. Colony was picked from the stocked culture slant and inoculated into nutrient broth which was incubated for 24hours at 37°C. A loopful of organism was picked from the broth culture into nutrient broth in three sets which are set A, B, and C respectively. Ultraviolet spectrophotometer was set at 480λ wavelength, warmed up for 15minutes and then the control was first read, the first was reading was taken at zero hour and it continues after every 12hours for 6times. At the 3rd reading, which is the 24th hour of set B, ciprofloxacin was added to determine up the rate of kill [32].
Results
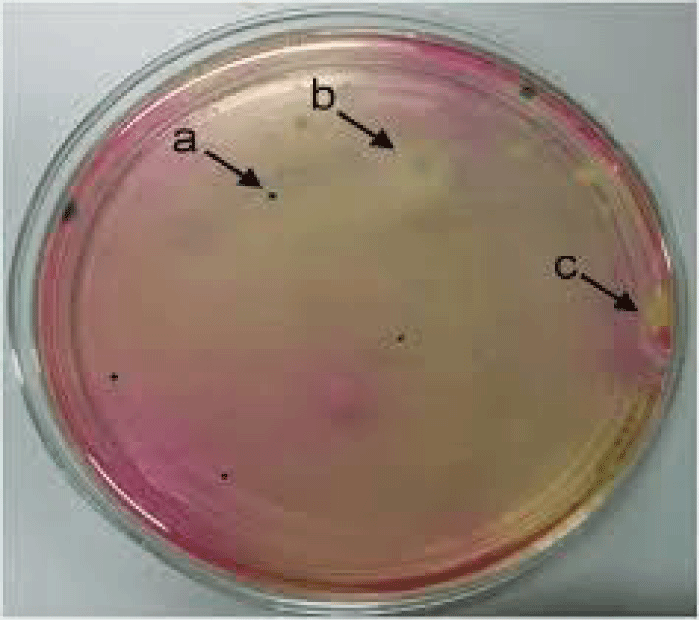
Three non-leguminous plant root samples were collected at School farm, Adekunle Ajasin University, Akungba Akoko, Ondo state. The organisms were isolated using both microscopic and macroscopic examination and preliminary isolation methods were used which was further subjected to preliminary biochemical test and the sugar fermentation of some simple sugars were carried out to identify the isolated organisms ,the growth and death rate were assayed using ultra violet spectrophotometer. Confirmatory identification of the isolated organisms were further carried out using Molecular sequencing which gives a distinct family and sub-species of the isolated organisms.
Table 1 shows the type of non-leguminous plant samples collected, the numbers of plant sample collected, place of collection and time of collection. In this table, the type of non-leguminous plant root and stem sample collected was helianthus annuus, Lycopersicum solanum, and Carica papaya, the number of sample collected was 6 and the samples were collected at the School farm, Adekunle Ajasin University, Akungba Akoko, at 2:30-3:00pm in the afternoon.
| Table 1: Sample collected, number of sample collected, place and time of collection. | |||
| Sample Collected | Number of Samples Collected | Place of Collection | Collection Time |
| SF-R | 1 | Aaua school farm | 2:30PM |
| T-R | 1 | Aaua school farm | 2:33PM |
| P-R | 1 | Aaua school farm | 2:35PM |
| SF-S | 1 | Aaua school farm | 2:40PM |
| T-R | 1 | Aaua school farm | 2:45PM |
| P-R | 1 | Aaua school farm | 3:00PM |
Table 2 shows the dilution factors of the non-leguminous plant root samples cultured and colony count of isolates cultured on nutrient agar showing bacterial growth. In this table, it was observed that 6 plates were isolated and each plate contains inoculums of serial dilution, the highest dilution factors are the 10-10 and the lowest dilution factor are the 10-7. SF-R 2, T-S 2, P-S 2 has the dilution factors of 10-10 and 20, 10, and 15 number of colonies respectively, while SF-R 1, T-R 1, P-R 1 have the lowest dilution factor of 10-7 and 25, 32, and 22 number of colonies respectively. The table shows that T-S 2 has the lowest number of colonies of 10 while P-R 1 has the highest number of colonies of 32 respectively.
| Table 2: Dilution factors and colony count of non-leguminous Endophytic bacteria and fungi cultures from plant root samples. | ||
| Isolates | Dilution Factor | No of Colonies |
| SF-R 1 | 10-7 | 25 |
| SF-S 2 | 10-10 | 20 |
| T-R 1 | 10-7 | 22 |
| T-S 2 | 10-10 | 10 |
| P-R 1 | 10-7 | 32 |
| P-S 2 | 10-10 | 15 |
Key: SF-R 1 = Sunflower root 1, SF-S 2 = Sunflower stem 2,T-R 1 = Tomato root 1,T-S 2= Tomato stem 2, P-R 1= Pawpaw root 1, P-S 2= Pawpaw stem 2.
Table 3 shows the dilution factors of the non-leguminous plant root samples cultured and colony count of isolates cultured on potato dextrose agar, showing the fungal growth. In this table, it was observed that 6 plates were isolated and each plate contains inoculums of serial dilution, the highest dilution factors are the 10-10 and the lowest dilution factor are the 10-7. SF-S 2, T-S 2, P-S 2 has the dilution factors of 10-10 and 11 , 15 and 17 number of colonies respectively, while SF-R 1, T-R 1, P-R 1 have the lowest dilution factor of 10-7 and 28, 24, and 28 number of colonies respectively. The table shows that SF-S 2 has the lowest number of colonies of 11 while SF-R 1 and P-R 1 has the highest number of colonies of 28 respectively
| Table 3: Dilution factors and colony count of isolates on fungal cultures from plant root samples. | ||
| Isolates | Dilution Factor | No of Colonies |
| SF-R 1 | 10-7 | 28 |
| SF-S 2 | 10-10 | 11 |
| T-R 1 | 10-7 | 24 |
| T-S 2 | 10-10 | 15 |
| P-R 1 | 10-7 | 28 |
| P-S 2 | 10-10 | 17 |
Table 4 shows the cultural characteristics of isolates, and the analysis of isolates cultured on nutrient and potato dextrose agar. In this table, it was observed that SF-R 1 and P-R 1b have the same cultural characteristics of raise creamy and smooth edges. T-R 1, P-S 2b and T-S 2 have the cultural characteristics of raise creamy and entire edges. SF-R 1b, SF-S 2, T-S 2b have cultural characteristics of low creamy and smooth edges while T-R 1b and P-R 1 have the same cultural characteristics of flat creamy and smooth edges and P-S 2 has low, milky and smooth edges. SF-S 2b has flat creamy and entire edges.
| Table 4: Cultural characteristics of isolates on NA and PDA agar of non-leguminous Endophytic bacteria isolates. | |
| Sample Code | Cultural Characteristics |
| SF-R 1 | Raise creamy, smooth edges |
| SF-R 1b | Low creamy, smooth edges |
| T-R 1 | Raise creamy, entire edges |
| T-R 1b | Flat creamy, smooth edges |
| P-R 1 | Flat creamy, smooth edges |
| P-R 1b | Raise creamy, smooth edges |
| SF-S 2 | Low creamy, smooth edges |
| SF-S 2b | Flat creamy, entire edges |
| T-S 2 | Raise creamy, entire edges |
| T-S 2b | Low creamy, smooth edges |
| P-S 2 | Low milky, smooth edges |
| P-S 2b | Raise creamy, entire edges |
Table 5 shows the sample code, morphological characteristics of isolates subcultured from the NA and PDA plates. In this table, it was observed that SF-R 1, P-R 1b, have the morphological characteristics of raise creamy, moderate, smooth and smooth edges, T-R 1, P-S 2b, T-S 2, have raise creamy, moderate, rough, dry and entire edges morphological characteristics. SF-R 1b, SF-S , T-S 2b have low, creamy, swarmy, smooth and smooth edges, T-R 1b, P-R1 have flat creamy, milky wet, dry, swarmy, moderate and smooth edges morphological characteristics, P-S 2 has low, milky, moderate, smooth and smooth edges, SF-S 2b has flat, creamy, rough, swarmy and entire edges morphological characteristics.
| Table 5: Sample code, morphological characteristics of subcultures of the non-leguminous Endophytic bacteria isolates. | |||||
| Sample Code | Surface | Colour | Elevation | Edge | Mode of Spread |
| SF-R 1 | Smooth | Creamy | Raise | Smooth | Moderate |
| SF-R 1b | Smooth | Creamy | Low | smooth | Swarm |
| T-R 1 | Rough | Creamy | Raise | entire | Moderate |
| T-R 1b | Wet | Creamy | Flat | smooth | Swarm |
| P-R 1 | Dry | Milky | Flat | waxy | Moderate |
| P-R1b | Rough | Creamy | Convex | Smooth | Moderate |
| SF-S 2 | Clear | Whitish cream | Low | Smooth | Swarm |
| SF-S 2b | Rough | Creamy | Flat | Entire | Swarm |
| T-S 2 | Dry | Creamy | Raise | entire | Moderate |
| T-S 2b | Rough | Milky | Low | Smooth | Swarm |
| P-S 2 | Smooth | Milky | Low | Smooth | Moderate |
| P-S 2b | Raise | Creamy | Raise | Entire | Moderate |
Key: SF-R 1 = Sunflower root1, SF-S 2 = Sunflower stem 2,T-R 1 = Tomato root 1,T-S 2= Tomato stem 2, P-R 1 = Pawpaw root 1, P-S 2 = Pawpaw stem.
Key: SF-R 1=Sunflower root 1, SF-R 1b = Sunflower root 1b, SF-S 2 = Sunflower stem 2 , SF-S 2b = Sunflower stem 2b, T-R 1 = Tomato root 1, T-R 1b = Tomato root 1b, T-S 2 =Tomato stem 2, T-S 2b = Tomato stem 2b ,P-R 1 = Pawpaw root 1, P-R 1b = Pawpaw root 1b, P-S 2 = Pawpaw stem 2, P-S 2b = Pawpaw stem 2.
Key: SF-R 1=Sunflower root 1, SF-R 1b=Sunflower root 1b, SF-S 2= Sunflower stem 2 , SF-S 2b= Sunflower stem 2b, T-R 1 = Tomato root 1, T-R 1b= Tomato root 1b, T-S 2=Tomato stem 2, T-S 2b= Tomato stem 2b ,P-R 1= Pawpaw root 1, P-R 1b= Pawpaw root 1b, P-S 2= Pawpaw stem 2, P-S 2b= Pawpaw stem 2.
Table 6 shows the result of Gram staining and the microscopic examination of the bacterial isolates. It was observed in this table that SF-R 1, SF-R 2, T-R, P-R are all positive to Gram staining, SF-R 1, SF-R 2,T-R, P-R are all short rods.
| Table 6: Gram stain and microscopic examination on the recovered Non–leguminous Endophytic bacteria isolates. | ||
| Isolates | Gram Stain | Shape |
| SF-R 1(spot A) | + | Short rods |
| SF-R 2(spot B) | + | Short rods |
| T-R | + | Short rods |
| P-R | + | Short rods |
Table 7 shows the preliminary biochemical tests carried on the recovered bacterial isolates, the tests include; motility, urease, indole, sugar fermentation, gas production and hydrogen sulphide tests. It was observed in this table that, SF-R 1(spot A) was positive to motility test while other isolates were negative to motility test. It was also observed that T-R was negative to indole test, while SF-R 1(spot A), SF-R 2(spot B) and P-R were positive to indole test. It was observed that SF-R 1(spot A), SF-R 2(spot B) were positive to urease test while, T-R and P-R were negative to urease test. Also, all the bacterial isolates were positive to sugar fermentation test. It was further observed that all bacterial isolates were positive to hydrogen sulphide test. It was observed that SF-R 1(spot A), SF-R 2(spot B) were negative to gas production test, while, P-R and T-R were positive to gas production test.
| Table 7: Preliminary biochemical tests carried on the recovered Non –leguminous Endophytic bacteria isolates. | ||||||||
| Isolates | Motility | Indole | Urease | Lactose | Sucrose | Dextrose | H2S | Gas production |
| SF-R Na 10-10 Spot A | + | + | + | + | + | + | + | - |
| SF-R Na10-10 Spot B | - | + | + | - | - | - | + | - |
| T-R Na 10-10 | - | - | - | - | - | - | + | + |
| P-R Na 10-10 | - | + | - | - | - | - | + | + |
Tables 8 & 9 shows the continuation of the biochemical tests such as the oxidase and identification of the isolated organisms. In this table, it was observed that SF-R 1(spot A) and T-R were negative to oxidase test, while SF-R 2(spot B) and P-R were positive to oxidase test. It was also observed that all bacterial isolates were positive to catalase test. It was also observed in this table that all the bacterial isolates were all positive to mannitol test. It was also observed that all bacterial isolates were all positive to maltose test, it was also observed that all bacterial isolates were all positive to glucose test. It was also observed that all bacterial isolates were all negative to methyl-red test. It was also observed that all bacterial isolates were negative to voges-prokauer test. It was also observed that all bacterial isolates were positive to citrate test. The isolated organisms include Bacillus cereus, Actinomycoses sp., Enterobacter sp., Aeromonas sp.
| Table 8: Preliminary biochemical tests carried on the bacterial isolates and identification of Non –leguminous Endophytic bacteria isolates using (biochemical tests). | ||||||||||||
| Isolates | Catalase | Oxidase | Mannitol | Maltose | Glucose | MR | VP | Citrate | Probable organism | |||
| SF | GAS | SF | GAS | SF | GAS | |||||||
| SF-R Na 10-10Spot A | + | - | + | - | + | + | + | - | - | - | + | Bacillus cereus |
| SF-R Na10-10Spot B | + | + | + | - | + | + | + | + | - | - | + | Actinomycoses spp |
| T-R Na 10-10 | + | - | + | + | + | + | + | - | - | - | + | Enterobacter spp |
| P-R Na 10-10 | + | + | + | - | + | + | + | + | - | - | + | Aeromonas spp |
| Table 9: NCBI Blast result showing the Non-leguminous Endophytic bacteria and fungi isolates. | |||||||
| Select for downloading or viewing reports | Scientific Name | Max Score | Total Score | Query Cover | E value | Per. Ident | Accession |
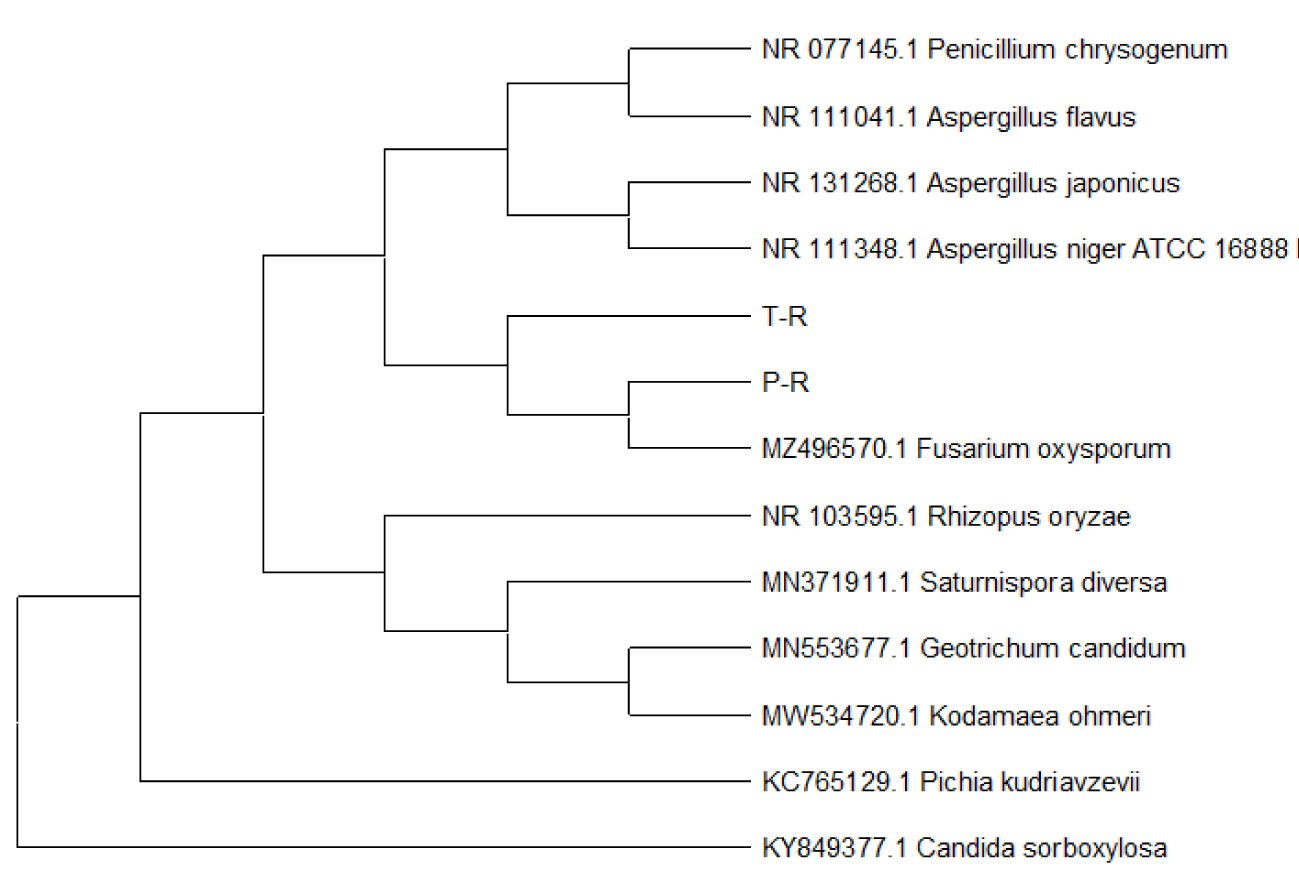
| T-R | Fusarium solani | 841 | 841 | 99% | 0 | 100.00% | OK054587 |
| P-R | Fusarium verticillium | 887 | 887 | 98% | 0 | 99.80% | OK054588 |
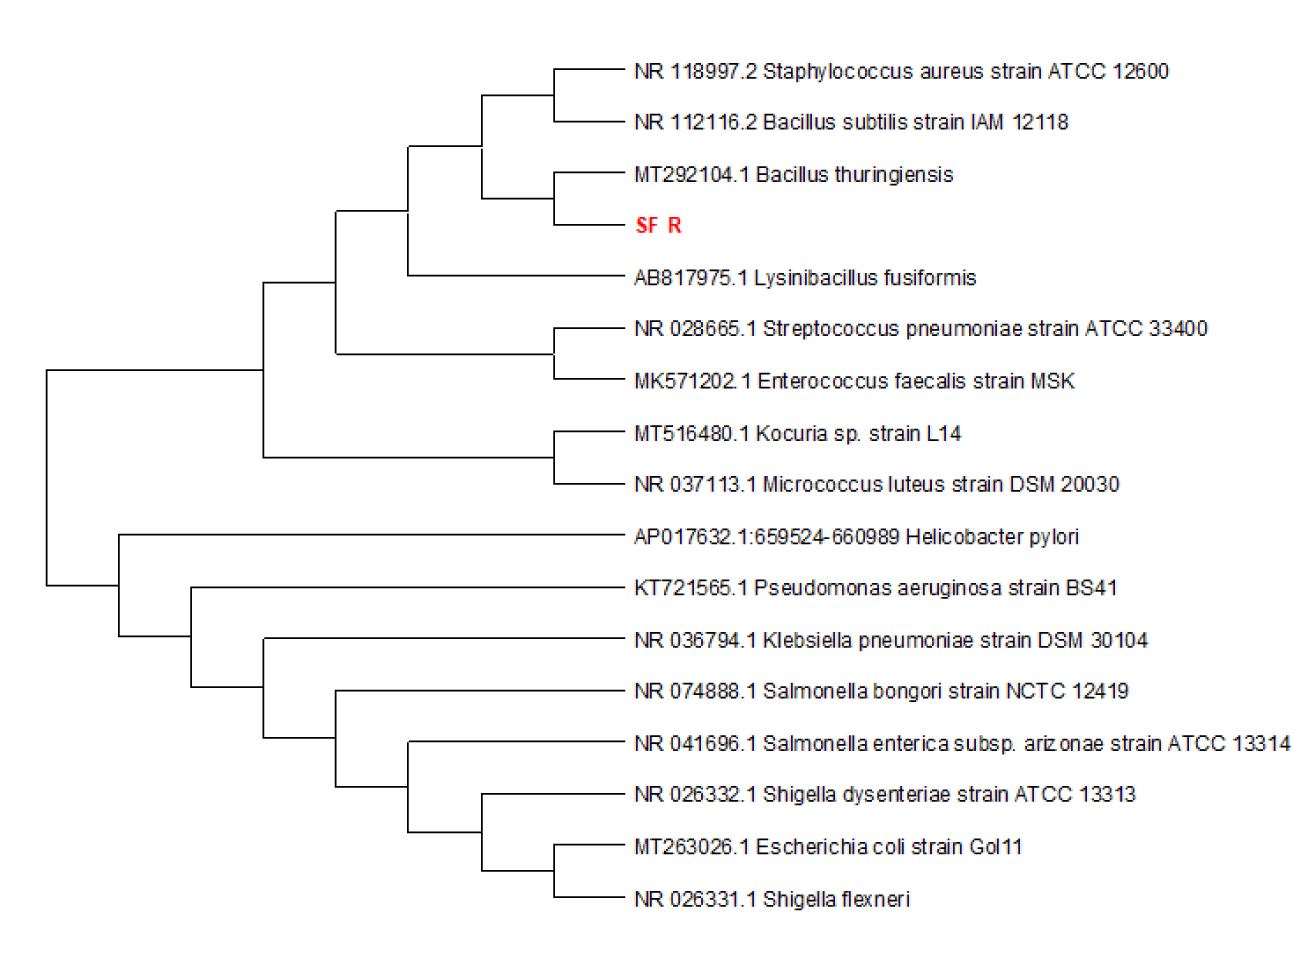
| SF-R | Bacillus thuringiensis | 2597 | 36307 | 100% | 0 | 99.79% | OK054549 |
Key: + (positive)
Key: SF-R (spot A) = Sunflower root (spot A), SF-R (spot B) = Sunflower root (spot B), T-R = Tomato root, P-R = Pawpaw root.
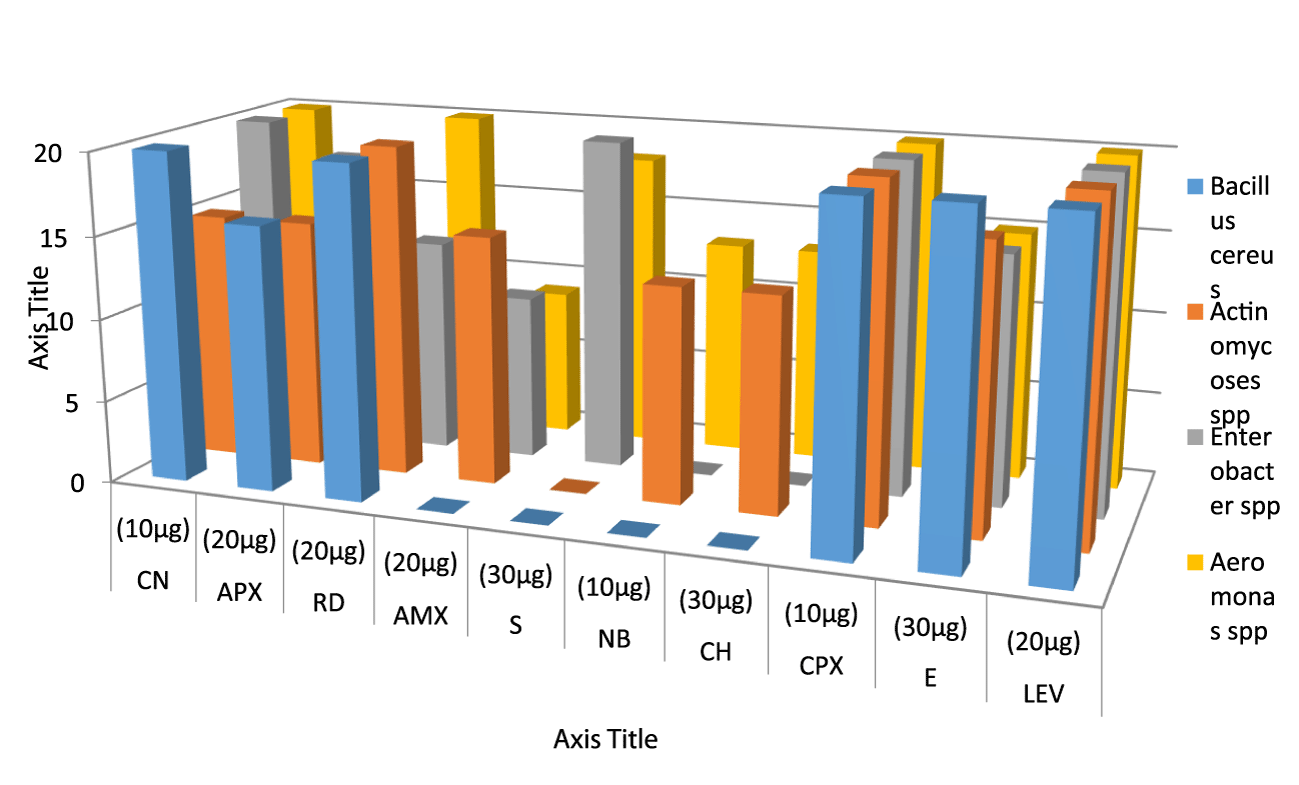
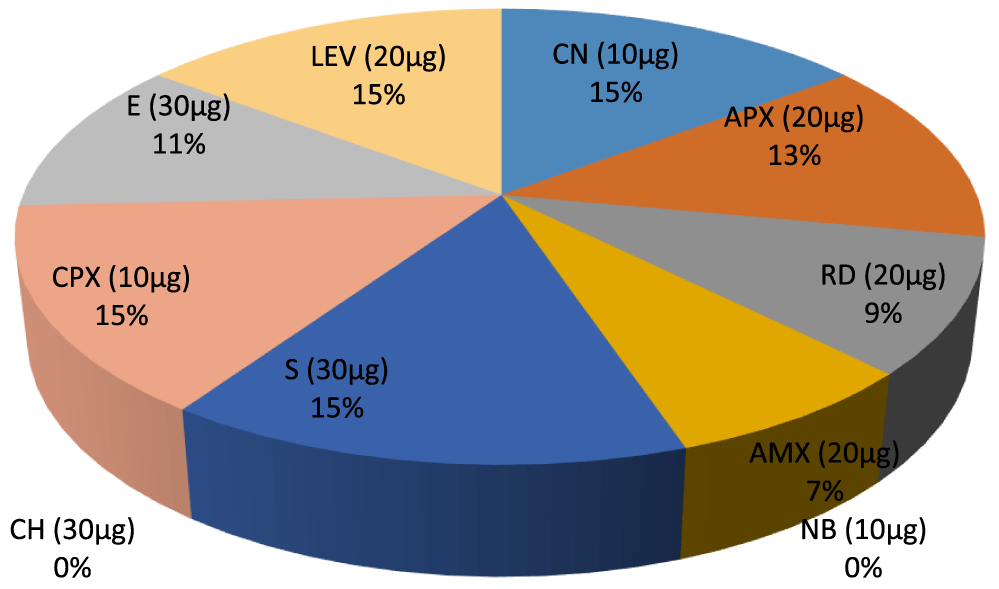
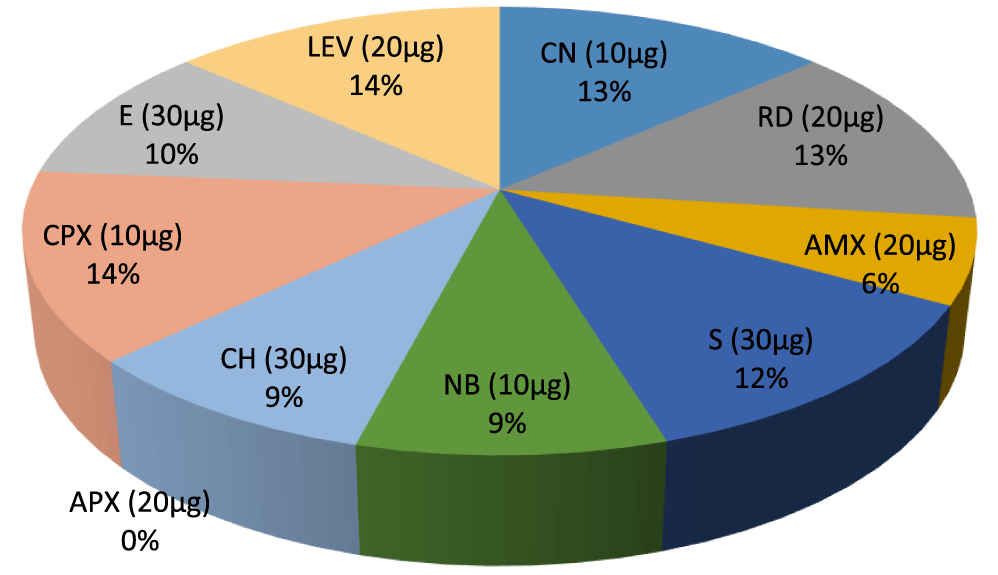
Figures 1 & 2 shows the antibiotic susceptibility test of the identified Gram positive organisms. It was observed that Enterobacter has the highest zone of inhibition to streptomycin (20mm), while, Bacillus cereus, Actinomycoses sp. has the lowest zone of inhibition to streptomycin (0mm). Bacillus cereus, Enterobacter sp. Aeromonas sp. have the highest zone of inhibition to gentamycin (20mm), while Actinomycoses sp have the lowest zone of inhibition to gentamycin (15mm). Bacillus cereus, Actinomycoses sp. and Aeromonas sp. has the highest zone of inhibition to rifampicin (20mm), while Enterobacter sp. has the lowest zone of inhibition to rifampicin (13mm). Actinomycoses sp. has the highest zone of inhibition to Amoxil (15mm), while Bacillus cereus has the lowest zone of inhibition to Amoxil (0mm), Actinomycoses sp. have the highest zone of inhibition to Norfloxacin (17mm), while Bacillus cereus, and Aeromonas sp. has the lowest zone of inhibition to Norfloxacin (0mm). Actinomycoses sp. and Aeromonas sp. has the highest zone of inhibition to chloramphenicol (13mm) while Bacillus cereus and Aeromonas sp has the lowest zone of inhibition to chloramphenicol (0mm). Bacillus cereus, Actinomycoses sp. Enterobacter sp. and Aeromonas sp. all have high zone of inhibition to ciprofloxacin and levofloxacin (20mm), Bacillus cereus has the highest zone of inhibition to Erythromycin (20mm) while Enterobacter sp. and Aeromonas sp. has the lowest zone of inhibition to erythromycin(15mm).
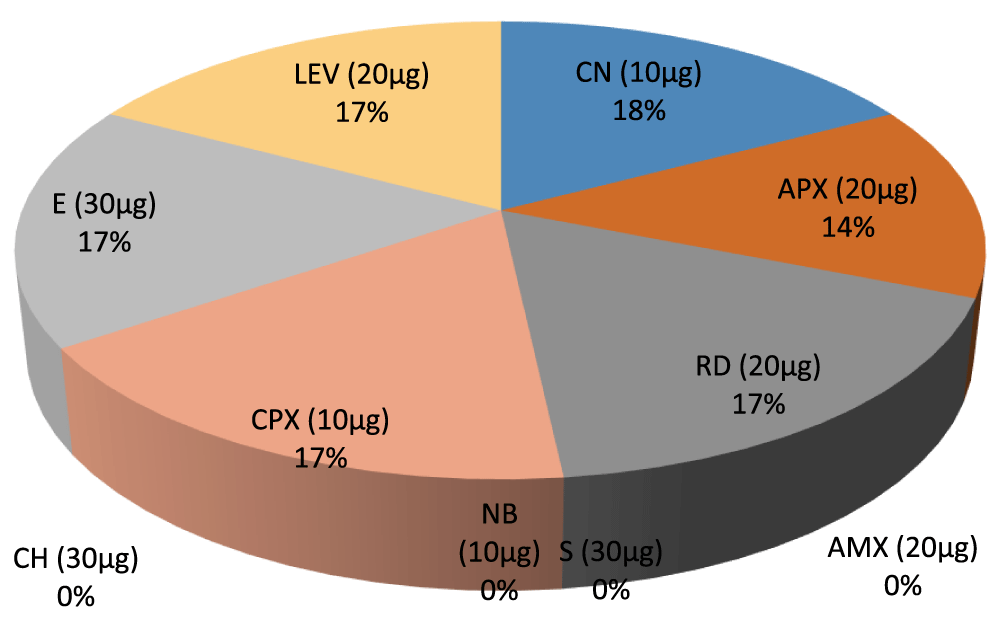
- Percentage inhibition ratio of Bacillus cereus against Gram positive Non –leguminous Endophytic bacteria isolates. E (30µg) 17%, LEV (20µg) 17%, CN (10µg) 18%. APX (20µg) 14%, RD (20µg) 17%, CPX (10µg) 17%
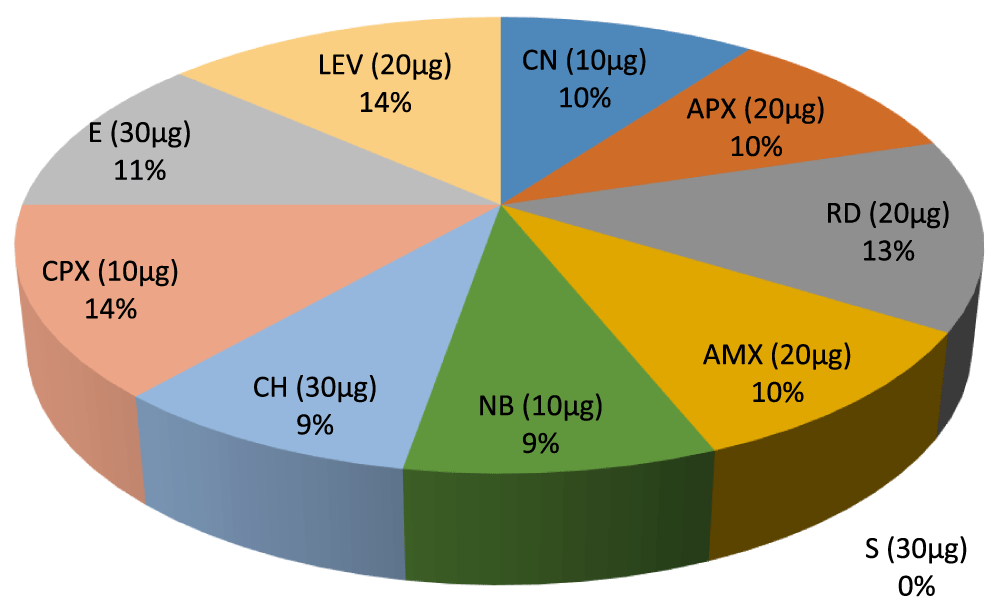
- Percentage inhibition ratio of Actinomycoses sp. against Gram positive Non –leguminous Endophytic bacteria isolates, E (30µg) 11%. CPX (10µg) 14%, CH (30µg) 9%, NB (10µg) 9%, AMX (20µg) 10%, RD (20µg) 13%. APX (20µg) 10%.CN (10µg) 10%, LEV (20µg) 14%.
- Percentage inhibition ratio of Enterobacter sp. against Gram positive Non –leguminous Endophytic bacteria isolates, E (30µg) 11%, CPX (10µg) 15%, S (30µg) 15%, RD (20µg) 9%, APX (20µg) 13%. CN (10µg)15%, LEV (20µg)15%
- Percentage inhibition ratio of Aeromonas sp. against Gram positive Non –leguminous Endophytic bacteria isolates, E (30µg) 10%. CPX (10µg) 14%, CH (30µg) 9%, NB (10µg) 9%, S (30µg) 12%. AMX (20µg) 6%. RD (20µg) 13%, CN (10µg) 13%. LEV (20µg) 14%.
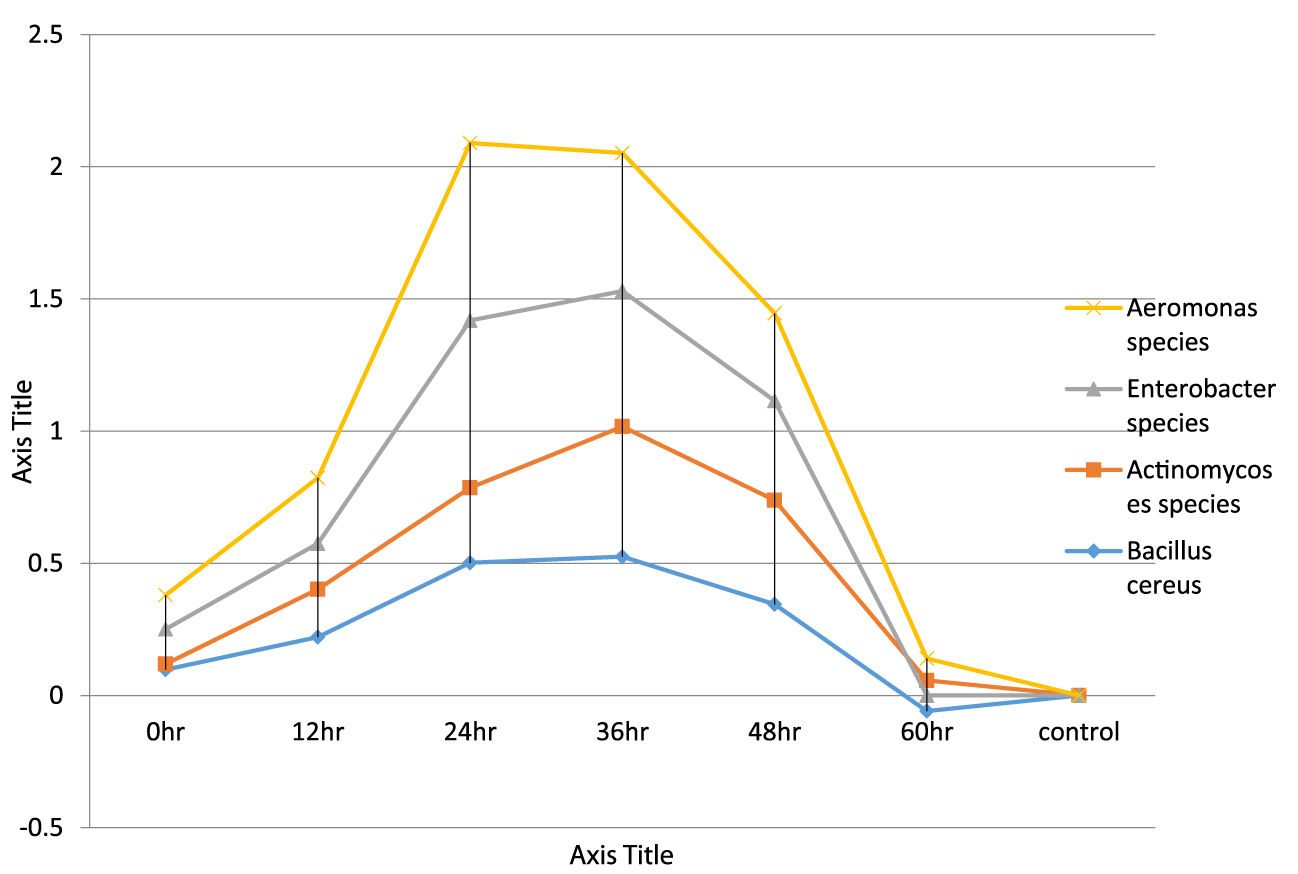
- Growth dynamic of bacteria isolates using ultraviolet spectrophotometer with the wavelength 480λ. It was observed that at 0hour, Enterobacter sp.has the highest growth rate of 0.132λ and Actinomycoses sp.have the lowest growth rate of 0.021λ. At 60th hour, Aeromonas sp has the lowest death rate of 0.140λ and Enterobacter sp have the highest death rate of -0.057λ
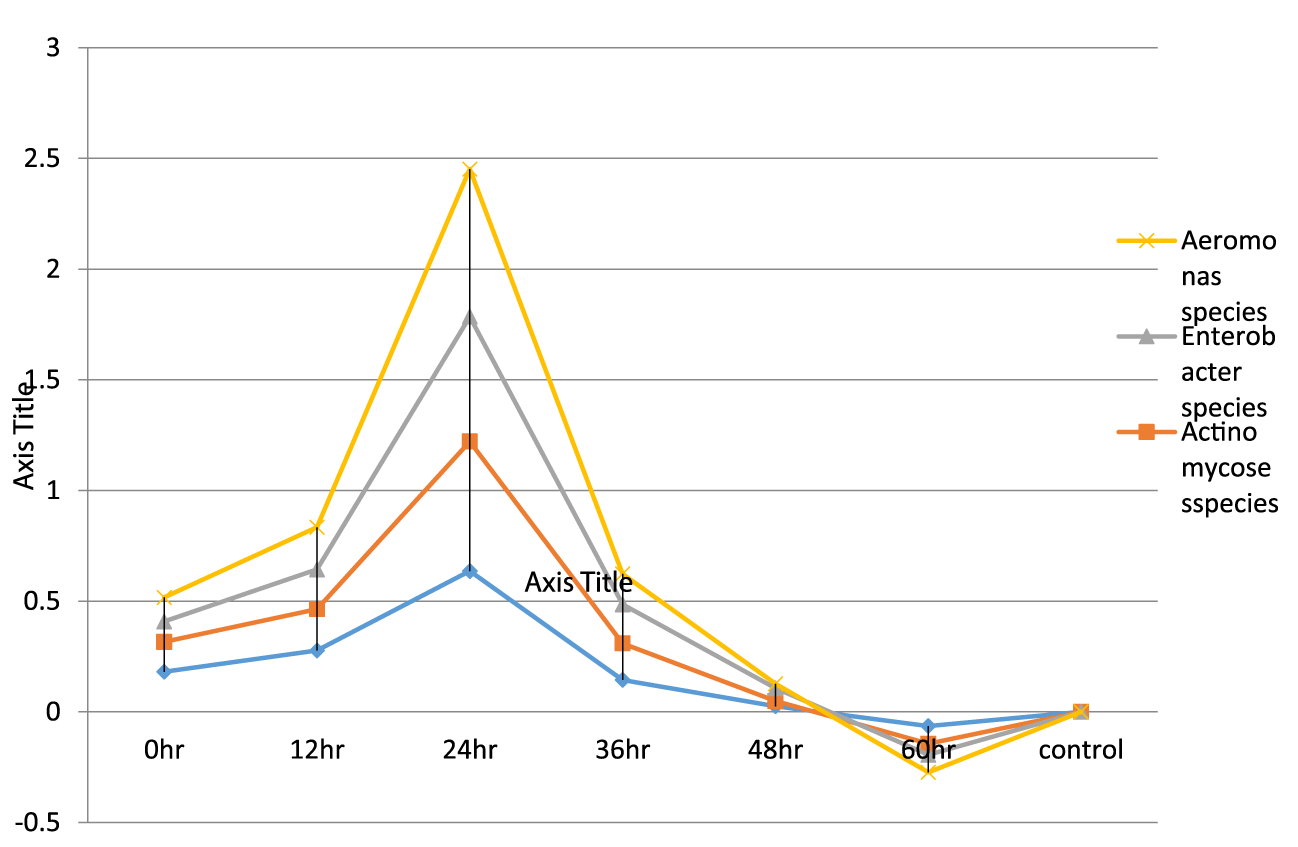
- Growth dynamic and killing time of bacteria isolates and addition of ciprofloxacin antibiotic at 24th hour using ultraviolet spectrophotometer. In this table, it was observed that at 0 hour, Bacillus cereus has the highest growth rate of 0.181λ and Enterobacter sp. have the lowest growth rate of 0.135λ. At the 60th hour, Actinomycoses sp.has the lowest death rate of -0.080λ and Enterobacter sp.have the highest death rate of -0.050λ
Key: S - Streptomycin, NB - Norflaxacin, CH- Chloramphenicol, CPX- Ciproflox, E- Erythromycin, LEV- Levofloxacin, CN- Gentamycin, APX- Ampiclox, RD- Rifampicin, AMX-Amoxil. ≥ 16 = Sensitive, ≤ 14 = Resistant 15 = Intermediate (Figures 1-13).
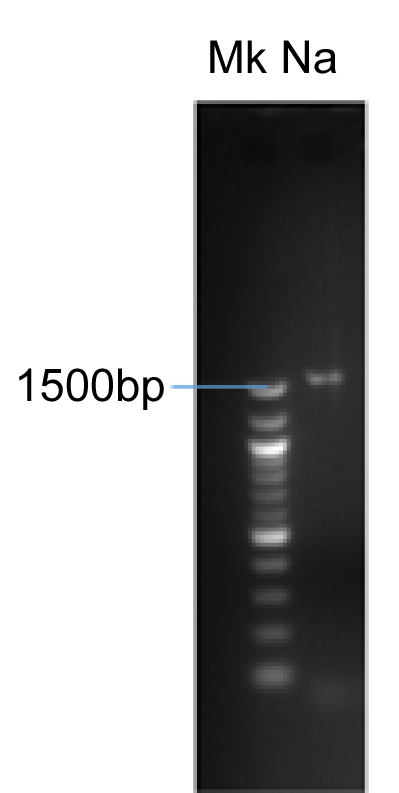
- Confirmatory molecular identification of non legunminous bacteria isolates from helianthus annuus(Sunflower) (Plate 1).
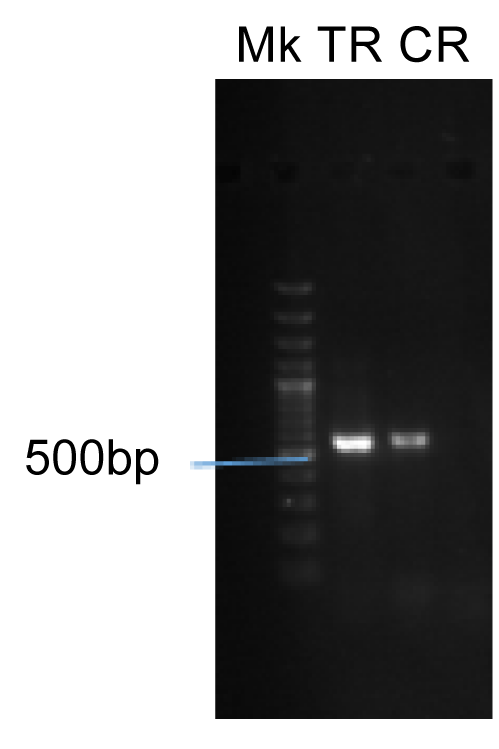
- Confirmatory molecular identification of non legunminous fungi isolates from Carica papaya and Lycopersicum solanum (Pawpaw and Tomato) (Plate 2).
Discussion
Plants are in continuous association with microbes which interact with them in positive, negative or neutral ways. Endophytes are microbial entities that colonize living plant tissues and most of them live in a relationship with their host plant as symbionts and mutualistic association. Many endophytes are capable of producing compounds that serve as defense chemicals against pathogenic microbes infecting the plants. Endophytes not only promote plant growth, but also contribute to yield of the crop, suppress pathogens, and help in bioremediation of contaminated soils and solubilization of phosphates and nitrogenous nutrients. The main objective of this study is to compare between the conventional and molecular method of isolation, identification and characterization of non-leguminous endophytic bacteria and fungi, from this study, Findings of this study revealed that colony count of isolates for bacterial culture from plant root samples reveals that Pawpaw Root sample (P-R 1) had highest count of colony of 32 at dilution factor 10-7 while the least bacterial colony count was observed in Tomato Stem (T-S 2). These shows that bacterial endophytes have been obtained from all the plant parts taken but maximum numbers were contributed by roots followed by stem and then leaves. This might be because generally the endophytes enter plant tissue primarily through roots where their population is higher and thereafter decreases acropetally [29]. These observations are well supported by the study of Posada and Vega [33] which states that bacteria generally colonize the intercellular spaces, and they have been isolated from all plant compartments including seeds. Likewise, the colony counts for fungal culture revealed that highest colony count was observed in Pawpaw Root (P-R 1) and Sun Flower root (SF-R 1) sample with count of 28 each (Tables 2 & 3).
This present study revealed the cultural characteristics of the isolates on nutrient and PDA agar. Isolates appears to either be raised creamy, low creamy or flat creamy. Also, most of the isolates are seen to have smooth edges as shown in table 4.
Morphological characteristics of isolates was studied base on surface, colour, elevation, edge and mode of spread, findings show that surface of the isolates either appear as dry, wet, smooth or rough while they also appear as either milky or creamy in colour. The angle of elevation is either raised or low while isolates has it mode of spread as moderate or swarm (Table 5). The conventional method of isolation, identification, and characterization employed during the course of this research work depletes that the biochemical test was also carried out for the characterization of the isolated bacterial culture from the various explants of the plant and to further identify the organism isolated according to the “Bergey’s Manual of the Determinative Bacteriology”. The isolated organism were identified to the Genus level. Findings revealed that all isolated endophytic bacterial were gram positive and appears to have short rods (Table 6). Further biochemical test were performed to further identify the organism isolated. Result shows that all isolates were non motile except for isolates from sunflower root (Spot A) which was motile. Most isolates were indole positive and also has the ability of utilizing one or two sugars as well as production of gas (Table 7). Further test such as catalase, oxidase mannitol, maltose, glucose, M.R, V.P test were all carried out and organism isolated include; Bacillus cereus, Actinomycoses sp., Enterobacter sp. and Aeromonas sp. This agrees to the work of [33-35] who in their study isolated endophytic bacteria such as Bacillus, Agrobacterium, Rhizobium, Pseudomonas, Mycobacterum, Enterobacter and Erwinia from legume tissue of plants.
Bacteria isolated was tested against various antibiotics such as Streptomycin, Norfloxacin, Chloramphenicol, Ciproflox, Erythromycin, Levofloxacin, Gentamycin, Ampiclox, Rifampicin, and Amoxil. Result shows that Levofloxacin, Erythromycin, Ciproflox and Gentamycin shows it susceptibility rate on all tested endophytic bacteria while all tested organisms were resistant to Norfloxacin, Chloramphenicol and Amoxil. Other tested antibiotics has intermediate, resistant or are susceptible to one or two isolates. All antibiotics used for this research has afrequency inhibiton potentials on the endophytes which is clearly stated in figures 2-8 in which Bacillus cereus has the highest percentage(18% with levofloxacin) [35]. The measurement of an exponential bacterial growth curve in batch culture was traditionally a part of the training of all microbiologists; the basic means requires bacterial enumeration (cell counting) by direct and individual (microscopic, flow cytometry) [35,36], direct and bulk (biomass), indirect and individual (colony counting), or indirect and bulk (most probable number, turbidity, nutrient uptake) methods. In the study, ultraviolet spectrophotometer is used to determine the lag phase, log phase or exponential phase, stationary phase, and death phase. And also, ultraviolet spectrophotometer was used to determine the death rate of the organisms with addition of antibiotics. During lag phase, bacteria adapt themselves to growth conditions. It is the period where the individual bacteria are maturing and not yet able to divide. During the lag phase of the bacterial growth cycle, synthesis of RNA, enzymes and other molecules occurs. During the lag phase cells change very little because the cells do not immediately reproduce in a new medium. This period of little to no cell division is called the lag phase and can last for hours. During this phase cells are not dormant (35) the log phase (sometimes called the logarithmic phase or the (exponential phase) is a period characterized by cell doubling. The number of new bacteria appearing per unit time is proportional to the present population. If growth is not limited, doubling will continue at a constant rate so both the number of cells and the rate of population increase doubles with each consecutive time period. At the exponential phase, ciprofloxacin was added to speed up the rate of death of the organisms. This helps us to understand that antibiotics can be used to control the death rate of the organisms, in the study, Growth dynamic of bacteria isolates using ultraviolet spectrophotometer shows that the highest growth of 0.132λ was observed in Enterobacter sp. while the least growth was observed in Actinomycoses sp. at 0.021λ. Likewise, at 60th hour, Aeromonas sp. has the lowest death rate of 0.140λ and Enterobacter sp. have the highest death rate of -0.057λ growth dynamic and killing time of bacteria isolates and the addition of ciprofloxacin antibiotic at 24th hour using ultraviolet spectrophotometer. At 0 hour, highest growth rate of 0.181λ was observed in Bacillus cereus, while the least growth rate was observed in Enterobacter sp. at 0.135λ. At the 60th hour, Actinomycoses sp. has the lowest death rate of -0.080λ and Enterobacter sp. have the highest death rate of -0.050λ.
The preliminary identification of the non-leguminous endophytic bacteria and fungi was further subjected to confirmatory identification at which the non-leguminous endophytic isolates were molecular sequenced. The complete chloroplast genome of helianthus annuus, Carica papaya and Lycopersicum solanum have an Expressed Sequence Tag (EST) databases for both helianthus annuus, Carica papaya and Lycopersicum solanum were downloaded from the compositae Genome Project Database(CGPDB). The complete set of coding sequences from the direct sequencing of the non-leguminous endophytic plant root samples were searched by BLAST respectively by EST database. Significant hits were examined and placed into author-defined categories. Through detailed sequence analyses of a representative set of 1 bacterial clones and 2 fungal clones, it was provided that the first report on the overall structural organization as well as sequence composition of helianthus annuus, Carica papaya and Lycopersicum solanum genome [36].
Fusarium solani Species Complex (FSSC) are capable of causing disease in many agriculturally important crops. The genomes of some of these fungi include supernumerary chromosomes that are dispensable and encode host-specific virulence factors. In addition to genomics, this review summarizes the known molecular mechanisms utilized by members of the FSSC in establishing disease, it was observed that some of the antibiotics used during this research work has tramendous activity on Fusarium solani [25].
Fusarium verticillium are soil-borne fungal pathogens that invade through the roots and disrupt water transport through the vascular tissues, Fusarium wilts are host-specific, whilst Verticillium wilts have wider host ranges • Symptoms include wilting, dieback and characteristic vascular staining and resting structures can contaminate soil or growing areas for long periods. The Spread may occur via movement of infected plants and cuttings. The use of disinfectants, will help to reduce the risk demonstrated with the use of antibiotic during the course of this research work. Verticillium and Fusarium species are soil-borne fungi that can survive for extended periods in the absence of a host plant by producing resilient resting structures.
B. thuringiensis is placed in the Bacillus cereus group which is variously defined as: seven closely related species: B. cereus sensu tricto (B. cereus), B. anthracis, B. thuringiensis, B. mycoides, B. pseudomycoides, and B. cytotoxicus B. thuringiensis also occurs naturally in the gut of caterpillars of various types of moths and butterflies, as well on leaf surfaces, aquatic environments, animal feces, insect-rich environments, and flour mills and grain-storage facilities.
The conventional method of identification and characterization of bacteria and fungi is a good method which are in use for a very long time and has been used by several researchers to characterized bacteria and fungi but it has a short coming due to the fact that humans expertise are needed to have a good result but with the advent of bio-informatics i.e, the molecular method, it is easy to identify and characterized bacteria and fungi to the sub-species level and the results is 100 percent correct. Therefore, the research has x-rayed the antimicrobial spectrum, growth/ killing kinetics of non-leguminous endophytic bacteria and fungi from helianthus annuus, Carica papaya and lycoperesicum solanum. It has enabled us to identify and characterized bacteria and fungi to the sub molecular level. It should be advised that the molecular method should be used in the identification and characterization of bacteria and fungi [36,37].
Conclusion
Microbial endophytes could be employed to improve plant health and enhance productivity directly in commercial crop plants. Thus, the isolated non-leguminous endophytes could help reduce pathogens due to it antimicrobial activity as well as increasing crop productivity without harming the health of agricultural soils nor compromising food quality with agrochemicals. The current efforts to find microbial crop stimulants is a beginning that may lead to a significant reduction in chemical applications in crop production. Non-leguminous Endophytes could help cultivate crops with less fertilizers, fungicides, insecticides.
Recommendation
From the study and research observed from the comparative study between the conventional and molecular assay of isolation, identification and characterization of non-leguminous endophytic bacteria and fungi, I thereby recommend that the molecular assay of identification and characterization of either the bacteria or fungi, should be encouraged in modern day applications to research work to give a standardized and 100 percent correct identification to the sub-species level.
Acknowledgement
The laboratory staff of Adekunle Ajasin University, Department of Microbiology, Faculty of Science, Akungba Akoko, Ondo State, Nigeria.
References
- Pawlowski K, Twigg P, Dobritsa S, Guan C, Mullin BC. A nodule-specific gene family from Alnus glutinosa encodes glycine- and histidine-rich proteins expressed in the early stages of actinorhizal nodule development. Mol Plant Microbe Interact. 1997 Jul;10(5):656-64. doi: 10.1094/MPMI.1997.10.5.656. PMID: 9204569.
- Behie SW, Zelisko PM, Bidochka MJ. Endophytic insect-parasitic fungi translocate nitrogen directly from insects to plants. Science. 2012 Jun 22;336(6088):1576-7. doi: 10.1126/science.1222289. PMID: 22723421.
- Faisal M Anis M. Rapid in vitro propagation of Rauvolfia tetraphylla L.-an endangered medicinal plant Physiol. Mol Biol Plants. 2002;8:295-299. https://tinyurl.com/x45ta69w
- Salgueiro MJ, Zubillaga M, Lysionek A, Sarabia MI, Caro R, De Paoli T, Hager A, Weill Eng R, Bioch JB. Zinc as an essential micronutrient. A review Nutr Res. 2000;20:737-755. doi: 10.1016/S0271-5317(00)00163-9
- Agrios G. Plant Pathology. 5th Ed, Elsevier Academic Press, Amsterdam. 2005;26:398-401. https://tinyurl.com/f9s3bvya
- Freeman A, Franciscovich A, Bowers M, Sandstrom DJ, Sanyal S. NFAT regulates pre-synaptic development and activity-dependent plasticity in Drosophila. Mol Cell Neurosci. 2011 Feb;46(2):535-47. doi: 10.1016/j.mcn.2010.12.010. Epub 2010 Dec 24. PMID: 21185939; PMCID: PMC3030698.
- Lemma W, Bizuneh A, Tekie H, Belay H, Wondimu H, Kassahun A, Shiferaw W, Balkew M, Abassi I, Baneth G, Hailu A. Preliminary study on investigation of zoonotic visceral leishmaniasis in endemic foci of Ethiopia by detecting Leishmania infections in rodents. Asian Pac J Trop Med. 2017 Apr;10(4):418-422. doi: 10.1016/j.apjtm.2017.03.018. Epub 2017 Apr 6. PMID: 28552113.
- Guo ZT, Peng SZ, Hao QZ, Biscay PE, Liu TS. Origin of the miocene-pliocene red-earth formation at Xifeng in northern China and implications for paleoenvironments. Palaeogeogr. Palaeoclimatol. Palaeoecol. 2001;170:11-26. doi: 10.1016/S0031-0182(01)00235-8
- Knapp AK, Smith MD. Variation among biomes in temporal dynamics of aboveground primary production. Science. 2001 Jan 19;291(5503):481-4. doi: 10.1126/science.291.5503.481. PMID: 11161201.
- Deshmukh S, Hückelhoven R, Schäfer P, Imani J, Sharma M, Weiss M, Waller F, Kogel KH. The root endophytic fungus Piriformospora indica requires host cell death for proliferation during mutualistic symbiosis with barley. Proc Natl Acad Sci U S A. 2006 Dec 5;103(49):18450-7. doi: 10.1073/pnas.0605697103. Epub 2006 Nov 20. PMID: 17116870; PMCID: PMC1697795.
- Jumpponen A. Spatial distribution of discrete RAPD phenotypes of a root endophytic fungus, Phialocephala fortinii, at a primary successional site on a glacier forefront. New Phytol. 1999 Feb;141(2):333-344. doi: 10.1046/j.1469-8137.1999.00344.x. PMID: 33862922.
- Amusa NA, Baiyewu AR. Storage and market diseases of yam tubers in South-Western Nigeria, Ogun state. Journal of Agricultural Research. 2003;11:211-255. https://tinyurl.com/ave9ec45
- Badillo VM. Carica L vs Vasconcella St. Hil. (Caricaceae) con la rehabilitacio´n de este u´ltimo. Ernstia. 10: 74-79.
- Emeruwa AC. Antibacterial substance from Carica papaya fruit extract. J Nat Prod. 1982 Mar-Apr;45(2):123-7. doi: 10.1021/np50020a002. PMID: 7097295.
- Osuntokun OT, Bankole OM, Abike TO, Joy OE, Adenike AF. Systematic comparative study of selected antibiotics and sulphur/ medicinal plant mediated nano-particles against non-leguminous endophytic bacteria and clinical isolates. Journal of Applied Life Sciences International. 2020;23:43-56. doi:10.9734/jalsi/2020/v23i1030192
- Schulz B, Wanke U, Draeger S, Aust HJ. Endophytes from herbaceous plants and shrubs: Effectiveness of surface sterilization methods. Mycological Research. 1993;97:1447-1450. doi:10.1016/S0953-7562(09)80215-3
- Osuntokun OT, Fasusi OA, Ogunmodede AF, Thonda AO, Oladejo BO, Yusuf Babatunde AM, Ige OO. Phytochemical Composition and Antimicrobial Activity of Daniella oliveri Extracts on Selected Clinical Microorganisms. International Journal of Biochemistry Research & Review. 2016;14:1-13, doi: 10.9734/IJBCRR/2016/28764
- Olutiola PO, Famurewa O, Sonntang HG. An Introduction to microbiology, practical Approach. Tertiary Text Book Series. 2000;45. doi: 10.12691/ajmr-6-1-4
- Bergey DH, Holt JG, Noel RK. Bergey's Manual of Systematic Bacteriology, 19th Ed. 1994. https://tinyurl.com/3xz4k3ec
- Cappuccino JG, Sherman N. Microbiology: A laboratory manual. Pearson Education Incorporated. 2002. https://tinyurl.com/7bww4nf5
- MacFaddin JF. Biochemical tests for identification of medical bacteria. 3rd Ed, 2000. https://tinyurl.com/7xvfypmu
- Fawole MO, Oso. 2007.BA, ISSN 1597-6343 Published by Faculty of Science.
- Wayne PA. Clinical and laboratory standards institute; Methods for dilution antimicrobial susceptibility testing for bacteria that grew aerobically. 2009;M7-A10 https://tinyurl.com/yuhn6pk6
- Olsvik O, Wahlberg J, Petterson B, Uhlén M, Popovic T, Wachsmuth IK, Fields PI. Use of automated sequencing of polymerase chain reaction-generated amplicons to identify three types of cholera toxin subunit B in Vibrio cholerae O1 strains. J Clin Microbiol. 1993 Jan;31(1):22-5. doi: 10.1128/jcm.31.1.22-25.1993. PMID: 7678018; PMCID: PMC262614.
- Pettersson E, Lundeberg J, Ahmadian A. Generations of sequencing technologies. Genomics. 2009 Feb;93(2):105-11. doi: 10.1016/j.ygeno.2008.10.003. Epub 2008 Nov 21. PMID: 18992322.
- Callaway E. Million-year-old mammoth genomes shatter record for oldest ancient DNA-Permafrost-preserved teeth, up to 1.6 million years old, identify a new kind of mammoth in Siberia. Natur. 2021;590:537-538 https://tinyurl.com/m5wv35au
- Duhaime MB, Deng L, Poulos BT, Sullivan MB. Towards quantitative metagenomics of wild viruses and other ultra-low concentration DNA samples: A rigorous assessment and optimization of the linker amplification method. Environ Microbiol. 2012 Sep;14(9):2526-37. doi: 10.1111/j.1462-2920.2012.02791.x. Epub 2012 Jun 20. PMID: 22713159; PMCID: PMC3466414.
- Williams R, Peisajovich SG, Miller OJ, Magdassi S, Tawfik DS, Griffiths AD. Amplification of complex gene libraries by emulsion PCR. Nat Methods. 2006 Jul;3(7):545-50. doi: 10.1038/nmeth896. PMID: 16791213.
- Goodwin S, McPherson JD, McCombie WR. Coming of age: ten years of next-generation sequencing technologies. Nat Rev Genet. 2016 May 17;17(6):333-51. doi: 10.1038/nrg.2016.49. PMID: 27184599.
- Grada A, Weinbrecht K. Next-generation sequencing: methodology and application. J Invest Dermatol. 2013 Aug;133(8):e11. doi: 10.1038/jid.2013.248. PMID: 23856935.
- Quail MA, Smith M, Coupland P, Otto TD, Harris SR, Connor TR, Bertoni A, Swerdlow HP, Gu Y. A tale of three next generation sequencing platforms: comparison of Ion Torrent, Pacific Biosciences and Illumina MiSeq sequencers. BMC Genomics. 2012 Jul 24;13:341. doi: 10.1186/1471-2164-13-341. PMID: 22827831; PMCID: PMC3431227.
- Osuntokun OT, Ibukun AF, Yusuf-Babatunde AM, Abiodun S. Pre/post-plasmid profile analysis, killing- kinetics and secondary metabolites screening of Adenopus breviflorus (Benth) fruit extract against Multiple Drug Resistant Isolates Using Staphylococcus aureus (MDRSA) as a case study. J Adv Res Biotech. 2019;4:1-17. https://tinyurl.com/2nfm4aw
- Posada F, Vega FE. Establishment of the fungal entomopathogen Beauveria bassiana (Ascomycota: Hypocreales) as an endophyte in cocoa seedlings (Theobroma cacao). Mycologia. 2005 Nov-Dec;97(6):1195-200. doi: 10.3852/mycologia.97.6.1195. PMID: 16722213.
- Lei X, Wang ET, Chen WF, Sui XH, Chen WX. Diverse bacteria isolated from root nodules of wild Vicia species grown in temperate region of China. Arch Microbiol. 2008 Dec;190(6):657-71. doi: 10.1007/s00203-008-0418-y. Epub 2008 Aug 15. PMID: 18704366.
- Muresu R, Polone E, Sulas L, Baldan B, Tondello A, Delogu G, Cappuccinelli P, Alberghini S, Benhizia Y, Benhizia H, Benguedouar A, Mori B, Calamassi R, Dazzo FB, Squartini A. Coexistence of predominantly nonculturable rhizobia with diverse, endophytic bacterial taxa within nodules of wild legumes. FEMS Microbiol Ecol. 2008 Mar;63(3):383-400. doi: 10.1111/j.1574-6941.2007.00424.x. Epub 2008 Jan 9. PMID: 18194345.
- Skarstad K, Steen HB, Boye E. Cell cycle parameters of slowly growing Escherichia coli B/r studied by flow cytometry. J Bacteriol. 1983 May;154(2):656-62. doi: 10.1128/jb.154.2.656-662.1983. PMID: 6341358; PMCID: PMC217513.
- Morey M, Fernández-Marmiesse A, Castiñeiras D, Fraga JM, Couce ML, Cocho JA. A glimpse into past, present, and future DNA sequencing. Mol Genet Metab. 2013 Sep-Oct;110(1-2):3-24. doi: 10.1016/j.ymgme.2013.04.024. Epub 2013 May 11. Erratum in: Mol Genet Metab. 2015 Mar;114(3):484. PMID: 23742747.
Content Alerts
SignUp to our
Content alerts.
 This work is licensed under a Creative Commons Attribution 4.0 International License.


