Medicine Group . 2022 October 25;3(10):1233-1239. doi: 10.37871/jbres1583.
Feasibility of the Skin Electrodynamic Introscopy to Assess 2D Acid-Base Balance Dynamics
Yuri F Babich1,2*, Efim M Roytman2 and Andrey Y Babich2
2Center of the Skin Electrodynamic Introscopy, Kyiv, Ukraine
- Synchronization
- Skin
- pH imaging
- Acid-base balance
- Quorum sensing
- Yeast
- Electrical impedance
- Cancer
Abstract
Synchronization is a universal phenomenon that occurs at all levels of the existence of living and inanimate matter. Shortly after enabling monitoring of the electrical impedance landscape of the skin, such phenomena were detected as dynamic clusters with in-phase and anti-phase dynamics. The behavior of these clusters turned out to be very sensitive to various endogenous and exogenous factors and was especially pronounced, for example, at the melanoma areas. Hypothesis of the acid-base balance fluctuations have been put forward as one of the most likely mechanisms for this phenomenon, since hydrogen ions are one of the main factors that determine tissue electrical conductivity. The purpose of this study was to obtain experimental evidence for this hypothesis. The 2D dynamics of glycolysis metabolism was studied on a yeast model as an adequate model of cancer cells. The image sequences reflected the dynamics of processes occurring at the intercellular and intracellular levels, in the form of current values of the 2D active and capacitive components of the impedance in the range of 2 kHz and 1 MHz. As a test factor, a single drop of glucose was used. The revealed effects of clusterization were found similar to those obtained earlier in human experiments. Specifically, these effects were also clearly manifested in the affected region. At the same time, the intercellular medium turned out to be the most rapidly responsive, while the intracellular response occurred with a significant delay but without so marked manifestations of anti-phase behavior. The observed effects are presumably a macroscopic manifestations of quorum sensing mechanisms and cooperative wave processes. We believe that the developed technology can be used as an inexpensive and non-invasive tool for both In vivo and In vitro real-time pH monitoring.
Introduction
The main mechanism of tissue and cellular metabolism is glycolysis, the spatiotemporal dynamics of which can, in certain cases, acquire a cooperative character in cellular ensembles, and, in turn, cause a coherent response of other metabolites. Unlike normal cells, glycolysis in tumor cells is disturbed towards greater acidity (Warburg effect) and resistance to therapeutic factors. In addition, such anaerobic glycolysis leads to increased production of various metabolites used further by proliferating cells. Accordingly, the development of methods for visualization and, especially, real-time monitoring of the pH-landscape in living tissue would be of obvious interest both for fundamental research and for the purposes of early diagnosis and targeted intervention.
It is beyond the scope of this paper to review the many modern non-electrical methods of pH metering, including visual pH sensors, which include, for example, molecular synthetic organic sensors, metal organic frameworks, engineered sensing nanomaterials, and bioengineered sensors [1].
Here we intend to present only preliminary results on the possibilities of the Skin Electrodynamic Introscopy (SEI) method, which belongs to the field of electrical spectral impedancemetry, which can be used for the above purposes both at the cellular and tissue levels, including the objects of practical medicine.
Methods of electrical and electrochemical spectral impedancemetry have been greatly developed over the past decades and are used for characterization of living matter both at the tissue and cellular level. The description of the principles and various applications is well presented in numerous academic and popular publications [2-8]. The state of the art of modern pH electrometry is mainly represented by potentiometry methods, of which, the technology of ion-sensitive field-effect transistors should be mentioned. However, in all cases, the practical limitations of such absolute measurements are mainly due to the need for a reference electrode. It should also be noted that there are known limitations in the speed of measurement inherent in all bridge methods. Therefore, the use of this method in medicine is limited to liquid (including monocellular and molecular) measurements, but is not suitable for studying the acid-base features of the sub-epidermal layers and other soft tissues. On the other hand, the methods of general/tissue Electrical Impedance Spectroscopy (EIS) allow characterization of these tissues in a variety of different parameters, but are not ion-selective and thus not suitable for the pH-measurement. Here it is also appropriate to note that the known approaches to measuring the electrical impedance of the skin still face the problem of adequately visualizing the Skin Electroimpedance Landscape (SEL) and, moreover, its dynamics, i.e.: due to the need to simultaneously ensure three conditions at once: high spatial and temporal resolution over a large enough area of view.
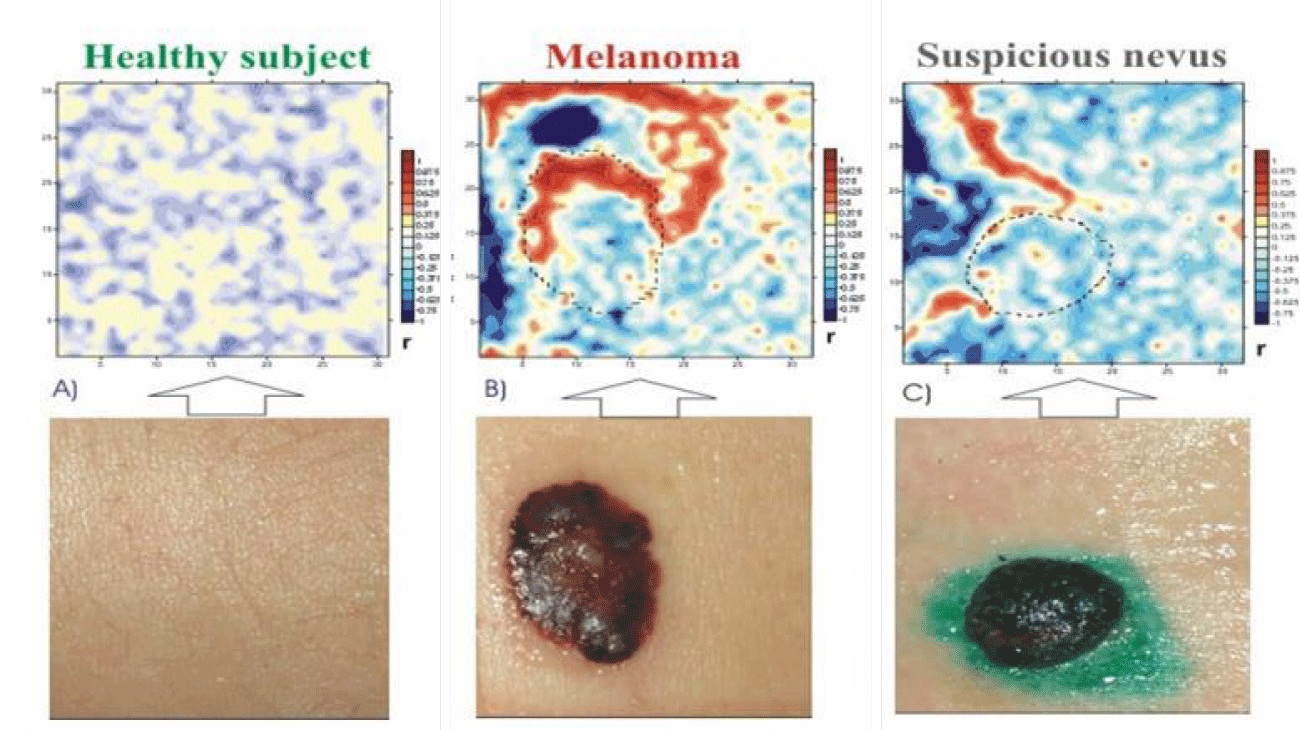
Our pioneering research on the SEL imaging began in the late 80s with developing an early SEI sample using which, for the first time in the world, adequate images of the SEL were obtained, first in statics, and then in dynamics. In later pre-clinical trials, a number of basically new spatiotemporal phenomena like the SEL structuring have been registered in health and disease [9-11]. The magnitude and kinetics of the structures/clusters turned out to be very sensitive to detect the influence of various internal and external factors. Taking into account the fact that under each microelectrode of the scanner there are not one, but many thousands of cells, the most intriguing was their coherent initial and the more so test-induced dynamics, which manifested itself in difference images in the form of in-phase and anti-phase clusters, or, in other words, unidirectional or multidirectional changes in the electrical parameters of neighboring and/or remote areas of the SEL. Such in-phase and out-of-phase activity was especially pronounced in the area of malignancy (melanoma) in response to even weak testing factors like magnetic fields, microwave radiation and transient hypoxia [10] (Figure 1).
A number of hypotheses about the possible biophysical and, biochemical mechanisms of these electrical impedance phenomena have been put forward [11]. The purpose of this study was to experimentally test the most likely cause, namely, variations in the acid-base balance of the skin.
Culture of yeast cells was chosen as an ideal model system to study synchronization and propagation waves of glycolytic oscillations in large populations [12].
Materials and Methods
Preliminary test
The scanning area was divided into 3 sections by 2 strips of adhesive tape (in order to mark strips with no testing at all). A pad of several layers of medical bandage (as a skin model) moistened with a neutral solution of pH =7.6 was applied over the entire surface. On the top of the pads, a counter-electrode from stainless steel was placed. After 10 frames of preliminary scan, 0.4 ml of an acid and alkali solution with pH 5.5 and 9.8, respectively (i.e., with approximately the same difference in pH relative to neutral) were injected into the left and right pads, leaving the central one untouched. Then another 20 frames were scanned (Figures 2,3).
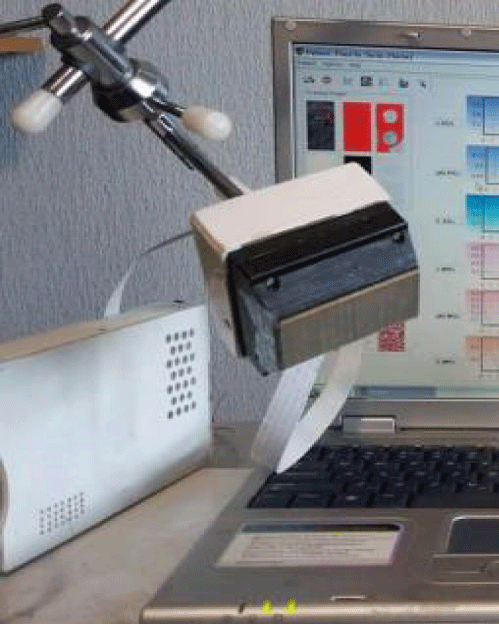
As a model object, ordinary yeast from the store was used (Biologische Hefe, DE-OKO-003, EU-Landwirtschaft). Lightly soaked with a distilled water to the state of a viscous fluid mass, yeast was poured onto the membrane of sterile insert (Transwell Costar 3450 Clear) in a thin layer about 1 mm thick and covered with a stainless steel counter electrode. In the middle of the electrode there was a thin hole for injecting a glucose solution with a syringe. In this way, the stable contact with the yeast was maintained before and after exposure. The room temperature was around 25°C. The outside of the membrane was soaked with saline (0.8%). The insert with yeast was placed on the electrode matrix of the scanner and kept for adaptation for about an hour. A point application of a drop (1.5 μL, 6 mm) of glucose was used. The glucose took ~5 minutes from to diffuse from the top to the cell layer. In each of the 6 experiments performed, the SEL monitoring took about 1 hour, i.e. until complete relaxation of the SEL dynamics. The fast periodic scanning (4s/frame) was used: firstly every 2 min and then 5 min. These SEL reading series consisted of a sequence of 5-10 frames. The processing and presentation of the obtained image matrices was done in two ways: - to assess the dynamics in the second range, variations in the parameters of all pixels were calculated during each series in the form of dispersion fields; to evaluate the dynamics in the minute range, the difference images between the averaged values of each series were calculated.
Results
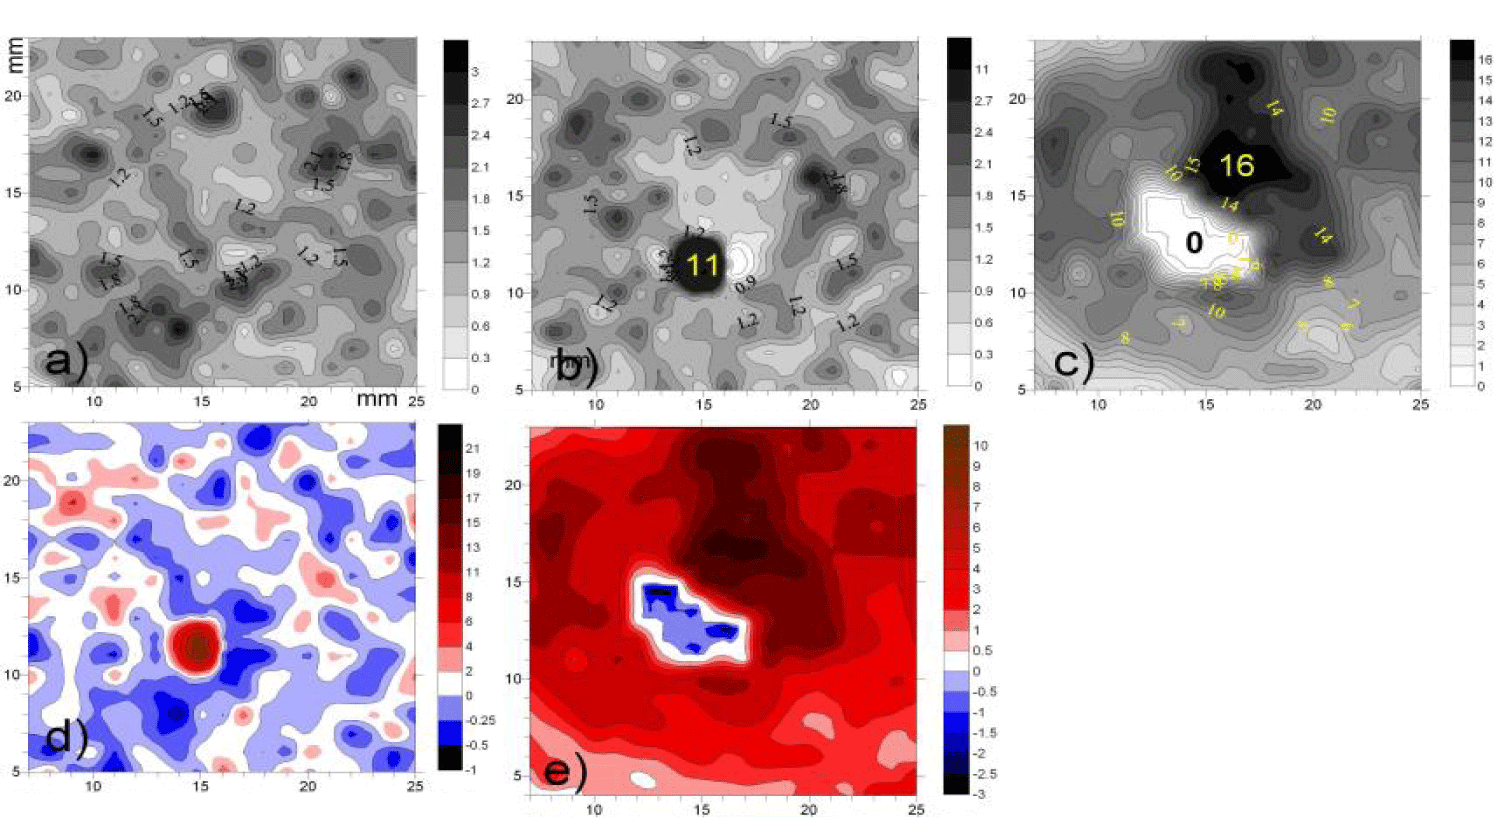
On figure 4 the dispersion fields of three series starting from the 10th minute are presented in phase angle values φk. Figure 4a demonstrates the typical chaotic nature of the initial 2D dynamics and further for about 5 minutes of the latent period after glucose application. (Here it is appropriate to emphasize the similarity with the chaotic dynamics φk of the healthy skin, figure 4a and if in figure 4a no noticeable response is yet visible, then in figure 4b two opposite events can be seen occurring in the same feeding area over the next 5 minutes:
- A sudden increase in their metabolic rate known as a “GLC burst” with maximum variations (black), which are more than an order of magnitude higher than the background values;
- The area of weakened dynamics around it (white).
After the next five minutes, the distribution of activity changed even more sharply but in anti-phase manner (Figure 4c):
- The zone of the former epicenter expanded many times, but its activity dropped to zero;
- the surrounding space also greatly expanded and also inverted its activity from white to black, i.e. from minimum to maximum activity, i.e. many times greater than that of the background level itself (p < 0.05).
To emphasize this anti-phase dynamics, in figures 4d-f the additional difference images of the last two figures 4 b,c with the initial one figure 4a are depicted at (compare with figure 1b).
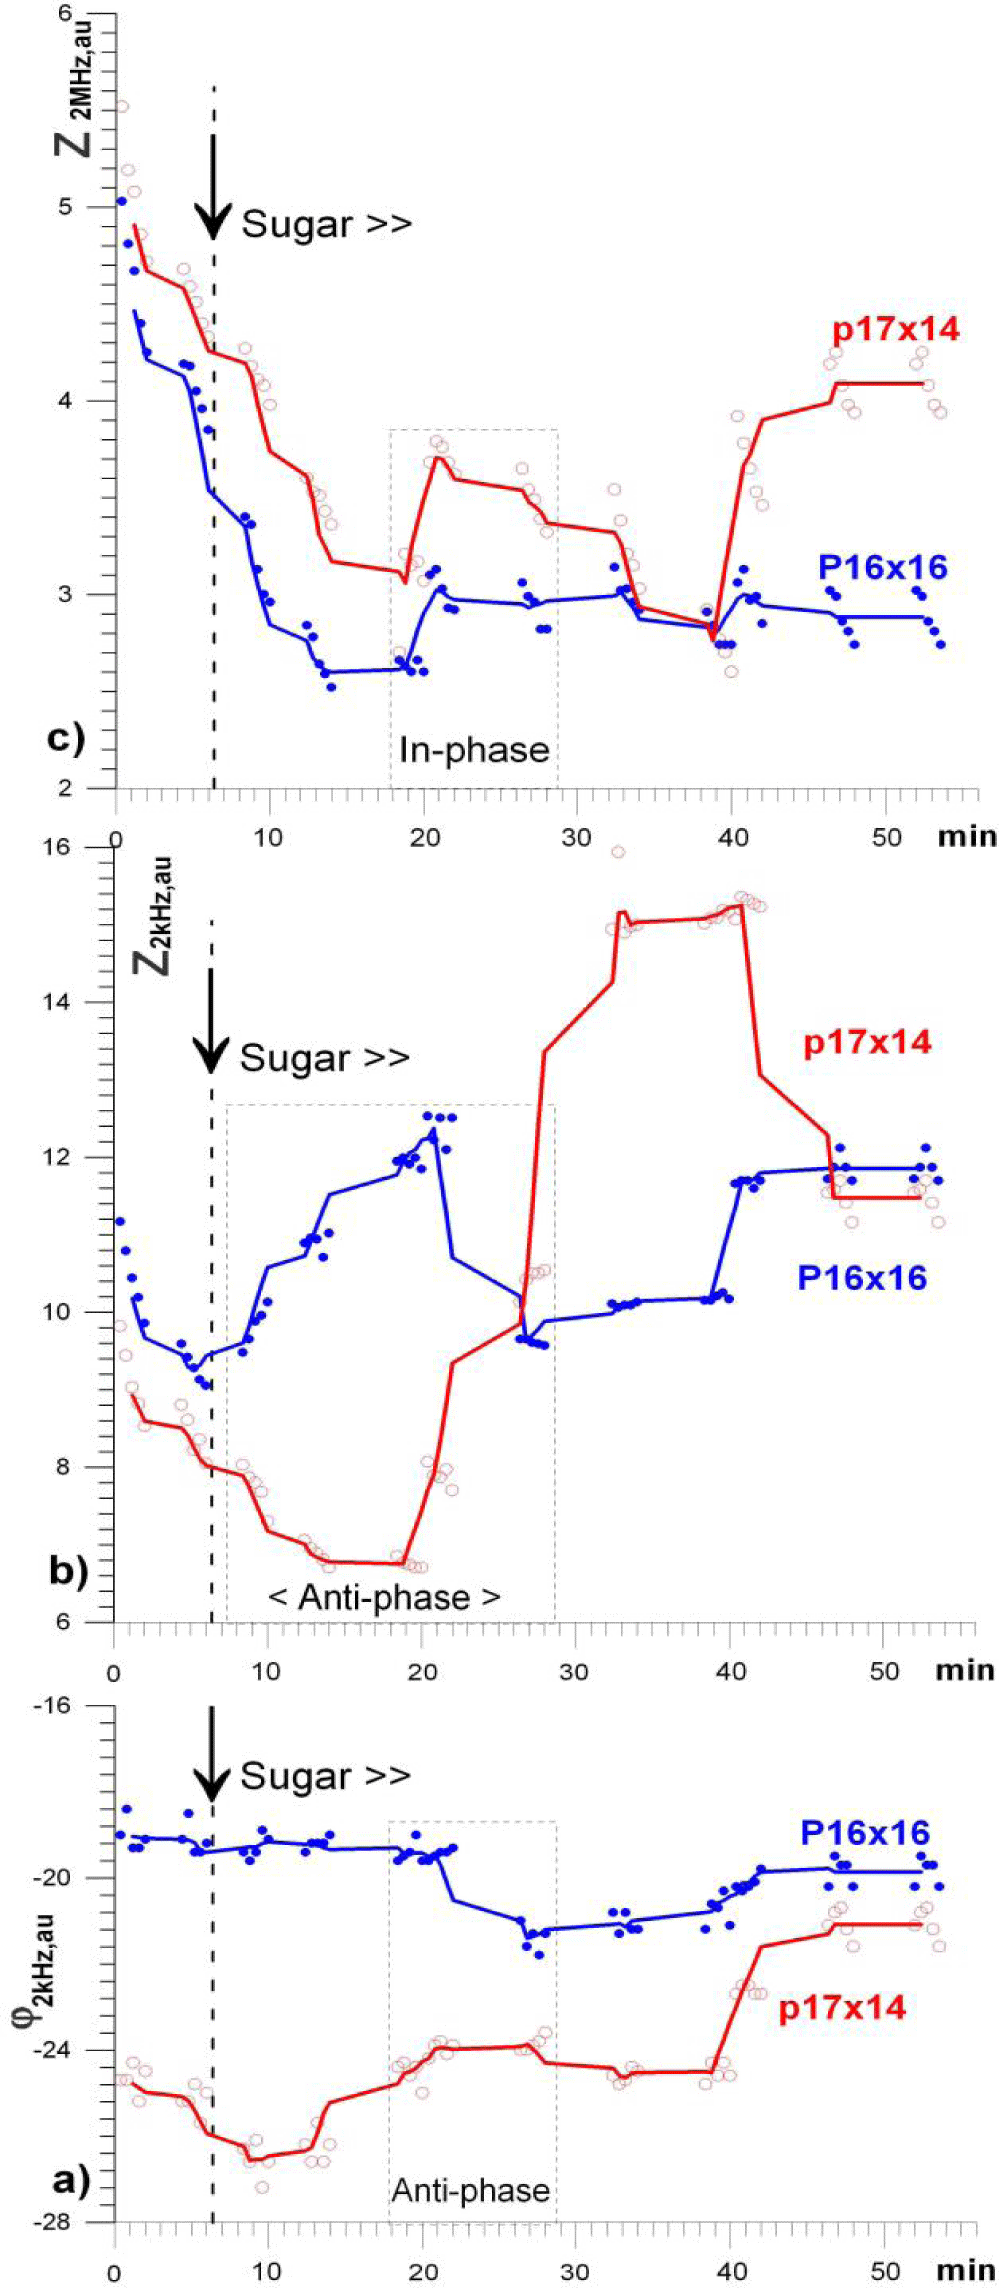
In addition, the through-sequence time graphs of individual pixels were built (Figure 5).
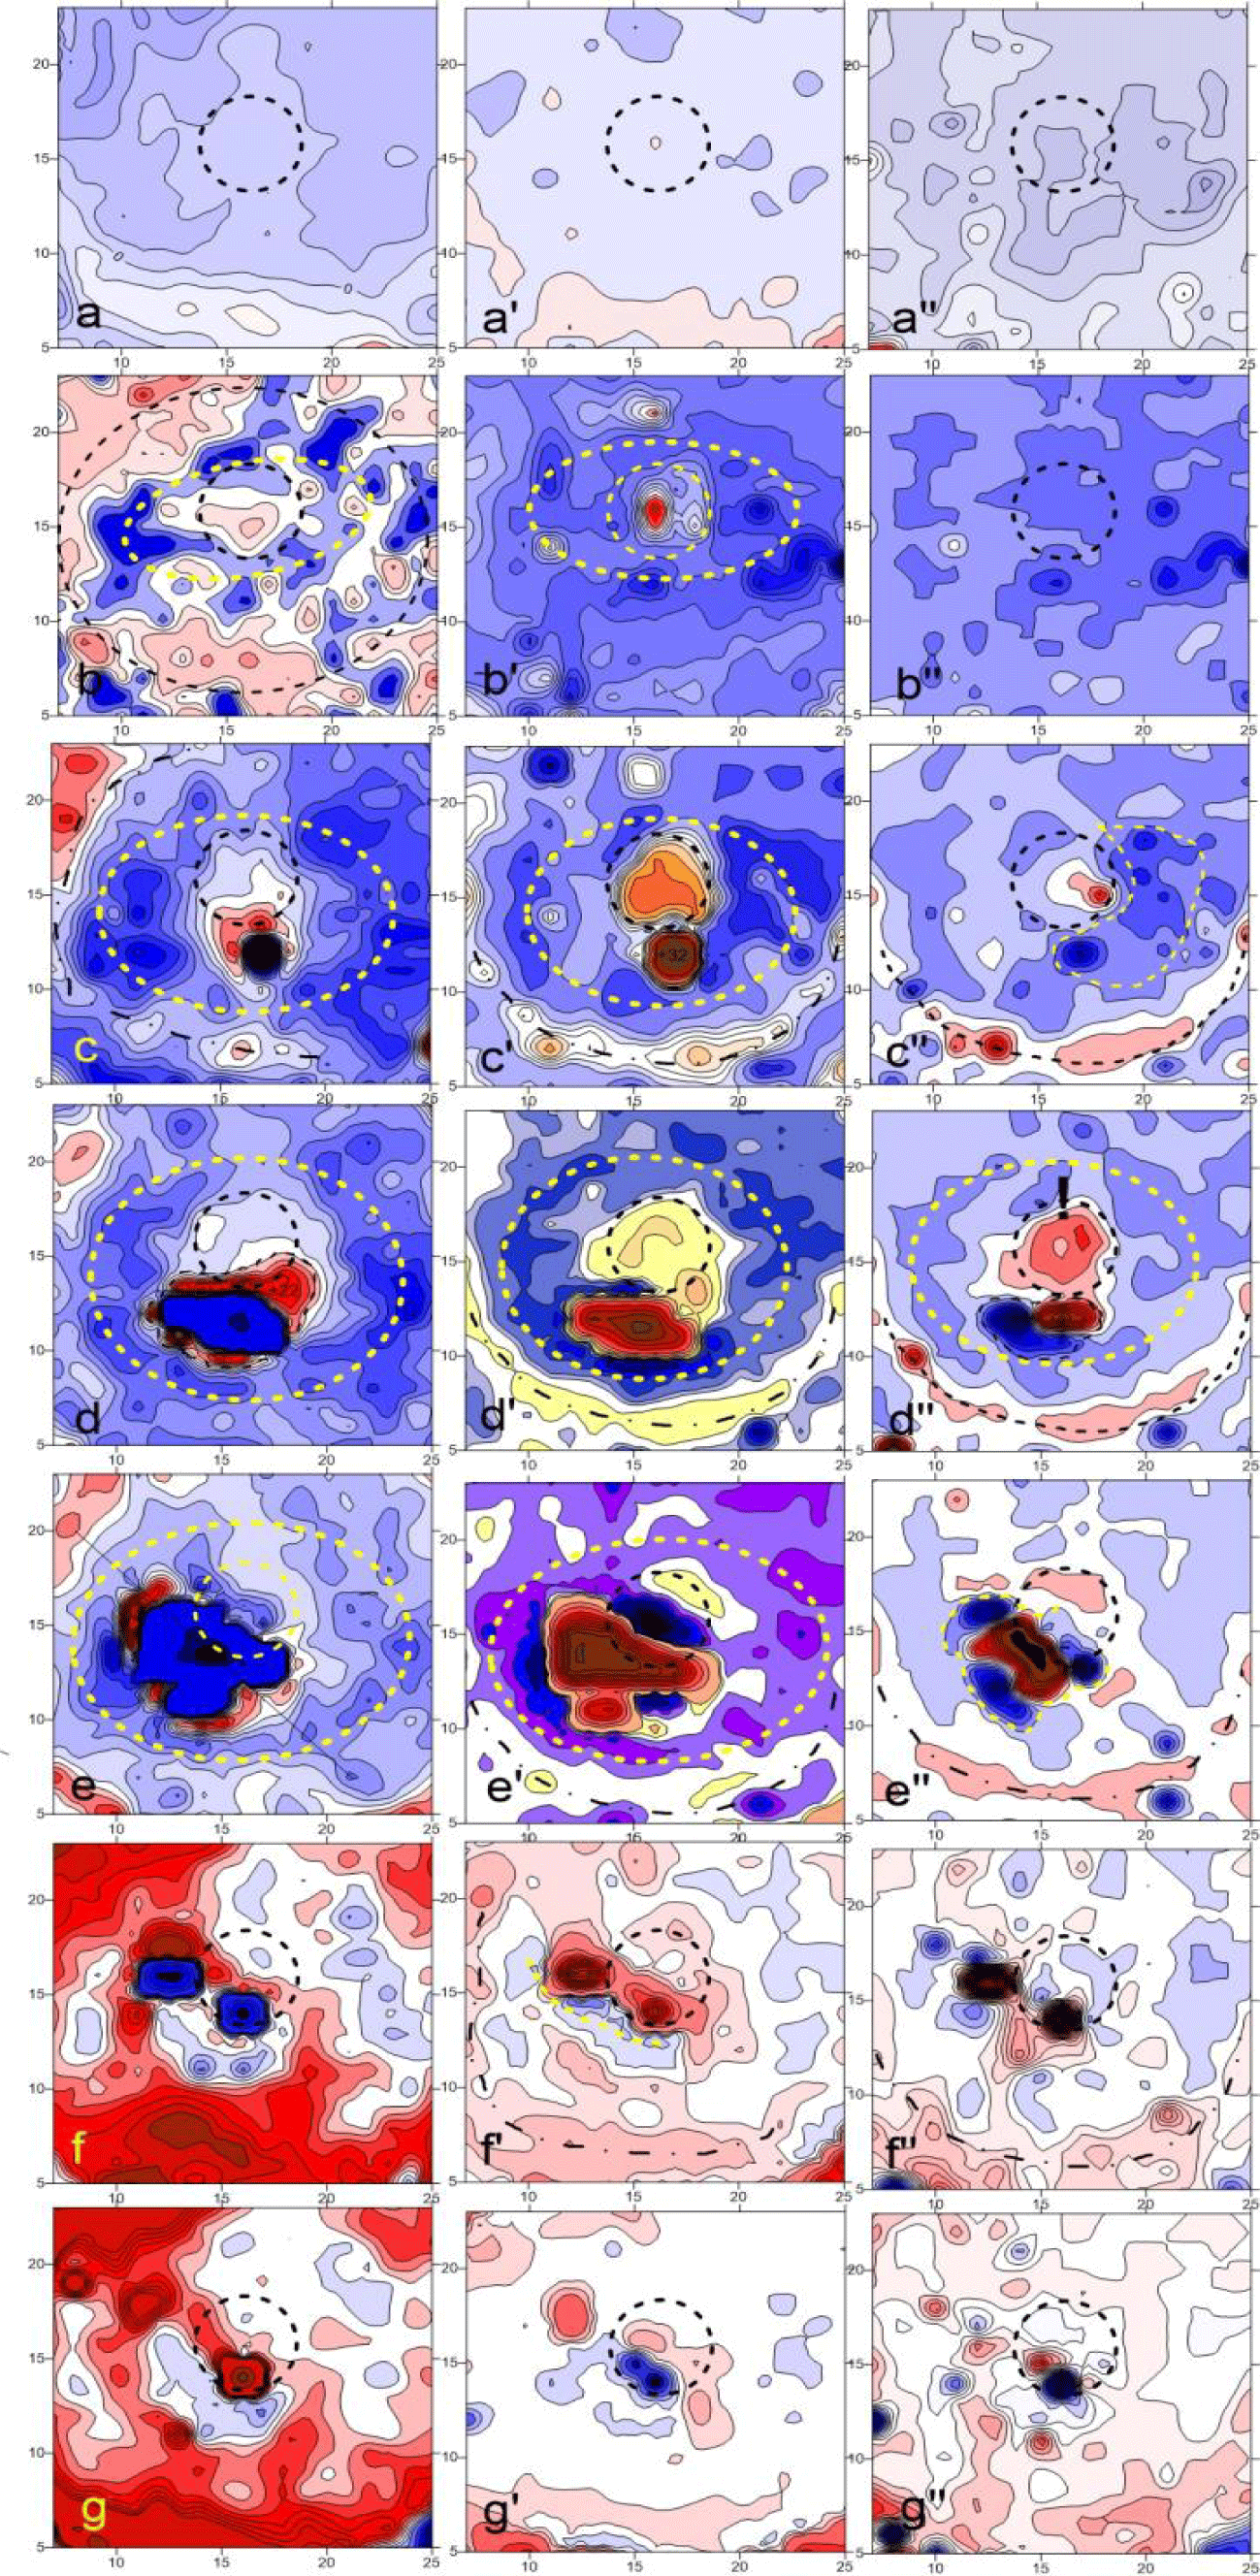
Spatial variations of all 3 parameters were calculated as the difference between the averaged image matrices of neighboring stages of the experiment, i.e. they reflect how much the landscape changed in 5 minutes compared to the previous one, figure 6. Thus, in figure 6a-a'' one can note relatively weak changes compared to the original landscape, expressed in a general downward trend, as was also noted in the graphs of (Figure 4). In addition, and most importantly, this is the absence of pronounced anti phase circular structures in all parameters. These structures begin to noticeably appear only in the parameters of φk and Zk (Figure 6b). Interestingly, here and below, one can note the formation of not only the near (most pronounced), but also the far circular zone of coherent changes, marked by elliptical and circular dotted lines, respectively. (It can be assumed that if homogeneous yeast were used in the experiment, then these structures would also have the shape of circles). The next row of difference images of figure 6c, c'' shows: (i) the appearance of an intracellular response (ZM), as well as (ii) a distinctly increased anti phase structuring in the "feeding" zone, noted earlier in the dispersion fields (Figure 4). Similar dynamics, but with a 5 min delay, can be seen at the intracellular level (ZM) in the next row, (Figure 6d)''. In the next steps, figures 6e-g, one can see the relaxation processes, which are especially clearly visible by the inversion of the sign/direction of the process in the epicenter zone.
Discussion
Given the fundamental role of pH in many physiological and medical aspects, it is necessary to develop new technologies that provide both lower cost and practical application for the visualization and monitoring of this parameter at all levels of living tissue. The results of our previous phenomenological studies in human experiments revealed previously unknown phenomena of structurization and synchronization of SEL. Here we present an experimental confirmation of these phenomena obtained on the inorganic and cell models, and thus also the SEI ability to visualize and monitor the 2D acid-base landscape both on tissue and cell levels. In particular, it turned out that the phenomenon of anti-phase clustering at the border of the zone of increased glycolysis metabolism is characteristic of both melanoma and the yeast model. Furthermore, we have also shown the SEI ability to differentiate temporal and spatial features of these collective processes occurring at the intercellular and intracellular levels.
Yeast are unicellular microorganisms and can live independently, but life within a community is beneficial for the long-term survival and to adapt to the environment changes, in the cell-cell communication, they can use not only various molecular messengers but also metabolic oscillations as a more long-range means of communication [13]. This additional mechanism of local intercellular communication via the exchange of metabolites was earlier introduced as dynamic quorum sensing [14,15]. A typical behavior of reaction-diffusion waves was observed after local injection of glucose into the yeast cell suspension at two opposite sites leads to the formation of traveling circular waves which annihilate upon head-on collision [16-18].
The clusterization/synchronization effect is the main sign of the presence of "quorum sensing", since the collective oscillatory behavior, for example, the yeast cell population falls when the cell density falls below the threshold [18,19] In our work, a similar conclusion can be drawn by comparing the results of a preliminary experiment with "non-living matter" and that with yeast, i.e. figure 3 with figure 6: in the first case the zone of response to a local change in acid-base was limited only by a linear diffusion process, while in yeast this test caused long-term oscillatory metamorphoses of the entire landscape.
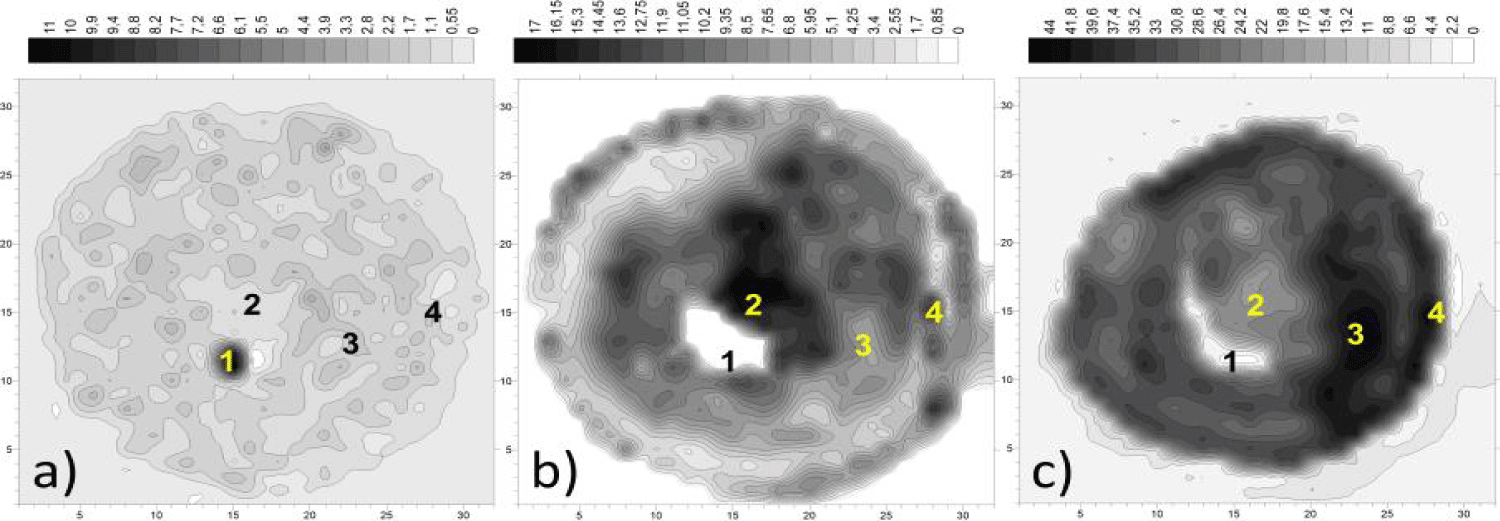
In contrast to the above references, many thousands of yeast cells are located under each microelectrode of the SEI scanner, so all the phenomena presented are a macroscopic manifestation of cooperative processes of intercellular and intercluster signaling. At the same time, the intermittent monitoring mode was used to assess the integral/cluster effects of SEL structuring, and not for detailed monitoring of wave dynamics. The latter, however, manifested itself in the form of increased activity at the edges of the entire yeast mass. Figure 7 represents 3 maps of the entire yeast model as the φk-dispersion fields calculated over 3 periods of 20 seconds each: 5, 15 and 60 min after glucose injection, respectively. For greater clarity of the range of SEL changes, the maps are presented in real values and full range of specific dispersion, the scales of the contour are linear with a step of 5%.
On figure 7a, i.e. at the time of the first appearance of the SEL response, it can be noted: - absence of noticeable structuring effects, except at the border of the epicenter "1"; - a multiple difference in the intensity of "1" and the entire yeast mass, which persists with a slight decrease for 1 hour.
The wave nature of the φk-dynamics is seen in figure 7c as a noticeable alternation of light and dark concentric zones. Comparing Figures 7b,c anti phase dynamics can be noted in all marked zones 1-4. In this case, the outer active ring appears to be a standing pH wave. It manifested itself most actively at all stages of the experiment, including the last one shown in (Figure 7c), when, as a result of edge drying, the area of the yeast has noticeably decreased, but still exhibits activity many times over above the initial level (Figure 7a).
It is worth emphasizing that the configuration of structures 2.3, once created as a result of GLC, continues to persist for some time. It can be assumed that in the case of melanoma, a similar structuring mechanism took place, i.e., the appearance of a standing pH wave in the zone of functional homogeneity.
We believe that the dynamics of structures 1-2 can be interpreted in favor of the version that "only hungry cells oscillate" [19-21]. At the same time, there is also a temptation to assume that long-term oscillations of the surrounding cells after the “feeding” of the center, which is many times greater than the initial one, are explained by cellular “envy”, which is humanly understandable* or, more diplomatically speaking, by a dynamic sensing quorum.
1*If the journal's lexicon allows such a hint.
Conclusion
The proposed SEI monitoring method is not only inexpensive and fast compared to, for example, the seahorse method, but also provides information for tracking many important details of the co-metabolism of glycolysis. It hopefully also provides a link between In vivo and In vitro studies. Since glycolysis is universally present in living cells, we can extrapolate our findings to other cell models, such as skin organoids, liver and pancreatic cell cultures etc. This will require further optimization of the proposed methodology.
Acknowledgments
This work was supported by the grant of European Association for Cancer Research (Ukr-Award 04, 2022) and the USA grant (1822, http://www.stcu.int, 2001-2004).
We express our deep gratitude to our colleagues Dr. Angela Riedel, Dr. Gudrun Dandekar, Prof. Thomas Dandekar and Dr. Florian K. Groeber-Becker for their understanding and assistance, without which this work in wartime conditions in our country would hardly have been possible.
Special thanks to Prof. Takashi Amemiya for valuable advice.
References
- Di Costanzo L, Panunzi B. Visual pH Sensors: From a Chemical Perspective to New Bioengineered Materials. Molecules. 2021 May 16;26(10):2952. doi: 10.3390/molecules26102952. PMID: 34065629; PMCID: PMC8156760.
- Mansoorifar A, Koklu A, Ma S, Raj GV, Beskok A. Electrical Impedance Measurements of Biological Cells in Response to External Stimuli. Anal Chem. 2018 Apr 3;90(7):4320-4327. doi: 10.1021/acs.analchem.7b05392. Epub 2018 Feb 14. PMID: 29402081.
- Urban F, Hajek K, Naber T, Anczykowski B, Schäfer M, Wegener J. PETER-assay: Combined Impedimetric Detection of Permeability (PE) and Resistance (TER) of Barrier-Forming Cell Layers. Sci Rep. 2020 Apr 30;10(1):7373. doi: 10.1038/s41598-020-63624-1. PMID: 32355192; PMCID: PMC7192940.
- Groeber F, Engelhardt L, Egger S, Werthmann H, Monaghan M, Walles H, Hansmann J. Impedance spectroscopy for the non-destructive evaluation of in vitro epidermal models. Pharm Res. 2015 May;32(5):1845-54. doi: 10.1007/s11095-014-1580-3. Epub 2014 Dec 3. PMID: 25467957; PMCID: PMC4381093.
- García E, Pérez P, Olmo A, Díaz R, Huertas G, Yúfera A. Data-Analytics Modeling of Electrical Impedance Measurements for Cell Culture Monitoring. Sensors (Basel). 2019 Oct 25;19(21):4639. doi: 10.3390/s19214639. PMID: 31731413; PMCID: PMC6864697.
- Gerasimenko T, Nikulin S, Zakharova G, Poloznikov A, Petrov V, Baranova A, Tonevitsky A. Impedance Spectroscopy as a Tool for Monitoring Performance in 3D Models of Epithelial Tissues. Front Bioeng Biotechnol. 2020 Jan 24;7:474. doi: 10.3389/fbioe.2019.00474. PMID: 32039179; PMCID: PMC6992543.
- Naumowicz M, Figaszewski ZA, Poltorak L. Electrochemical impedance spectroscopy as a useful method for examination of the acid–base equilibria at interface separating electrolyte solution and phosphatidylcholine bilayer. Electrochimica Acta. 2013;91:367-372. doi: 10.1016/j.electacta.2012.12.093.
- Urban F, Hajek K, Naber T, Anczykowski B, Schäfer M, Wegener J. PETER-assay: Combined Impedimetric Detection of Permeability (PE) and Resistance (TER) of Barrier-Forming Cell Layers. Sci Rep. 2020 Apr 30;10(1):7373. doi: 10.1038/s41598-020-63624-1. PMID: 32355192; PMCID: PMC7192940.
- Babich Y, Nuzhdina M. Visualization of the Skin Electrodynamic Landscape: Some Phenomenological Features in Norm and Oncopathology. In: Proc. of the WC on Medical Physics and Biomedical Engineering. Munich (DE): Springer; 2009. p.1-4.
- Babich Y, Nuzhdina M, Syniuta S. Young and advanced tumor-some 2D electrodynamic distinctions: melanoma and satellite during a vascular occlusion test: feasibility study. Med Biol Eng Comput. 2018 Feb;56(2):211-220. doi: 10.1007/s11517-017-1668-0. Epub 2017 Jul 10. PMID: 28691130.
- Babich Y, Nuzdhina M. New phenomenon in living matter? Clusterization & synchronization of electrodynamic landscape. J Cancer Res Oncobiol. 2019;2:15.
- Mojica-Benavides M, van Niekerk DD, Mijalkov M, Snoep JL, Mehlig B, Volpe G, Goksör M, Adiels CB. Intercellular communication induces glycolytic synchronization waves between individually oscillating cells. Proc Natl Acad Sci U S A. 2021 Feb 9;118(6):e2010075118. doi: 10.1073/pnas.2010075118. PMID: 33526662; PMCID: PMC8017953.
- Palková Z, Váchová L. Life within a community: benefit to yeast long-term survival. FEMS Microbiol Rev. 2006 Sep;30(5):806-24. doi: 10.1111/j.1574-6976.2006.00034.x. PMID: 16911045.
- Schütze J, Mair T, Hauser MJ, Falcke M, Wolf J. Metabolic synchronization by traveling waves in yeast cell layers. Biophys J. 2011 Feb 16;100(4):809-13. doi: 10.1016/j.bpj.2010.12.3704. PMID: 21320423; PMCID: PMC3037718.
- De Monte S, d'Ovidio F, Danø S, Sørensen PG. Dynamical quorum sensing: Population density encoded in cellular dynamics. Proc Natl Acad Sci U S A. 2007 Nov 20;104(47):18377-81. doi: 10.1073/pnas.0706089104. Epub 2007 Nov 14. PMID: 18003917; PMCID: PMC2141785.
- Schreml S, Meier RJ, Wolfbeis OS, Landthaler M, Szeimies RM, Babilas P. 2D luminescence imaging of pH in vivo. Proc Natl Acad Sci U S A. 2011 Feb 8;108(6):2432-7. doi: 10.1073/pnas.1006945108. Epub 2011 Jan 24. PMID: 21262842; PMCID: PMC3038700.
- Niesner R, Peker B, Schlüsche P, Gericke KH, Hoffmann C, Hahne D, Müller-Goymann C. 3D-resolved investigation of the pH gradient in artificial skin constructs by means of fluorescence lifetime imaging. Pharm Res. 2005 Jul;22(7):1079-87. doi: 10.1007/s11095-005-5304-6. Epub 2005 Jul 22. PMID: 16028008.
- Amemiya T, Yamaguchi T. Oscillations and Dynamic Symbiosis in Cellular Metabolism in Cancer. Front Oncol. 2022 Feb 16;12:783908. doi: 10.3389/fonc.2022.783908. PMID: 35251968; PMCID: PMC8888517.
- Weber A, Zuschratter W, Hauser MJB. Partial synchronisation of glycolytic oscillations in yeast cell populations. Sci Rep. 2020 Nov 12;10(1):19714. doi: 10.1038/s41598-020-76242-8. PMID: 33184358; PMCID: PMC7661732.
- Diaz-Ruiz R, Rigoulet M, Devin A. The Warburg and Crabtree effects: On the origin of cancer cell energy metabolism and of yeast glucose repression. Biochim Biophys Acta. 2011 Jun;1807(6):568-76. doi: 10.1016/j.bbabio.2010.08.010. Epub 2010 Sep 8. PMID: 20804724.
- Wang SW, Tang LH. Emergence of collective oscillations in adaptive cells. Nat Commun. 2019 Dec 9;10(1):5613. doi: 10.1038/s41467-019-13573-9. PMID: 31819049; PMCID: PMC6901517.
Content Alerts
SignUp to our
Content alerts.
 This work is licensed under a Creative Commons Attribution 4.0 International License.


