Medicine Group . 2022 November 21;3(11):1337-1352. doi: 10.37871/jbres1602.
Characterization of PM2.5 in Coastal Urban Area, Northwest Morocco: Seasonal Variations, Elemental Composition and Source Apportionment
Mounia Tahri*, Abdelfettah Benchrif, Moussa Bounakhla and Fatiha Zahry
- Air pollution
- Particulate matter
- Sale city
- Seasonal variations
- Back trajectories
- Source apportionment
Abstract
Sale, located along the Atlantic Ocean, is the third-largest city in Morocco. The Bouregreg river separates Sale from Rabat (Morocco’s capital city). This City is characterized by a high demographic density. Their main air pollution sources are traffic, ocean, potteries, fishing, domestic heating, and artisanal activities. Ambient PM2.5 particles were collected in an urban area of Sale City (Morocco) from July 2018 to July 2019. The sampling was carried out using a Dichotomous sampler and the Total X-Ray Fluorescence technique (TXRF) was used to evaluate the elemental composition of the collected filters. In this paper, chemical characterization, and source apportionment of PM2.5 were investigated. The results showed that the PM2.5 mass concentrations vary, during the sampling period, from 3.08 µg/m3 to 49.48 µg/m3 with an average of 17.30 µg/m3. The highest values were observed in winter while the lowest in summer. The influence of atmospheric transport scenarios on the levels of PM was carried out using air mass back-trajectories, using the HYSPLIT™ model. This study allowed identifying four main clusters arriving at our receptor site in Sale City: Iberian Coast (24%), Near Atlantic Ocean (33%), Local (28%), and Oceanic (15%). For seasonal variations of metal concentrations, K, Ca, V, Mn, Fe, Ni, Cu, Zn, As, Sr, Ba, and Pb exhibited their highest concentrations during winter while Ti and Cr, their highest concentrations were observed during Autumn. The Enrichment Factor (EF) analysis showed that Ti, Sr, Mn, K, Ca, and Ba are mainly originated from airborne dust with EF < 10, V, Cu, Cr have both natural and anthropogenic sources with 10 < EF < 100, while Ni, Zn, and Pb were mainly from anthropogenic source with EF > 100. Five factors were selected in Positive Matrix Factorization (PMF) model’s analysis: crustal contribution, road dust, brake wear, heavy oil combustion, and exhaust vehicle emissions. Their contributions to PM2.5 were 5%, 53.6%, 20.1%, 14.3% and 7%, respectively. Road dust and vehicle exhaust sources showed the highest contribution in winter; while soil dust, brake wear, and oil combustion sources contributed the most in summer. The present study could be considered as the first source apportionment study on PM2.5 fractions carried out in Sale City, Morocco.
Introduction
Urban air pollution is a worldwide environmental health problem affecting low, middle- and high-income countries. In 2019, air pollution has been classified as the 4th leading risk factor responsible for premature death in the World [1]. Concentrations of air pollutants can be influenced by many factors, including the emission sources, proximity to sources, and weather conditions (such as air temperature, stability of the air, wind speed, and direction).
Ambient air pollution in cities and rural areas was estimated to be responsible for 4.2 million premature deaths per year worldwide in 2016; this mortality was attributed to exposure to fine particles of 2.5 microns in diameter or less (PM2.5), which cause cardiovascular and respiratory diseases, as well as cancers [2]. According to this same study, 58% of premature deaths related to outdoor air pollution were due to ischemic heart disease and stroke, 18% to chronic obstructive pulmonary disease, 18% to acute lower respiratory infections, and 6% to lung cancer.
Particles (or particulate matter) are a common indirect indicator of air pollution. They affect more people than any other pollutant. They consist of a complex mixture of solid and liquid particles of organic and mineral substances suspended in the air. While particles with a diameter not exceeding 10 µm (≤ PM10) can penetrate and lodge deep inside the lungs, those with a diameter less than or equal to 2.5 µm (≤ PM2.5) are even more harmful to health. PM2.5 can cross the pulmonary barrier and enter the bloodstream. The causal link between exposure to these pollutants and mortality is now accepted by the scientific community and well documented by numerous epidemiological studies [3-7].
The chemical composition of PM2.5 particles is very variable; it depends, among other things, on the areas (urban area, rural area, coastal area, etc), the emitting sources, the activity of these sources, the seasonality, and the applied methodology [5,7,8-14].
In Morocco, big cities, like other big cities around the world, have experienced significant urban and industrial development over the last few years. This development was accompanied by an average annual growth of 3.44%, during the period 2014-2019 and has contributed to boosting the industrial and energy sectors, increasing the road traffic, and generating significant job opportunities for hundreds of thousands of families [15]. Unfortunately, this development has been achieved to the detriment of the quality of the environment, particularly the air quality. It is estimated that air pollution is the cause of more than 13,000 deaths each year in Morocco [16], which represents approximately 7% of total deaths, i.e., the 8th main risk factor for mortality. More than 12,000 deaths are attributable to ambient fine particles, around 800 deaths to indoor air pollution, and 200 deaths to ozone.
According to a study published by World Bank in 2017 [17], the cost of environmental degradation for Moroccan society was evaluated, in 2014, at nearly 32.5 billion dirhams, equivalent to 3.52% of GDP; and the cost of air degradation (for the same year) was estimated at 9.7 billion dirhams equivalent to 1.05% of GDP.
The Moroccan air quality monitoring network has 29 fixed and 3 mobile stations covering 15 cities and monitoring the following parameters: PM10, SO2, NO2, O3, and CO. For PM2.5 particles, they are not monitored and a conversion factor of 0.4 is used to convert the annual PM10 concentration to PM2.5 concentration [18].
The majority of studies that exist in the literature and that were carried out in Moroccan cities, report only the values of PM10, and rare are those where measurement campaigns dedicated to PM2.5 were carried out [19,20]. When this is the case, the PM2.5 concentrations are estimated from those of PM10 [17]. Table 1 gives an idea of the PM2.5 concentrations measured or estimated in some Moroccan cities.
Table 1: PM2.5 concentrations in some Moroccan cities. |
||
| City | Annual Ambient PM2.5 Concentration (µg/m3) | References |
| Tangier | 22* | [17] |
| Marrakech | 20* | [17] |
| Casablanca | 20* | [17] |
| Mohammedia | 18* | [17] |
| Settat | 17* | [17] |
| Fes | 16* | [17] |
| Benslimane | 13* | [17] |
| Khouribga | 12* | [17] |
| Agadir | 5* | [17] |
| El-Jadida | 4* | [17] |
| Safi | 3* | [17] |
| Kenitra | 52 | [20] |
| Meknes | 29 | [18] |
*: Values estimated based from DMN (General Directorate of Meteorology) for PM10 concentration per monitoring station (2012-2015) using the conversion factor of 0.4. |
||
Like other countries in the world, Morocco has also recorded significant reductions in air pollutants during the year 2020 [21-23], due to the large-scale cut down of unnecessary movement throughout the cities caused by the COVID-19 pandemic, showing just how of an impact excessive vehicular usage can have on the environment.
In this paper, we aim to investigate the air quality in Sale City by characterization of its chemical composition, evaluation of the relation between PM2.5 mass concentration and meteorological parameters, evaluating the number of backward trajectories arriving at the receptor site in the Sale City during the sampling period, investigating seasonal variations of PM2.5 mass concentrations, and quantification of emission sources using Positive Matrix Factorization (PMF) model’s analysis.
Materials and Methods
Sampling site
Sale City is an imperial city that has 10 centuries of existence. After independence, this city experienced strong demographic growth, its population increased from 75,000 (in 1960) to more than 750,000 inhabitants (in 2005), a figure multiplied by 10 in 40 years. The average annual growth rate experienced today by Sale city exceeds 6.5% while the national average rate is 2.06% (according to the official census of 1994). This urban sprawl in the city has generated an increase in road traffic as well as the apparition of sectors contributing to atmospheric pollution (residential sector, industrial sector, agricultural sector, etc.). Sale city enjoys a Mediterranean climate with a temperature ranging from cool in winter to warm in summer.
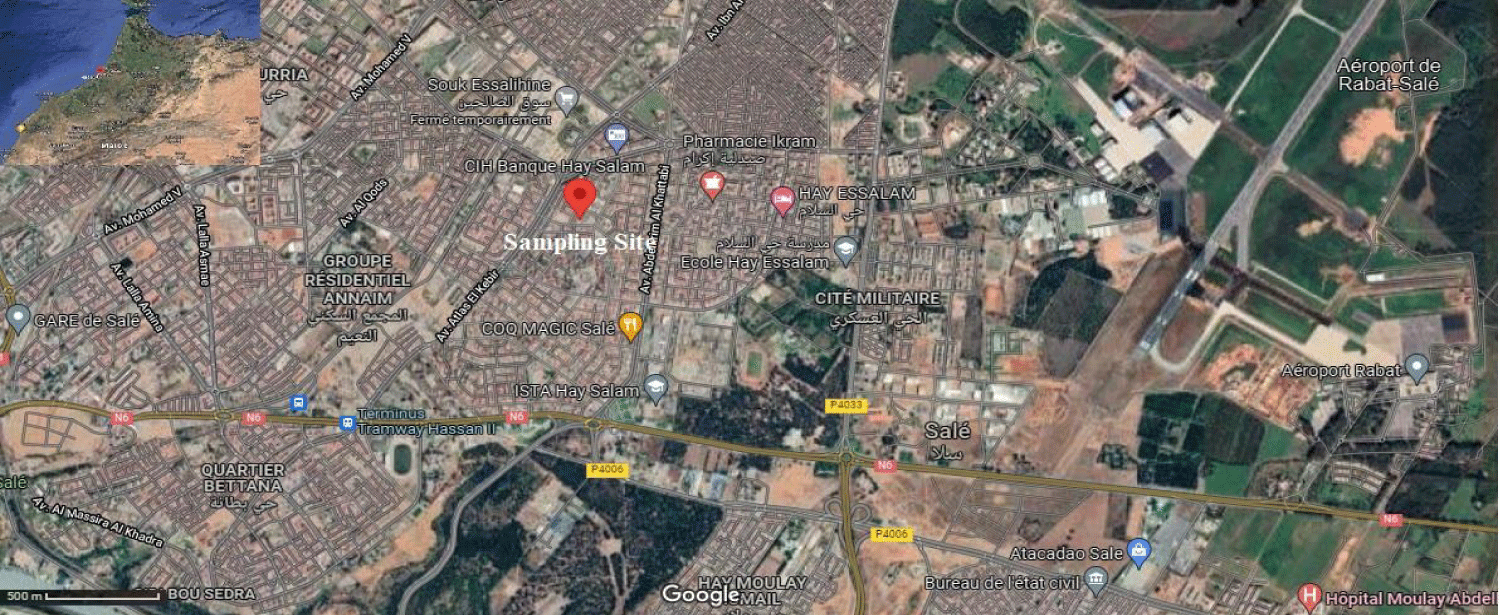
For the present study, the sampling site was an urban area in Sale City with the coordinate (34.043806, -6.788583) in Sale City (Figure 1). A Dichotomous sampler (Graseby Andersen) [24] was used to sample simultaneously the fine (PM2.5) and the coarse (PM2.5-10) particulate matter using two sequential 37 mm diameter PTFE membrane disc filters, with a flow rate of 16 l/min.
The filters were collected for one year (from July 2018 to July 2019), one sample every 6 days with a 24-h sampling time. In total, 104 PM2.5 samples were collected, splatted as follows: Summer (26), Autumn (26), Winter (26), and Spring (28). The handling of the collected filters was conducted in a clean area and kept in Petri dishes until their analysis.
Each filter was weighed before and after the sampling using a microbalance type Mettler Toledo Model AG245. The difference in weight was divided by the volume of air passing through the filter to obtain the PM mass concentration, expressed in µg/m3.
Meteorological data
The NOAA website was used to download the meteorological data for wind speed, temperature, and humidity. The nearest station to our sampling site was that of Rabat-Sale Airport Station (34.051389,-6.751389). Daily averages for each meteorological parameter were calculated from hourly values and were subsequently used to calculate monthly averages.
Air mass backward trajectory by HYSPLIT model
To study the source regions of air masses arriving at our receiving site, air mass retro-trajectory approaches of air masses can be used. Among the various modelling tools that exist, the Hybrid Single-Particle Lagrangian Integrated Trajectory (HYSPLIT™) model version 5.1.0 was used in this study for this purpose [25-27].
The HYSPLIT model is a professional system for calculating simple trajectories of air masses, as well as complex simulations of transport, dispersion, chemical transformation, and deposition of gaseous or particulate pollutants [28]. The NOAA (National Oceanic and Atmospheric Administration) and the ARL (Air Resources Laboratory) are the two organizations that developed the HYSPLIT model.
The data used for the calculation of back trajectories were downloaded from the Global Data Assimilation System (GDAS). We hence calculated the 48-h backward trajectories from 17 July 2018 to 17 July 2019 arriving at our sampling site in Sale. In total, 107 return trajectories were calculated and used in the cluster analysis.
Trajectory cluster analysis is a means of grouping similar trajectories and it aims at finding out trajectories that are of the same (or similar) pattern or distinguishing some undesired behaviours (such as outliers) [29].
Sample preparation and analysis
Total X-Ray Fluorescence technique was used to analyse the collected filters. The use of this technique requires bringing into solution the samples. For that, the whole filter samples were dissolved with 8 mL of concentrated HNO3 and 2 mL of H2O2 in a microwave oven, type Milestone MAXI14, for 45min at 200°C. The obtained solutions were stored at 4°C in a refrigerator until their analysis.
For quantitative quantification, Ga was added as internal standardization in each solution. An aliquot of 10 µL was then pipetted on a quartz reflector after the homogenization step and dried under an infrared lamp. The analysis was conducted during 1000s for each sample. A blank filter was analysed after each 10 samples analysis to determine the eventual contaminations. The blank filters were prepared and analysed adopting the same steps as those of the collected filters. The final concentration was calculated after the deduction of those measured in the blank filters.
The used system was of type S2-Picofox by Bruker AXS (Berlin, Germany). Energy excitation was 17.5 keV and the instrument was operated at 750 µA and 50 kV. Treatment and deconvolution of X-ray fluorescence peaks and analysis of elemental concentration were achieved using the SPECTRA instrument software after manual identification of the elements.
The accuracy of the metal analysis was checked using standard reference material (SRM, 2783 Air particulate on Filter Media- NIST). For light elements (Al, P, S, and Cl), not good recovery was obtained, and Si was not also measured because of the use of quartz reflectors (Table A1, supplementary material). Consequently, these elements were not investigated in the present study. The measured elements were K, Ca, Ti, V, Cr, Cu, Mn, Fe, Ni, Zn, As, Sr, Pb, and Ba (Table A2, supplementary material).
Enrichment factor analysis
To distinguish between anthropogenic influences and the natural background levels of metals in PM2.5, an Enrichment Factor (EF) relative to the Upper Continental Crust (UCC) has been calculated [30].
where Cx and Cref are the concentrations of element X and a reference element, respectively. The reference element is chosen according to its consistency and uniform presence in UCC. Elements as Al, Fe, and Ti are widely used as the reference materials for calculating enrichment [31-34]. In the present study, Fe was selected as the reference element due to its stable and spatially homogeneous distribution in the study area.
By convention, EF of an element < 10 is an indication that this element is mainly from crustal origin and thus it is considered as non-enriched elements; an 10 < EF < 100 reflects a mixed contribution of both natural and anthropogenic sources and it is considered as moderately enriched, and an EF > 100 indicates that this element comes mainly from anthropogenic sources and it is considered as abnormally enriched elements.
Positive Matrix Factorization (PMF) and source identification
The chemical composition data were analysed using the positive matrix factorization receptor model (version PMF 5.0) developed by US EPA. The detailed principles and algorithm of PMF are described by Paatero P, et al. [35] and Paatero P [36]. This approach has been widely applied to estimate the contribution of major emission sources to ambient fine and coarse fractions [37-40]. The input matrices for PMF are the measured values and their uncertainties. PMF requires that all values and uncertainties are positive values; therefore, missing data and zero values must be omitted or replaced with appropriate substitute values.
A speciated data set can be viewed as a data matrix X of n by m dimensions, in which n is the number of samples and m is the chemical species to be measured. The goal of multivariate receptor modelling is to identify the number of factors p, the species profile F(p × m) of each source, and the amount of mass G(n × p) contributed by each factor to each sample.
Selection of the optimum number of factors is subjective and the user must select a maximum number of factors that can adequately describe the total PM mass [37]. The optimum number is chosen based on the most physically reasonable result and a sufficiently good fit to the elemental concentrations [41]. Paatero P, et al. [42] suggest that the assessment of different solutions as a function of the parameter Fpeak that yields an acceptable Q value and evaluating the resulting source profiles are more objective ways to evaluate the PMF results and to choose the optimum solution.
Missing data were substituted with the median value and their uncertainties were replaced by four times the median value. The input variables were classified using the Signal-to-Noise (S/N) criteria [43]: species were categorized as ‘strong’ if signal-to-noise ratio ≥ 2, ‘weak’ if 0.2 ≤ signal-to-noise ratio ≤ 2, or ‘bad’ if signal-to-noise ratio < 0.2. In this context, the species K, Ca, V, Fe, Cu, Zn, Ba, and Pb were classified as ‘strong variables’ and the species Ti, Cr, Ni, As, and Sr as ‘weak variables. P was classified as ‘bad variables’ and eliminated during the application of PMF5.
The optimal number of factors was identified after analysing the goodness-of-fit Q values for the entire run, the scaled residual matrices, G-space plots, and the physical meaningfulness of the factor profiles and contributions [44]. The model was run 20 times with five factors and a seed of 83. Q-robust OD the present study was found to be equal to the Q-true, indicating no outliers impacting the Q-value. After a reasonable solution was found, the uncertainties in the modeled solution were estimated using a bootstrapping technique. A total of 20 bootstrap runs were performed with a minimum r²-value of 0.6 of the 20 runs, all the five factors were mapped to a base factor in every run indicating a stable result.
Results and Discussion
Descriptive statistics
In table 2, we have presented the summary statistics of PM2.5, wind speed, humidity, and temperature during the sampling period (July 2018-July 2019) in Sale City.
| Table 2: Statistics of monitoring results in Sale City from July 2018 to July 2019. | ||||
| PM2.5 (µg/m3) | Wind Speed (km/h) | Temp (°C) | Relative Humidity (%) | |
| Mean | 17.3 | 2.9 | 17.3 | 73.4 |
| Minimum | 3.1 | 1.0 | 8.3 | 34.7 |
| Maximum | 49.5 | 7.1 | 27.7 | 92.0 |
| Standard Deviation | 9.3 | 1.1 | 4.4 | 10.7 |
| Median | 15.1 | 2.9 | 16.6 | 75.7 |
| Variance | 85.8 | 1.2 | 19.1 | 113.8 |
| Skewness | 1.3 | 0.8 | 0.1 | -1.5 |
| Coefficient of Variation (%) | 54 | 38 | 25 | 15 |
PM2.5 concentrations varied from 3.08 µg/m3 to 49.48 µg/m3 with an average of (17.30 ± 9.26) µg/m3 and a coefficient of variation in the order of 54% indicating the greater the level of dispersion around the mean.
In table 2, we have also reported the values of skewness and kurtosis. The skewness is used as a measure of symmetry. A value of skewness equal to zero indicates that the distribution could be considered as symmetric, a negative value indicates that the distribution is skewed to the left and a positive value indicates that the distribution is skewed to the right. In our case, the value of skewness for PM2.5 and wind speed were positive indicating that their distributions are skewed to the right; for relative humidity, the skewness value was negative meaning that its distribution is skewed to the left. For temperature, the skewed value was close to zero reflecting that its distribution is symmetric (Figure A1, supplementary material).
Analysis of PM2.5 exceedances
We say ‘exceedance’ when the concentration of a given pollutant exceeds the limit values or the recommended values imposed and fixed by law, regulation, or directives. Various agencies around the world have established air quality directives and guideline values (over daily or annual scales) to control air pollution, as an example we can cite WHO, EPA, EU.
In Morocco, we have not yet set a limit value for PM2.5; so, for this study, we will adopt that of the 24-hour Air Quality Guidelines (AQG) defined recommended by WHO which is 15 µg/m3 [45].
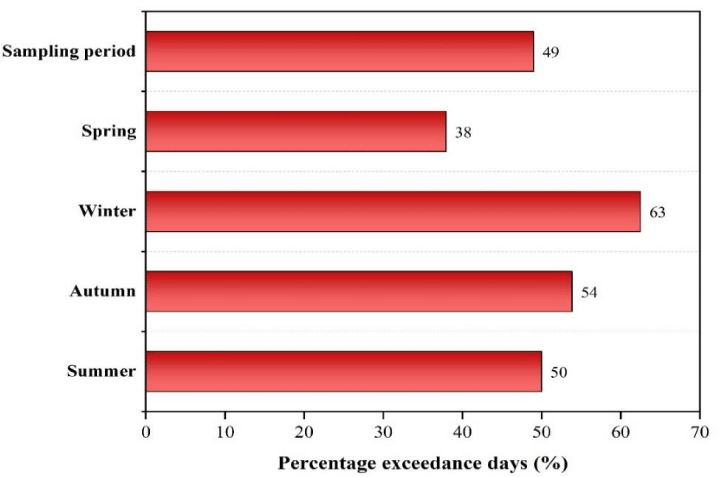
As we can see from figure 2, 49% of days for all the sampling period, in Sale City, exceed the 24-hour AQG levels recommended by WHO. The winter season represents the highest number of exceedance days with a percentage of 63% compared to the other seasons. While the lowest number of exceedance days with a percentage of 38% was observed during the spring season.
Air mass backward trajectories clustering
In the cluster analysis method, numbers of clusters are based on the Total Spatial Variance (TSV) used for better quantification of clusters. On the TSV plot, the iterative step just before (to the left of the plot) the large increase in the change of TSV gives the final number of clusters [26].
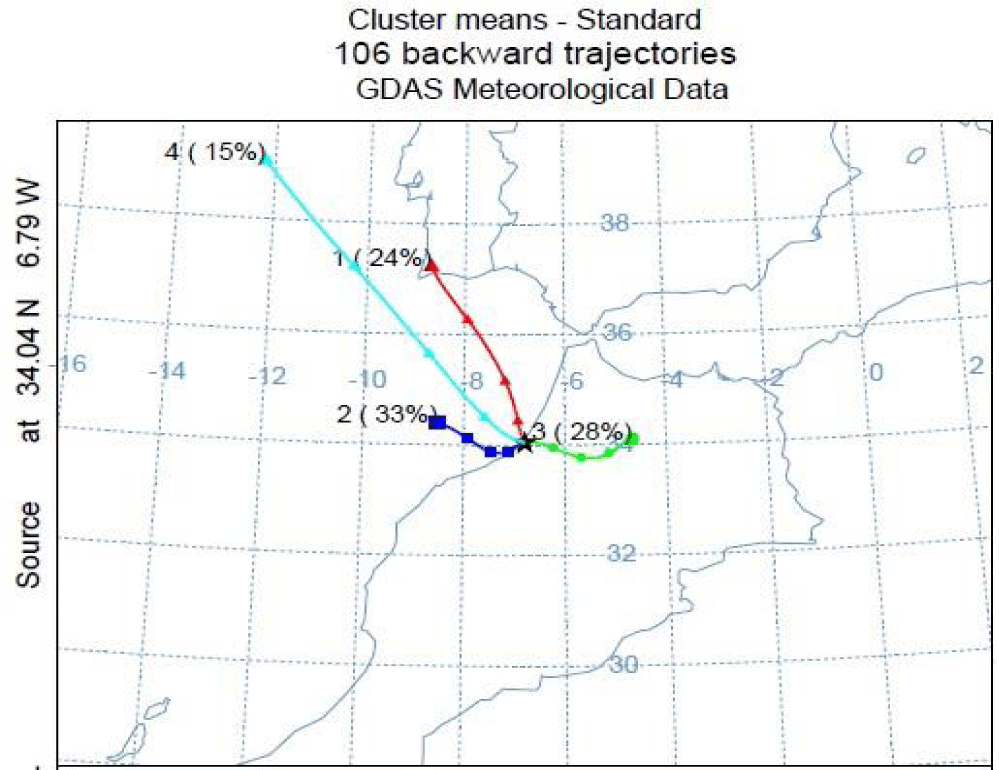
Based on the TSV plot calculated using Hysplit software’s hierarchical cluster approach, 4 major trajectory pathways were identified from 107 trajectories arriving at the sampling period in Sale City from July 2018 to July 2019 (Figure 3).
Table 3 shows the number of trajectories assigned to each cluster, the average concentrations of PM2.5, and averaged meteorological parameters for each cluster.
| Table 3: Trajectory numbers, mean concentrations, and standard deviations of PM2.5 and averaged meteorological parameters observed in Sale City related to the 4 clusters. | |||||||
| Cluster | Number of Backward Trajectories | Percentages of all Trajectories (%) | Path | Mean concentrations and Standard Deviation of PM2.5 (µg/m3) | WS (km/h) | T (°C) | RH (%) |
| 1 | 25 | 24 | Iberian Coast | 13.19 ± 4.70 | 3.01 | 18.12 | 76.19 |
| 2 | 35 | 33 | Near Atlantic Ocean | 17.10 ± 8.81 | 2.88 | 17.64 | 75.41 |
| 3 | 30 | 28 | Local | 23.98 ± 10.09 | 2.40 | 17.18 | 77.18 |
| 4 | 16 | 15 | Oceanic | 10.90 ± 4.39 | 3.73 | 14.23 | 73.70 |
| T(°C): Temperature [mean value]; WS (km/h): Wind Speed; RH(%): Relative Humidity | |||||||
The cluster analysis showed that four major transport patterns were observed: Iberian Coast (24%), Near Atlantic Ocean (33%), local (28%), and Oceanic (15%).
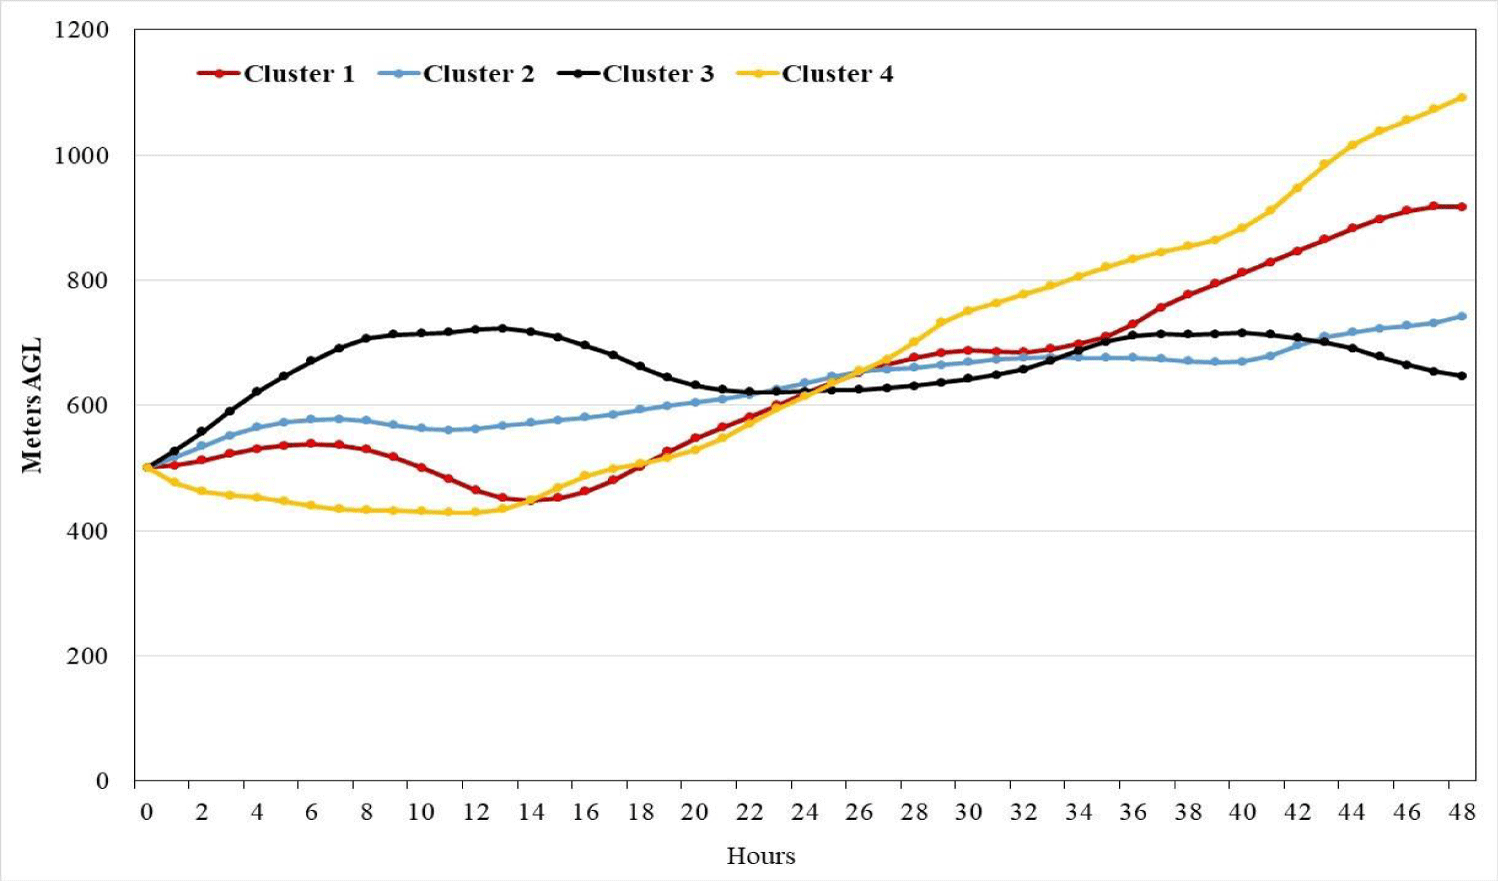
In addition, from figure 4, we can note that the air mass trajectories arriving at our receptor site in Sale City were mainly distributed between 500 to 800 m for the last 24 hours.
The air masses of Cluster 3 are considered as the major pollutant in air masses because it is associated with PM2.5 concentrations (Table 3) higher than the mean concentration recorded during the sampling period (Table 2).
Cluster 3 is also distinguished from the other clusters by low wind speed (2.40 km/h) and high Relative Humidity (77.18 %), compared to the other clusters. These meteorological conditions contribute to the accumulation of the pollutants and then lead to the highest air mass concentrations in Sale.
Seasonal variations of PM2.5 concentrations and metal concentrations
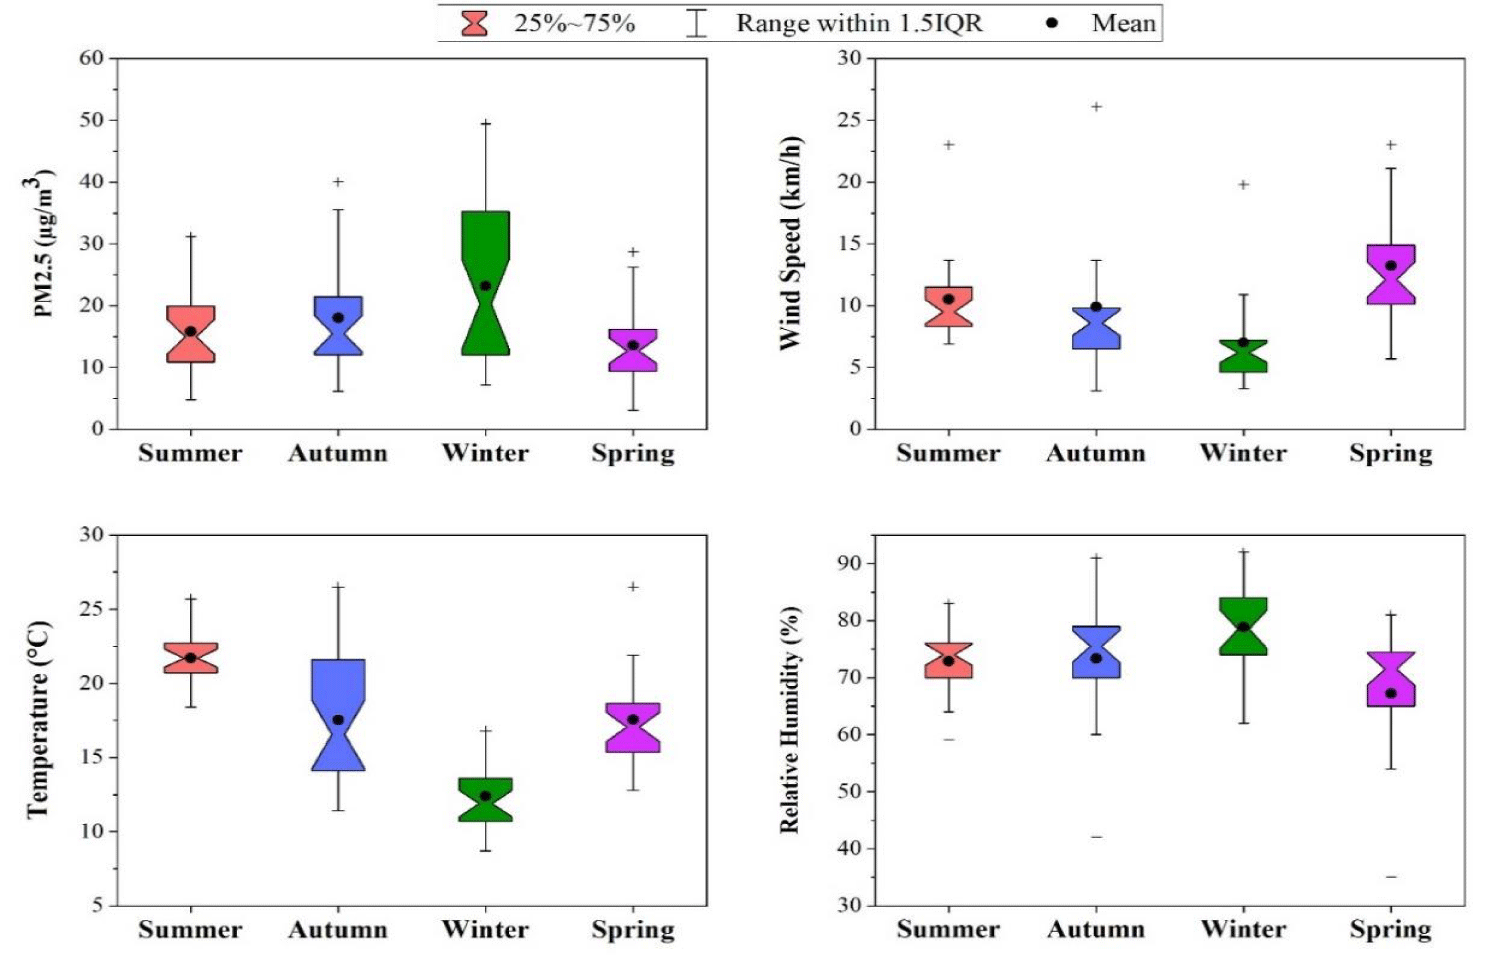
To analyse the seasonal variations of PM2.5 and some meteorological parameters (wind speed, temperature, and humidity), the collected data were separated into four seasons: Summer (from June to August), Autumn (from September to December), Winter (from December to February) and Spring (from March to May). Notched box plots of these seasonal variations are presented in figure 5.
Although PM2.5 concentrations were significantly different among the four seasons, they did not fluctuate too much (Figure 5). The quarterly average mass concentrations of PM2.5 followed the order of winter (22.17 ± 2.59 µg/m3) > Autumn (17.52 ± 1.70 µg/m3) > Spring (16.60 ± 1.60 µg/m3) > Summer (14.92 ± 1.17 µg/m3).
From figure 5, it can be also shown that the lowest values of humidity are recorded in spring for humidity (70 ± 0.4%), in winter for temperature (12 ± 0.1°C) and wind speed (2 ± 0.04 km/h). However, the highest values were obtained in winter for humidity (80 ± 0.3%) and in summer for temperature (21 ± 3°C) and wind speed (3 ± 0.4 km/h).
In winter, the observed average concentrations of PM2.5 were higher compared to those of the other seasons (Figure 5) which could be attributed to the low wind speed (less than 2 km/h) and the high humidity during this season (about 80%). When the atmospheric condition is relatively stable, the influence of meteorological conditions on particle concentration is very significant [46,47]. During the sampling period, the winter season was characterized by the morning formation of fog at the beginning of the day which result in the humidification of the air and the increase of its density; in addition, the low wind speed affects the process of self-cleaning of the atmosphere and favourites the accumulation of pollutants in the air [48].
Seasonal variations of the concentrations of the analysed PM2.5 associated elements are presented in table 4. A One-Way ANOVA Test was used to determine the significance among the four seasons and a p < 0.05 was taken to indicate the statistical significance. There were no significant seasonal variations for most analysed elements, except for Ca, Cu and Zn. The higher concentrations for most elements, except for Ti, Cr, and Mn, were observed during winter, which may relate to unfavorable meteorological conditions (characterized by high humidity and low wind speed, Figure 5) that inhibit pollutant dispersion and favourite their accumulation in the air [48,49]. While the lowest concentrations for almost all the elements were observed during spring.
| Table 4: Seasonal variations of the analyzed PM2.5 associated elements in Sale City from one-year time series samples (ng/m3). | ||||||||||||||
| (ng/m3) | Mean | SD | Median | Min | Max | Mean | SD | Median | Min | Max | ||||
| K | Summer | 455.1 | 243.9 | 386.0 | 171.3 | 1292.5 | Ni | Summer | 6.4 | 2.5 | 6.2 | 3.3 | 14.6 | |
| Autumn | 433.1 | 150.9 | 368.0 | 236.8 | 692.1 | Autumn | 7.0 | 1.8 | 6.9 | 3.2 | 9.6 | |||
| Winter | 522.2 | 185.3 | 562.3 | 225.0 | 881.7 | Winter | 7.6 | 2.5 | 7.2 | 4.1 | 13.1 | |||
| Spring | 372.9 | 137.5 | 357.0 | 145.4 | 666.0 | Spring | 6.7 | 2.2 | 6.9 | 1.6 | 9.5 | |||
| Ca | Summer | 1172.6 | 587.3 | 1096.4 | 211.7 | 2556.9 | Cu | Summer | 7.1 | 6.0 | 5.3 | 2.0 | 27.9 | |
| Autumn | 1187.7 | 636.6 | 941.0 | 332.9 | 2538.1 | Autumn | 9.4 | 5.5 | 7.0 | 3.2 | 23.2 | |||
| Winter | 1578.1 | 1089.0 | 1198.2 | 728.0 | 5002.9 | Winter | 12.7 | 12.4 | 9.8 | 4.4 | 62.1 | |||
| Spring | 800.7 | 379.6 | 702.0 | 251.4 | 1555.3 | Spring | 6.2 | 3.6 | 4.9 | 2.9 | 16.6 | |||
| Ti | Summer | 13.3 | 11.6 | 10.5 | 7.1 | 61.2 | Zn | Summer | 223.3 | 127.4 | 185.8 | 48.5 | 622.9 | |
| Autumn | 15.3 | 16.7 | 9.7 | 6.7 | 78.8 | Autumn | 249.1 | 67.9 | 248.3 | 115.3 | 331.7 | |||
| Winter | 12.7 | 8.3 | 9.4 | 5.4 | 32.7 | Winter | 297.1 | 115.8 | 257.8 | 145.8 | 513.2 | |||
| Spring | 13.2 | 6.1 | 12.4 | 6.2 | 23.8 | Spring | 297.1 | 115.8 | 257.8 | 145.8 | 513.2 | |||
| V | Summer | 10.7 | 4.3 | 9.3 | 5.5 | 20.9 | As | Summer | 1.5 | 0.5 | 1.5 | 1.0 | 2.3 | |
| Autumn | 9.9 | 3.7 | 9.7 | 5.6 | 16.8 | Autumn | 2.0 | 0.6 | 2.2 | 1.1 | 2.3 | |||
| Winter | 11.0 | 4.1 | 10.2 | 6.2 | 19.4 | Winter | 1.9 | 0.5 | 2.1 | 1.1 | 2.4 | |||
| Spring | 9.3 | 3.2 | 9.3 | 5.1 | 17.0 | Spring | 1.5 | 0.7 | 1.3 | 0.5 | 3.1 | |||
| Cr | Summer | 8.5 | 3.4 | 8.6 | 2.9 | 14.2 | Sr | Summer | 1.9 | 1.0 | 1.8 | 0.9 | 4.7 | |
| Autumn | 9.5 | 4.7 | 8.5 | 4.5 | 22.3 | Autumn | 3.4 | 3.9 | 2.3 | 1.1 | 12.9 | |||
| Winter | 7.4 | 2.5 | 6.6 | 3.3 | 13.1 | Winter | 4.2 | 5.7 | 2.4 | 1.1 | 21.8 | |||
| Spring | 6.7 | 2.9 | 5.5 | 4.1 | 14.2 | Spring | 1.5 | 0.6 | 1.7 | 0.7 | 2.5 | |||
| Mn | Summer | 7.1 | 7.4 | 5.7 | 1.7 | 39.2 | Ba | Summer | 20.8 | 13.4 | 17.3 | 6.2 | 53.3 | |
| Autumn | 5.8 | 2.2 | 4.9 | 2.3 | 11.7 | Autumn | 26.6 | 12.8 | 25.3 | 7.2 | 51.6 | |||
| Winter | 6.7 | 3.1 | 6.2 | 2.4 | 14.5 | Winter | 29.5 | 11.1 | 29.1 | 7.6 | 49.2 | |||
| Spring | 5.3 | 2.5 | 5.0 | 2.0 | 11.6 | Spring | 27.5 | 23.5 | 18.3 | 6.4 | 84.7 | |||
| Fe | Summer | 195.2 | 142.4 | 154.9 | 63.3 | 697.2 | Pb | Summer | 14.4 | 10.0 | 11.9 | 3.6 | 42.6 | |
| Autumn | 189.4 | 62.9 | 187.2 | 107.5 | 362.8 | Autumn | 14.5 | 4.3 | 14.5 | 6.9 | 22.3 | |||
| Winter | 198.2 | 141.6 | 159.9 | 100.1 | 752.3 | Winter | 19.9 | 9.4 | 17.2 | 7.6 | 35.3 | |||
| Spring | 177.9 | 100.7 | 150.7 | 65.3 | 415.9 | Spring | 17.8 | 14.3 | 15.2 | 4.3 | 58.2 | |||
Seasonal correlation of PM2.5 concentrations and meteorological data
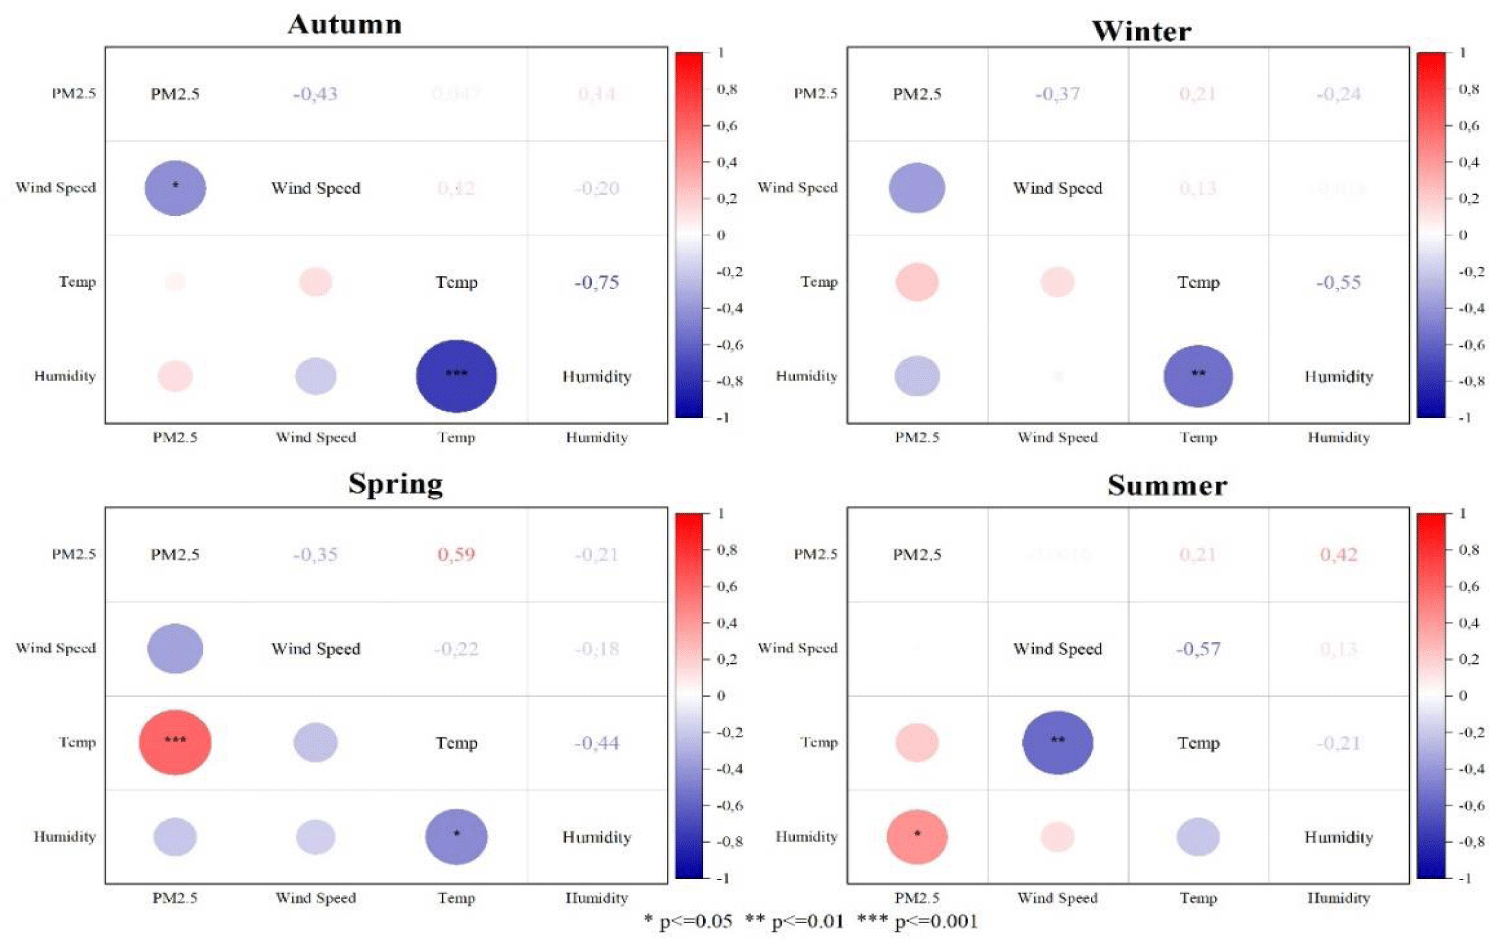
Since the Pearson’s correlation is much more sensitive to extreme values and it is considered as a parametric test, the seasonal correlation between PM2.5 and meteorological (temperature, humidity, and wind speed), during the sampling period, was carried out using Spearman’s correlation [49]. All analyses were performed using Origin Lab software (version 2021). The obtained correlation matrixes for p-value equal to 0.05, 0.01, and 0.001 are illustrated in figure 6.
Results indicate that the correlation between PM2.5 and meteorological parameters differs from one season to another. So, in autumn, there is a significant negative correlation between PM2.5 and wind speed (r = -0.43). As known, the wind speed plays an important role in the purification of the atmosphere, the greater the wind speed, the greater the dispersion of pollutants, the greater the effects of dilution and transport of particles, hence a lower mass concentration [50].
In spring, PM2.5 mass concentrations were positively correlated with temperature with a correlation coefficient equal to 0.59. Temperature is a parameter that can influence the formation of particles; in fact, the air temperature affects the movement of the air and thus the dispersion of atmospheric pollution [51,52]. For the present study, the highest influence of temperature on PM2.5 mass concentrations was observed only during the spring season and not for the other season.
In summer, the results of the correlation analysis showed a positive correlation between PM2.5 mass concentrations and humidity (r = 0.42). Several studies have shown that humidity is an important meteorological parameter that can affect the particle mass concentrations in the air [53,54]. High humidity can lead to the accumulation of particles which can result in the formation of haze and the reduction of visibility in urban areas [55-58].
Enrichment factor of elements in PM2.5
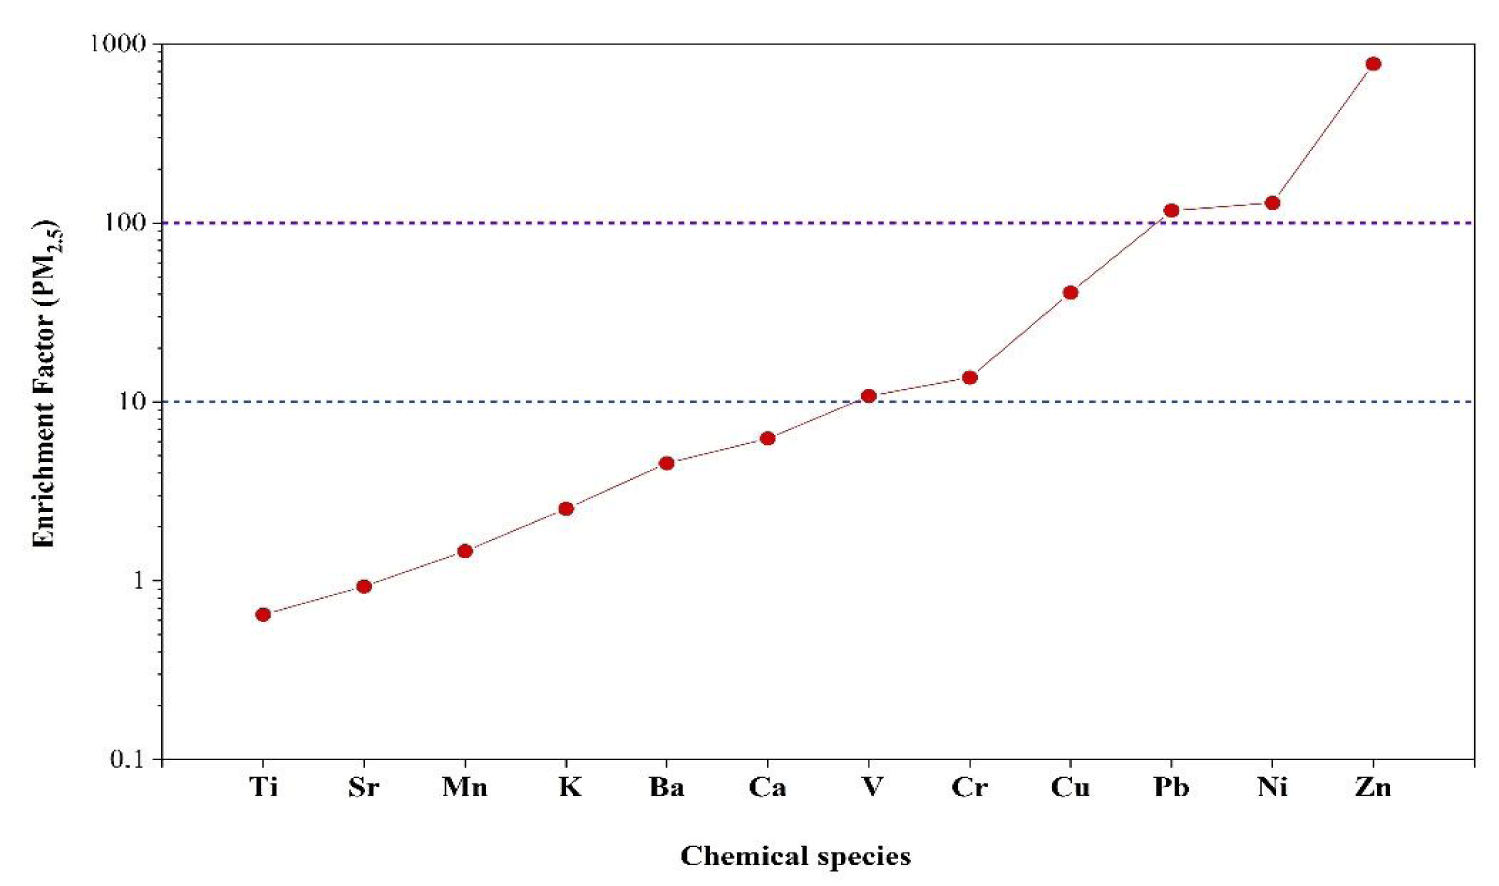
Figure 7 shows the calculated EF values of K, Ca, Mn, Ti, V, Cr, Cu, Ni, Zn, Sr, Pb, and Ba during the sampling period in Sale City.
The results showed that during the sampling period in Sale City, the EF values of Ti, Sr, Mn, K, Ca and Ba were all inferior to 10, obviously indicating that these elements came predominantly from natural sources mainly airborne dust. The EF values of V, Cu, Cr were between 10 and 100, suggesting contributions from both natural and anthropogenic sources. However, EF values of Ni, Zn, and Pb were superior to 100, indicating the dominance of anthropogenic sources such as traffic, coal burning, and so on [47,59].
Assessment of source contributions using Positive Matrix Factorization (PMF)
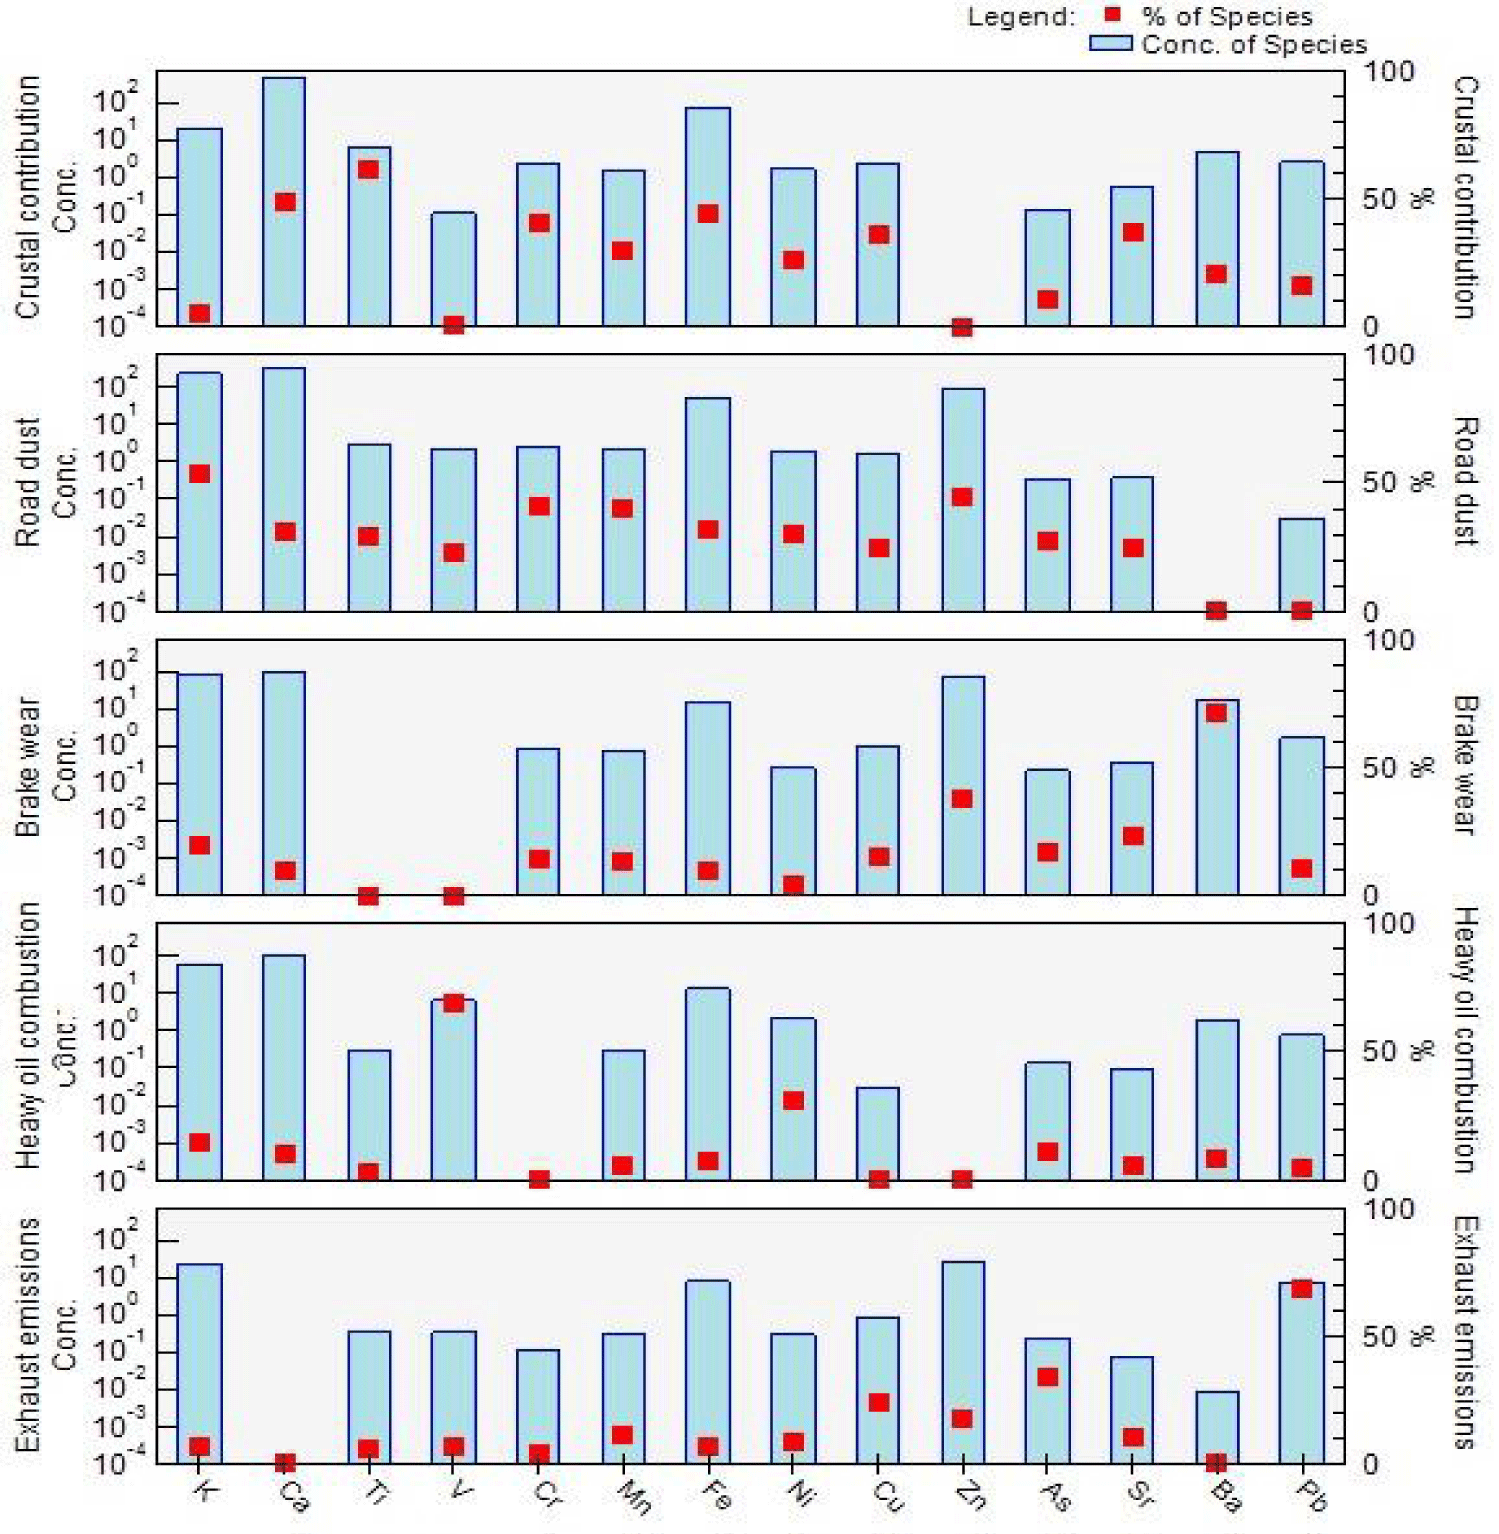
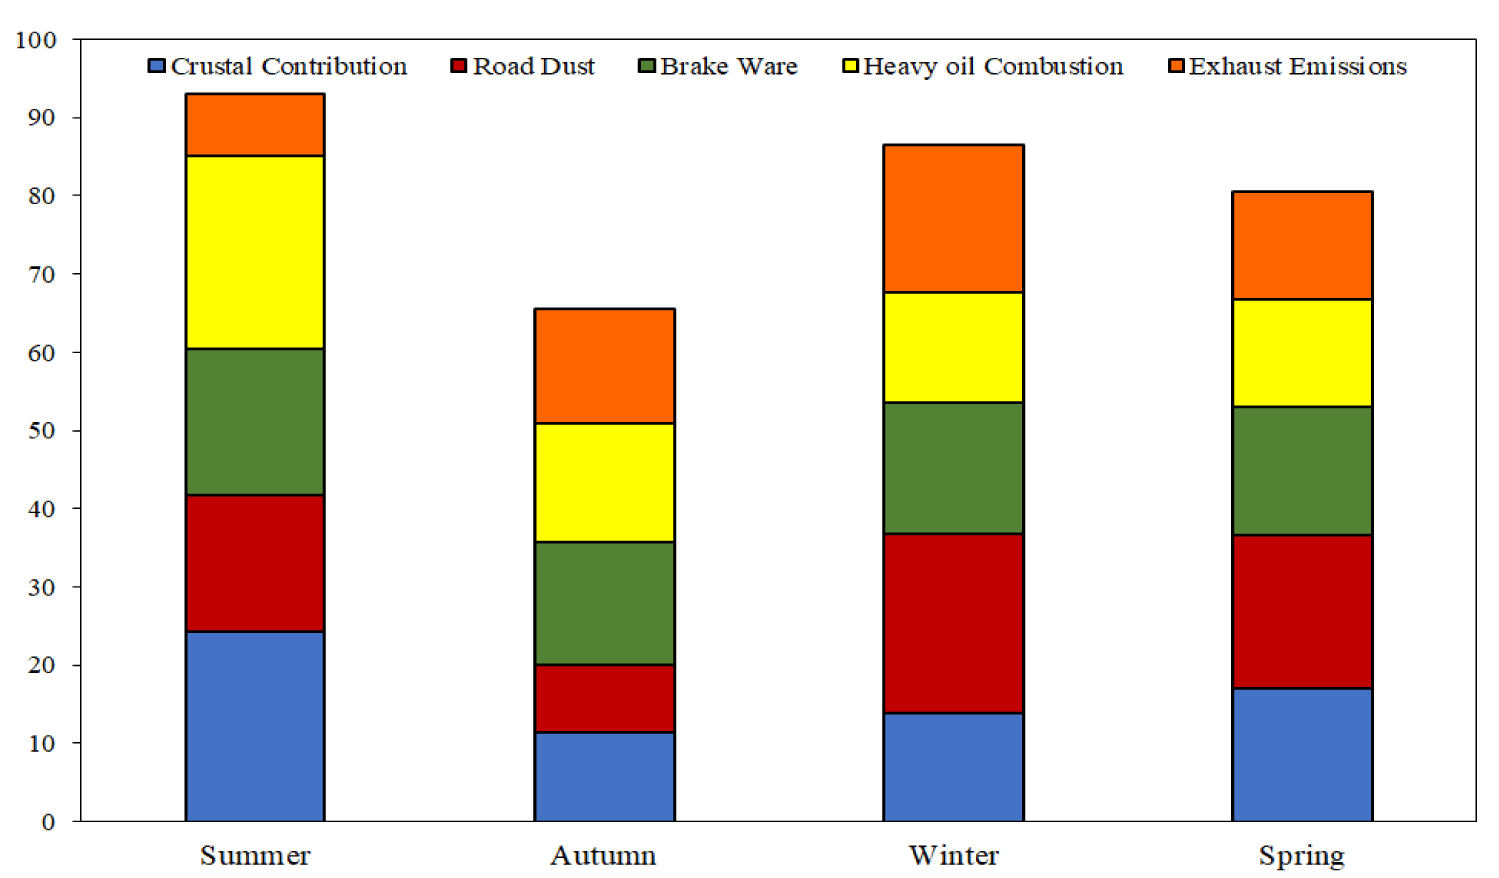
PMF analysis is a receptor model used to evaluate the contribution of the emission sources to the PM2.5 mass concentrations. The source profiles and contributions of each source obtained for the present study are illustrated in figures 8,9 respectively. The seasonal source contributions to PM2.5 mass are presented in figure 10. Detailed discussion on each source factor and its relative contributions are presented in the following sections.
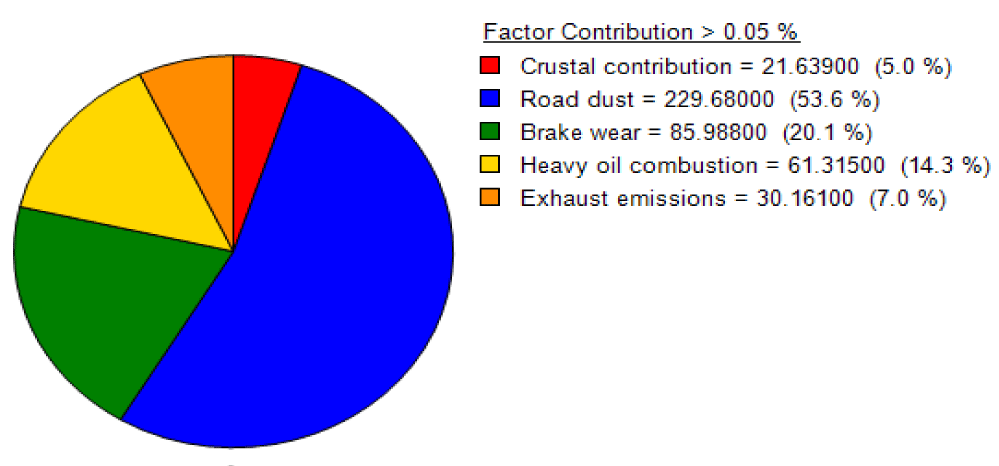
The chemical profile of Factor 1 is mainly defined by Ca, Ti, Mn Fe, and Sr. These elements are commonly generated from crustal sources precisely soil dust [56,60]. These elements are considered from crustal origin as confirmed also by the enrichment factor (Figure 7). Therefore, Factor 1 is viewed as soil dust, and its contribution to PM2.5 mass concentrations is about 5% (Figure 9). The maximum seasonal contribution of this source to the total PM2.5 was in summer followed by spring, winter, and autumn (Figure 10).
The second Factor was related to the resuspension of road dust dominated by the earth’s crust elements [61,62]. Road dust consists of loose soil on broken or unpaved roads, particles that are deposited on the road after being emitted from the vehicle’s tailpipes [63]. This Factor contributed by 53.6% to PM2.5 mass concentrations and presented the higher contribution; this could be due to the proximity of the sampling site of the road axis. The seasonal contribution of this factor was the highest in winter (Figure 10) which could be related to the meteorological conditions characterized by low wind speed and high humidity during this season (Figure 5).
The principal elements characterizing the third Factor are Zn and Ba which are related to brake wear. Non-Exhaust gas Emissions (NEE) from road traffic represent particles emitted into the air as a result of brake wear, tire wear, road surface wear, and the resuspension of road dust during the use of vehicles on the road [64]. The contribution of this factor to PM2.5 mass concentrations was 20.1%. For the present study, the sampling site is located near a road axis that is not well paved, in addition, several cars are parked on both sides of the road which could explain the emission of these elements. This factor contributed by 20.1% to PM2.5 mass concentrations. Comparison of the seasonal source contributions shows that summer had a slightly higher value, followed by winter, spring, and autumn (Figure 10).
Factor 4 was mainly presented by V and Ni. The typical association of V and Ni reflects emissions related to the combustion of heavy oil [65-67]. Ni and V were widely used as markers for oil combustion in many studies like that of Lee HJ, et al. [68]; Khodeir M, et al. [69]; Yu L, et al. [70] and Khan JZ, et al. [71]. The high levels of Ni and V in this source, compared to the other sources, indicate the contribution of ship and/or industrial combustion emissions [72,73]. Considering the result of backward trajectories indicating that air masse trajectories arriving at our receptor site in Sale City are mainly affected by air masses transported from the Atlantic Ocean (Figure 3), we could relate Factor 4 to the contribution of ship emissions. The contribution of this factor to PM2.5 mass concentrations is 14.3%. Regarding the seasonal trends of factor contributions, summer had an observably high value, followed by autumn, winter, and spring (Figure 10).
The last factor was recognized as vehicle exhaust emissions, with the relatively high loading of Cu; As, Zn and Pb. Cu and Zn are usually used as an additive in lubricating oils [74,75]. Even if since 2009, only two fuels are marketed through the national service station network in Morocco (diesel 50 ppm and unleaded super), Pb remains as even present in crude oil [76,77]. The contribution of this factor to PM2.5 mass concentrations was 7%. The maximum seasonal contribution was during winter while the minimum was in summer (Figure 10). This could be attributed to meteorological conditions reported during winter (Figure 5) that were favorable to the accumulation of pollutants and limits their dispersion.
Factors 2, 3, and 5 can all be classified as traffic emissions. Thereby, traffic could be considered as the main contributor to ambient PM2.5 air pollution in the Sale City; supporting the statistics published by the Secretariat of State at the Ministry of Energy Transition and Sustainable Development indicating that road traffic emissions would account for 50 to 60% of total emissions in Morocco [78].
Comparison of the present study with a list of studies using the PMF model to evaluate PM2.5 source apportionment
In 2015, Karagulian F, et al [79] published a study which consisted of a global review of Source Apportionment studies (SA) of ambient PM conducted in different cities around the world during the period 1990-2014. According to this study, most SA studies were carried out in the Northern, Western and Southern Europe regions, followed by USA and China. While very few SA studies were carried out in the African regions. 14 model receptors were identified in these studies and the PMF model was the most used with a record of 45% compared to other models.
In 2020, this study was updated, and a new compilation was made by Hopke PK, et al. [80] including more recent studies published between 2014 and 2019. This study also contains a comparison of different source types and recommendations on how to conduct SA studies and improve the quality of the used data.
In table 5, we have reported a comparison of the present study with other SA studies using the PMF model in different cities and sites across the world. The sources were grouped into 8 categories: traffic, dust (mineral and resuspended), industry, oil combustion, biomass burning, sea salt, secondary aerosols (sulfates and nitrates), and others. More details and information on each category are available in the supplementary material.
| Table 5: Comparison of source attribution percentage to PM2.5 mass concentrations by source category between the present study and other studies around the world. | |||||||||||||
| Country | City | Site Type | Sampling period | PM2.5 (µg/m3) | Identified PMF sources (% contribution) | References | |||||||
| Traffic | Soil Dust | Industry | Oil Combustion | Biomass Burning | Sea Salt | Secondary Aerosol | Other | ||||||
| Morocco | Sale | Urban | Jul 2018-Jul 2019 | 17.3 | 80.7 | 7.0 | - | 14.3 | - | - | - | - | This study |
| India | Delhi | Urban | Jan 2013-Dec 2014 | 122.0 | - | 20.5 | 6.2 | 13.7 | 14.3 | 4.3 | 21.3 | - | [8] |
| Italy | Florence | Urban | Mar 2009-Mar 2010 | 15.5 | 8.0 | 14.0 | - | - | 29.0 | 3.0 | 37.0 | 9.0 | [81] |
| Traffic | 23.4 | 33.0 | 11.0 | - | - | 16.0 | 3.0 | 29.0 | 8.0 | ||||
| Iran | Tehran | Residential | May 2012-Jun 2013 | 30.9 | 48.8 | 2.8 | 17.4 | - | 3.0 | - | 28.1 | - | [82] |
| Tehran | Traffic | 33.2 | 49.3 | 8.2 | 1.8 | - | 16.1 | - | 24.1 | - | |||
| Costa Rica | Moravia | Residential | June 2010-July 2011 | 18.0 | 28.9 | 21.7 | - | - | - | 11.3 | 38.1 | - | [83] |
| Saudi Arabia | Rabigh | Urban | May-June, 2013 | 37.0 | 13.4 | 39.9 | 14.7 | 19.9 | - | 12.1 | - | - | [84] |
| Greece | Patras | Suburban | Oct - Nov, 2018 Feb-June, 2019 |
12.4 | 25.0 | 10.0 | - | - | 15.0 | 5 | 34.0 | 11.0 | [85] |
| Zagreb | Croatia | Urban | Jan – Dec, 2013 | 21.9 | 21.0 | 7.0 | 10.0 | 28.0 | - | 34.0 | - | [86] | |
| Budapest | Hungary | Urban | Feb - May, 2015 | 17.4 | 19.0 | 23.0 | - | - | 24.0 | - | 22.0 | 12.0 | [86] |
| Japan | Nigata | Rural | May 2015-Feb 2017 | 12.3 | 4.0 | 13.2 | 0.5 | - | 18.2 | 10.2 | 44.4 | 8.8 | [87] |
| Mongolia | Ulaanbaatar | Urban | 2014-2016 | 92.8 | 31.0 | 31.0 | - | 11.0 | 27.0 | - | - | - | [88] |
| Nigeria | Nairobi | Urban | May 2008-Apr 2010 | 21.0 | 39.0 | 35.0 | 7.0 | - | 13.5 (mixture factor: BB + secondary aerosol+ aged sea salt) |
4.0 | [89] | ||
| Suburban | Apr 2009-Mar 2010 | 13.0 | |||||||||||
| Ghana | Accra | Semi-urban | Feb – Aug, 2008 | 21.6 | 39.1 | 18.0 | 11.0 | 9.5 | 22.2 | [90] | |||
From table 5, a significant difference could be observed in PM2.5 concentrations across the 13 compared cities and sites. The lowest values of PM2.5 were recorded in suburban and rural sites. For the contribution of sources identified by the PMF model, traffic and soil dust were the main contributors to urban PM2.5 mass concentrations.
From table 5, a significant difference could be observed in PM2.5 concentrations across the 13 compared cities and sites. The highest annual PM2.5 concentrations were reported in Delhi in India (122 µg/m3) and Ulaanbaatar in Mongolia (92.8 µg/m3); while the lowest values were observed in Nigata in Japan (12.3 µg/m3) and Greece (12.4 µg/m3). The contribution by source categories varied across regions. On our site, traffic was the main and dominant contributor to PM2.5 mass concentrations (81%), as was the case in Florence (33%), Tehran (49%), Ulaanbaatar (31%), Nairobi (39%), and Accra (39%).
The number of identified and characterized sources differs from one region to other. This is mainly related to the number of species used as input in the PMF model. For the most cited studies in table 5, more than one type of species was analyzed and used as the input matrix in the PMF model: major and trace elements, anions, cations, organic carbon, elemental carbon, black carbon. Unfortunately, in our present study, the absence of data on the different type of species (such anionic composition as well as OC and EC concentrations) makes it impossible to identify other possible sources such as sea salt and/or biomass burning which could also be contributing sources in our receptor site. Nerveless, it should be noted that the present study is the first source apportionment of PM2.5 carried out in Sale City and the obtained results could provide important information and inputs for furthermore detailed and completed studies for better quantification and identification of source apportionment in this City.
Conclusion
PM2.5 particles were sampled in an urban area of Sale City, in Morocco, from July 2018 to July 2019 and elemental characterization and source apportionment using the PMF receptor model were studied in this paper. The results showed that the PM2.5 mass concentrations vary, during the sampling period, from 3.08 µg/m3 to 49.48 µg/m3 with an average of 17.30 µg/m3. Considering the limit value fixed by WHO, the highest number of exceedance days were recorded during the winter season (with a percentage of 63%), while the lowest number of exceedance days with a percentage of 38% was observed during the spring season.
The influence of atmospheric transport scenarios on the levels of PM was carried out using air mass back-trajectories, using the HYSPLIT™ model. This study allowed identifying four main clusters arriving at our receptor site in Sale City: Iberian Coast (24%), Near Atlantic Ocean (33%), Local (28%), and Oceanic (15%).
The seasonal variations of PM2.5 concentrations decreased in the order of winter (22.17 µg/m3) > Autumn (17.52 µg/m3) > Spring (16.60 µg/m3) > Summer (14.92 µg/m3). Spearman’s correlation analysis showed that temperature and humidity had a positive correlation with PM2.5 respectively in spring and summer, while wind speed was negatively correlated to PM2.5 in winter. For seasonal variations of metal concentrations, K, Ca, V, Mn, Fe, Ni, Cu, Zn, As, Sr, Ba, and Pb exhibited their highest concentrations during winter while Ti and Cr, their highest concentrations were observed during Autumn.
The EF value of Ti, Sr, Mn, K, Ca, and Ba were less than 10 indicating that these elements are mainly originated from airborne dust. The EF values of V, Cu, Cr were between 10 and 100, suggesting contributions from both natural and anthropogenic sources. However, EF values of Ni, Zn, and Pb were superior to 100, indicating an anthropogenic origin.
The comparison of the seasonal source contributions shows that the maximum seasonal contribution for sources identified as road dust and vehicle exhaust emissions was higher in winter; while for those identified as soil dust, brake wear and oil combustion were higher in summer.
The results of this paper should be the subject of more investigations because of the limitations of the number of species used as the input matrix in the source apportionment analysis. Additional information about anionic components as well as organic and elemental carbon should complement the present results and may help to characterize supplementary sources that have not been identified by the tracers measured in this study.
Acknowledgments
Funding
This work was supported by the International Atomic Energy Agency (IAEA) under the regional project RAF 7016 untitled: “Establishing and Improving Air Pollution Monitoring”.
Data availability
The datasets generated during and/or analyzed during the current study are available from the corresponding author on reasonable request.
Ethics approval
Not applicable.
Consent to participate
Not applicable.
Consent for publication
Not applicable.
Competing interests
The authors declare no competing interests.
References
- Health Effects Institute. State of Global Air. Special Report. Boston, MA: Health Effects Institute; 2020.
- World Health Organization. WHO’s Urban Ambient Air Pollution Database-Update. 2016.
- Wang J, Xing J, Mathur R, Pleim JE, Wang S, Hogrefe C, Gan CM, Wong DC, Hao J. Historical Trends in PM2.5-Related Premature Mortality during 1990-2010 across the Northern Hemisphere. Environ Health Perspect. 2017 Mar;125(3):400-408. doi: 10.1289/EHP298. Epub 2016 Aug 19. PMID: 27539607; PMCID: PMC5332185.
- Li J, Liu H, Lv Z, Zhao R, Deng F, Wang C, Qin A, Yang X. Estimation of PM2.5 mortality burden in China with new exposure estimation and local concentration-response function. Environ Pollut. 2018 Dec;243(Pt B):1710-1718. doi: 10.1016/j.envpol.2018.09.089. Epub 2018 Sep 21. PMID: 30408858.
- Gadi R, Shivani, Sharma SK, Mandal TK. Source apportionment and health risk assessment of organic constituents in fine ambient aerosols (PM2.5): A complete year study over National Capital Region of India. Chemosphere. 2019 Apr;221:583-596. doi: 10.1016/j.chemosphere.2019.01.067. Epub 2019 Jan 10. PMID: 30665088.
- Lelieveld J, Klingmüller K, Pozzer A, Pöschl U, Fnais M, Daiber A, Münzel T. Cardiovascular disease burden from ambient air pollution in Europe reassessed using novel hazard ratio functions. Eur Heart J. 2019 May 21;40(20):1590-1596. doi: 10.1093/eurheartj/ehz135. PMID: 30860255; PMCID: PMC6528157.
- Shivani, Gadi R, Sharma SK, Mandal TK. Seasonal variation, source apportionment and source attributed health risk of fine carbonaceous aerosols over National Capital Region, India. Chemosphere. 2019 Dec;237:124500. doi: 10.1016/j.chemosphere.2019.124500. Epub 2019 Jul 31. PMID: 31549639.
- Sharma SK, Mandal TK, Jain S, Saraswati, Sharma A, Saxena M. Source Apportionment of PM2.5 in Delhi, India Using PMF Model. Bull Environ Contam Toxicol. 2016 Aug;97(2):286-93. doi: 10.1007/s00128-016-1836-1. Epub 2016 May 21. PMID: 27209541.
- Li J, Han X, Jin M, Zhang X, Wang S. Globally analysing spatiotemporal trends of anthropogenic PM2.5 concentration and population's PM2.5 exposure from 1998 to 2016. Environ Int. 2019 Jul;128:46-62. doi: 10.1016/j.envint.2019.04.026. Epub 2019 Apr 25. PMID: 31029979.
- Lu HY, Wu YL, Mutuku JK, Chang KH. Various sources of PM2.5 and their impact on the air quality in Tainan city, Taiwan. Aerosol and Air Quality Research. 2019;19(3):601-619. doi: 10.4209/aaqr.2019.01.0024.
- Yuan M, Song Y, Huang Y, Shen H, Li T. Exploring the association between the built environment and remotely sensed PM2.5 concentrations in urban areas. Journal of Cleaner Production. 2019;220:1014-1023. doi: 10.1016/j.jclepro.2019.02.236.
- Yue H, Huang Q, He C, Zhang X, Fang Z. Spatiotemporal patterns of global air pollution: A multi-scale landscape analysis based on dust and sea-salt removed PM2.5 data. Journal of Cleaner Production. 2020;252:119887. doi: 10.1016/j.jclepro.2019.119887.
- Jain S, Sharma SK, Srivastava MK, Chatterjee A, Vijayan N, Tripathy SS, Kumari KM, Mandal TK, Sharma C. Chemical characterization, source apportionment and transport pathways of PM2.5 and PM10 over Indo Gangetic Plain of India. Urban Climate. 2021a;36:100805. doi: 10.1016/j.uclim.2021.100805.
- Jain S, Sharma SK, Vijayan N, Mandal TK. Investigating the seasonal variability in source contribution to PM2.5 and PM10 using different receptor models during 2013-2016 in Delhi, India. Environ Sci Pollut Res Int. 2021 Jan;28(4):4660-4675. doi: 10.1007/s11356-020-10645-y. Epub 2020 Sep 18. PMID: 32946053.
- United Nations Economic Commission for Europe, UNECE. Environmental Performance Review of Morocco (Second Review).
- GBD 2016 Risk Factors Collaborators. Global, regional, and national comparative risk assessment of 84 behavioural, environmental and occupational, and metabolic risks or clusters of risks, 1990-2016: a systematic analysis for the Global Burden of Disease Study 2016. Lancet. 2017 Sep 16;390(10100):1345-1422. doi: 10.1016/S0140-6736(17)32366-8. Erratum in: Lancet. 2017 Oct 14;390(10104):1736. Erratum in: Lancet. 2017 Oct 28;390(10106):e38. PMID: 28919119; PMCID: PMC5614451.
- Croitoru L, Sarraf M. The cost of degradation of the environment in Morocco : Le Coût de la Dégradation de l’Environnement au Maroc (French). Environment and Natural Resources Global Practice Discussion Paper, no.5 Washington, D.C. World Bank Group. 2017.
- Ait Bouh H, Benyaich F, Bounakhla M, Noack Y, Tahri M, Zahry F. Seasonal variations of the atmospheric particles, and its chemical components in meknes City-Morocco. Journal of Materials and Environmental Science. 2013;4(1):49-62.
- Ait Bouh H, Benyaich F, Noack Y, Bounakhla M, Tahri M. Physical and chemical characterization of suspended atmospheric particles and source identification in town of Meknes in Morocco. Journal of Materials & Environment Science. 2012;3(3):434-445.
- Tahri M, Bounakhla M, Zghaïd M Benchrif A, Zahry F, Noack Y, Benyaïch F. TXRF characterization and source identification by positive matrix factorization of airborne particulate matter sampled in Kenitra City (Morocco). X-Ray Spectrometry Journal. 2013;42(4):284-289. doi: 10.1002/xrs.2484.
- Elass K, Eddaif A, Radey O, Aitzaouit O, Yakoubi ME, Chelhaoui Y. Effect of restricted emissions during COVID-19 lockdown on air quality in Rabat – Morocco. Global NEST Journal. 2020;22(3):348-353. doi: 10.30955/gnj.003431.
- Khomsi K, Najmi H, Amghar H, Chelhaoui Y, Souhaili Z. COVID-19 national lockdown in morocco: Impacts on air quality and public health. One Health. 2021 Jun;11:100200. doi: 10.1016/j.onehlt.2020.100200. Epub 2020 Nov 25. PMID: 33263072; PMCID: PMC7687492.
- Otmani A, Benchrif A, Tahri M, Bounakhla M, Chakir EM, El Bouch M, Krombi M. Impact of Covid-19 lockdown on PM10, SO2 and NO2 concentrations in Salé City (Morocco). Sci Total Environ. 2020 Sep 15;735:139541. doi: 10.1016/j.scitotenv.2020.139541. Epub 2020 May 19. PMID: 32445829; PMCID: PMC7235599.
- Clyde WS. Standard operating procedure for air sampling for metals using the dichotomous sampler, Illinois State Water Survey. Office of Air Quality. 1993;1.
- Draxler RR, Hess GD. Description of the HYSPLIT_4 modeling system. NOAA Tech. Memo. ERL ARL-224, NOAA Air Resources Laboratory, Silver Spring; MD. 1997. p.24.
- Draxler RR, Hess GD. An overview of the HYSPLIT_4 modeling system of trajectories, dispersion, and deposition. Aust Meteor Mag. 1998;47:295-308.
- Draxler RR. HYSPLIT4 user’s guide. NOAA Tech. Memo. ERL ARL-230, NOAA Air Resources Laboratory, Silver Spring; MD. 1999.
- Stein AF, Draxler RR, Rolph GD, Stunder BJB., Cohen MD, Ngan F. NOAA’s HYSPLIT atmospheric transport and dispersion modeling system. Bulletin of the American Meteorological Society. 2015;96:2059-2077. doi: 10.1175/BAMS-D-14-00110.1.
- Yuan G, Sun P, Zhao J, Li D, Wang C. A review of moving object trajectory clustering algorithms. Artificial Intelligence Review. 2016;47:123-144. doi: 10.1007/s10462-016-9477-7.
- Dodd JA, Ondov JM, Tuncel G Dzubay, TG, Stevens RK. Multimodal size spectra of submicrometer particles bearing various elements in rural air. Environmental Science & Technology. 1991;25:890-903. doi: 10.1021/es00017a010.
- Das R, Khezri B, Srivastava B, Datta S, Sikdar PK, Webster RD, Wang X. Trace element composition of PM2.5 and PM10 from Kolkata – a heavily polluted Indian metropolis. Atmospheric Pollution Research. 2015;6(5):742-750. doi: 10.5094/APR.2015.083.
- Liang L, Liu N, Landis MS, Xu X, Feng X, Chen Z, Shang L, Qiu G. Chemical characterization and sources of PM2.5 at 12-hr resolution in Guiyang, China. Acta Geochimica. 2018;37(2):334-345. doi: 10.1007/s11631-017-0248-1. PMID: 31632828; PMCID: PMC6800720.
- Lin Y, Wang J. Concentrations, enrichment, and sources of metals in PM2.5 in Beijing during winter. Air Quality, Atmosphere & Health. 2020;13:5-14. doi: 10.1007/s11869-019-00763-z.
- Abulude FO, Abulude IA, Ezeh GC, Acha S. Source identification and pollution factors of elements in PM2.5 samples obtained in Akure, Ondo State, Nigeria. Research Square. 2021. doi: 10.21203/rs.3.rs-337775/v1.
- Paatero P, Tapper U. Positive matrix factorization: A non-negative factor model with optimal utilization of error estimates of data values. Environmetrics. 1994;5(2):111-126. doi: 10.1002/env.3170050203.
- Paatero P. Least squares formulation of robust non-negative factor analysis. Chemometrics and Intelligent Laboratory Systems. 1997;37:23-35. doi: 10.1016/S0169-7439(96)00044-5.
- Gupta I, Salunkhe A, Kumar R. Source apportionment of PM10 by positive matrix factorization in urban area of Mumbai, India. ScientificWorldJournal. 2012;2012:585791. doi: 10.1100/2012/585791. Epub 2012 May 3. PMID: 22645437; PMCID: PMC3356722.
- Pokorná P, Hovorka J, Krouzek J, Hopke PK. Particulate matter source apportionment in a village situated in industrial region of Central Europe. J Air Waste Manag Assoc. 2013 Dec;63(12):1412-21. doi: 10.1080/10962247.2013.825215. PMID: 24558704.
- Banerjee T, Murari V, Kumar K, Raju MP. Source apportionment of airborne particulates through receptor modeling: Indian scenario. Atmospheric Research. 2015;164-165:167-187. doi: 10.1016/j.atmosres.2015.04.017.
- Fernández-Olmo I, Andecochea C, Ruiz S, Fernández-Ferreras JA, Irabien A. Local source identification of trace metals in urban/industrial mixed land-use areas with daily PM10 limit value exceedances. Atmospheric Research. 2016;171:92-106. doi: 10.1016/j.atmosres.2015.12.010.
- Tan JH, Duan JC, Chai FH, He KB, Hao JM. Source apportionment of size segregated fine/ultrafine particle by PMF in Beijing. Atmospheric Research. 2014;139:90-100. doi: 10.1016/j.atmosres.2014.01.007.
- Paatero P, Hopke PK, Song XH, Ramadan Z. Understanding and controlling rotations in factor analytic models. Chemometrics and Intelligent Laboratory Systems. 2022;60:253-264. doi: 10.1016/S0169-7439(01)00200-3.
- Paatero P, Hopke PK. Discarding or down weighting high-noise- variables in factor analysis models. Analytica Chimica Acta. 2003; 490:277-289. doi: 10.1016/S0003-2670(02)01643-4.
- Lee E, Chan CK, Paatero P. Application of positive matrix factorization in source apportionment of particulate pollutants in Hong Kong. Atmospheric Environment. 1999;33:3201-3212. doi: 10.1016/S1352-2310(99)00113-2.
- World Health Organization. WHO global air quality guidelines: particulate matter (PM2.5 and PM10), ozone, nitrogen dioxide, sulfur dioxide, and carbon monoxide. World Health Organization. 2021.
- Hu M, Liu S, Wu ZJ, Zhang J, Zhao YL, Wehner B, Wiedensolher A. [Effects of high temperature, high relative humidity and rain process on particle size distributions in the summer of Beijing]. Huan Jing Ke Xue. 2006 Nov;27(11):2293-8. Chinese. PMID: 17326443.
- Wang X, Bi X, Sheng G, Fu J. Chemical composition and sources of PM10 and PM2.5 aerosols in Guangzhou, China. Environ Monit Assess. 2006 Aug;119(1-3):425-39. doi: 10.1007/s10661-005-9034-3. Epub 2006 Jun 2. PMID: 16741816.
- Cesari D, De Benedetto GE, Bonasoni P, Busetto M, Dinoi A, Merico E, Chirizzi D, Cristofanelli P, Donateo A, Grasso FM, Marinoni A, Pennetta A, Contini D. Seasonal variability of PM2.5 and PM10 composition and sources in an urban background site in Southern Italy. Sci Total Environ. 2018 Jan 15;612:202-213. doi: 10.1016/j.scitotenv.2017.08.230. Epub 2017 Sep 1. PMID: 28850839.
- Godish T, Davis WT, Fu JS. Air Quality, 5th ed. London: CRC Press; 2015. doi: 10.1201/b17341.
- USEPA (United States Environmental Protection Agency). Data Quality Assessment: Statistical Methods for Practitioners. EPA QA/G-9S, Office of Environmental Information Washington, 2006, DC 20460.
- Wang J, Ogawa S. Effects of Meteorological Conditions on PM2.5 Concentrations in Nagasaki, Japan. Int J Environ Res Public Health. 2015 Aug 3;12(8):9089-101. doi: 10.3390/ijerph120809089. PMID: 26247953; PMCID: PMC4555266.
- Kayes I, Shahriar SA, Hasan K, Akhter M, Kabir MM, Salam MA. The relationships between meteorological parameters and air pollutants in an Urban Environment. Global Journal of Environmental Science and Management. 2019;5(3):265-278. doi: 10.22034/gjesm.2019.03.01.
- Tian S, Pan Y, Liu Z, Wen T, Wang Y. Size-resolved aerosol chemical analysis of extreme haze pollution events during early 2013 in urban Beijing, China. J Hazard Mater. 2014 Aug 30;279:452-60. doi: 10.1016/j.jhazmat.2014.07.023. Epub 2014 Jul 21. PMID: 25106045.
- Zhang H, Wang Y, Hu J, Ying Q, Hu XM. Relationships between meteorological parameters and criteria air pollutants in three megacities in China. Environ Res. 2015 Jul;140:242-54. doi: 10.1016/j.envres.2015.04.004. Epub 2015 Apr 13. PMID: 25880606.
- Ding Y, Liu Y. Analysis of long-term variations of fog and haze in China in recent 50 years and their relations with atmospheric humidity. Science China Earth Sciences. 2014;57:36-46. doi: 10.1007/s11430-013-4792-1.
- Liu R, Wang M, Chen W, Peng C. Spatial pattern of heavy metals accumulation risk in urban soils of Beijing and its influencing factors. Environ Pollut. 2016 Mar;210:174-81. doi: 10.1016/j.envpol.2015.11.044. Epub 2015 Dec 21. PMID: 26716731.
- Gao J, Tian H, Cheng K, Lu L, Zheng M, Wang S, Hao J, Wang K, Hua S, Zhu C. The variation of chemical characteristics of PM2.5 and PM10 and formation causes during two haze pollution events in urban Beijing, China. Atmospheric Environment. 2015;107:1-8. doi: 10.1016/j.atmosenv.2015.02.022.
- Lin, GY, Lee GR, Lin SF, Hung YH, Li SW, Wu GJ, Ye H, Huang W, Tsai CJ. Ultrafine particles and PM2.5 at three urban air monitoring stations in northern Taiwan from 2011 to 2013. Aerosol and Air Quality Research. 2015;15:2305-2319. doi: 10.4209/aaqr.2015.04.0271.
- Hernández-Mena L, Murillo-Tovar M, Ramírez-Muñíz M, Colunga-Urbina E, de la Garza-Rodríguez I, Saldarriaga-Noreña H. Enrichment Factor and profiles of elemental composition of PM 2.5 in the city of Guadalajara, Mexico. Bull Environ Contam Toxicol. 2011 Nov;87(5):545-9. doi: 10.1007/s00128-011-0369-x. Epub 2011 Aug 12. PMID: 21837390.
- Almeida-Silva M, Almeida SM, Freitas MC, Pio CA, Nunes T, Cardoso J. Impact of Sahara dust transport on Cape Verde atmospheric element particles. J Toxicol Environ Health A. 2013;76(4-5):240-51. doi: 10.1080/15287394.2013.757200. PMID: 23514066.
- Calvo AI, Alves A, Pont V, Vicente AM, Fraile R. Research on aerosol sources and chemical composition: Past, current, and emerging issues. Atmospheric Research. 2013;120-121:1-28. doi: 10.1016/j.atmosres.2012.09.021.
- Bressi M, Sciare J, Ghersi V, Mihalopoulos N, Petit JE, Nicolas JB, Moukhtar S, Rosso A, Feron A, Bonnaire N, Poulakis E, Theodosi C. Sources, and geographical origins of fine aerosols in Paris (France). Atmospheric Chemistry and Physics. 2014;14:8813-8839. doi: 10.5194/acp-14-8813-2014.
- Keuken M, Denier van der Gon H, van der Valk K. Non-exhaust emissions of PM and the efficiency of emission reduction by road sweeping and washing in the Netherlands. Sci Total Environ. 2010 Sep 15;408(20):4591-9. doi: 10.1016/j.scitotenv.2010.06.052. Epub 2010 Jul 11. PMID: 20627203.
- Grigoratos T, Martini G. Brake wear particle emissions: a review. Environ Sci Pollut Res Int. 2015 Feb;22(4):2491-504. doi: 10.1007/s11356-014-3696-8. Epub 2014 Oct 17. PMID: 25318420; PMCID: PMC4315878.
- Jang HN Seo YC, Lee .H, Hwang KW, Yoo JI, Sok CH, Kim SH. Formation of fine particles enriched by V and Ni from heavy oil combustion: Anthropogenic sources and drop-tube furnace experiments. Atmospheric Environment. 2007;41(5):1053-1063. doi: 10.1016/J.ATMOSENV.2006.09.011.
- Becagli S, Sferlazzo DM, Pace G, Di Sarra A, Bommarito C, Calzolai G, Ghedini C, Lucarelli F, Meloni D, Monteleone F, Severi M, Traversi R, Udisti R. Evidence for heavy fuel oil combustion aerosols from chemical analyses at the island of Lampedusa: A possible large role of ships emissions in the Mediterranean. Atmospheric Chemistry and Physics. 2012;12(7):3479. doi: 10.5194/acp-12-3479-2012.
- Viana M, Hammingh P, Colette A, Querol X, Degraeuwe B, de Vlieger I, Aardenne J. Impact of maritime transport emissions on coastal air quality in Europe. Atmospheric Environment. 2014;90:96-105. doi: 10.1016/j.atmosenv.2014.03.046.
- Lee HJ, Gent JF, Leaderer BP, Koutrakis P. Spatial and temporal variability of fine particle composition and source types in five cities of Connecticut and Massachusetts. Sci Total Environ. 2011 May 1;409(11):2133-42. doi: 10.1016/j.scitotenv.2011.02.025. Epub 2011 Mar 22. PMID: 21429560; PMCID: PMC3269973.
- Khodeir M, Shamy M, Alghamdi M, Zhong M, Sun H, Costa M, Chen LC, Maciejczyk P. Source Apportionment and Elemental Composition of PM2.5 and PM10 in Jeddah City, Saudi Arabia. Atmos Pollut Res. 2012 Jul 1;3(3):331-340. doi: 10.5094/apr.2012.037. PMID: 24634602; PMCID: PMC3951168.
- Yu L, Wang G, Zhang R, Zhang L, Song Y, Wu B, Li X, An K, Chu J. Characterization and source apportionment of PM2.5 in an urban environment in Beijing. Aerosol and Air Quality Research .2013;13:574-583. doi: 10.4209/aaqr.2012.07.0192.
- Khan JZ, Sun L, Tian Y, Shi G, Feng Y. Chemical characterization and source apportionment of PM1 and PM2.5 in Tianjin, China: Impacts of biomass burning and primary biogenic sources. J Environ Sci (China). 2021 Jan;99:196-209. doi: 10.1016/j.jes.2020.06.027. Epub 2020 Jul 7. PMID: 33183697.
- Liao HT, Chou CC, Chow JC, Watson JG, Hopke PK, Wu CF. Source and risk apportionment of selected VOCs and PM₂.₅ species using partially constrained receptor models with multiple time resolution data. Environ Pollut. 2015 Oct;205:121-30. doi: 10.1016/j.envpol.2015.05.035. Epub 2015 Jun 6. PMID: 26057474.
- Lang J, Zhou Y, Chen D, Xing X, Wei L, Wang X, Zhao N, Zhang Y, Guo X, Han L, Cheng S. Investigating the contribution of shipping emissions to atmospheric PM2.5 using a combined source apportionment approach. Environ Pollut. 2017 Oct;229:557-566. doi: 10.1016/j.envpol.2017.06.087. Epub 2017 Jul 6. PMID: 28688306.
- Lough GC, Schauer JJ, Park JS, Shafer MM, Deminter JT, Weinstein JP. Emissions of metals associated with motor vehicle roadways. Environ Sci Technol. 2005 Feb 1;39(3):826-36. doi: 10.1021/es048715f. PMID: 15757346.
- Mooibroek D, Schaap M, Weijers EP, Hoogerbrugge R. Source apportionment and spatial variability of PM2.5 using measurements at five sites in the Netherlands. Atmospheric Environment. 2011;45:4180-4191. doi: 10.1016/j.atmosenv.2011.05.017.
- Pacyna, J.M. Source Inventories for Atmospheric Trace Metals. In: Harrison RM, van Grieken RE, editors. Atmospheric Particles, IUPAC Series on Analytical and Physical Chemistry of Environmental Systems. Chichester: Wiley; 1998;5:385-423.
- Xu HM, Cao JJ, Ho KF, Ding H, Han YM, Wang GH, Chow JC, Watson JG, Khol SD, Qiang J, Li WT. Lead concentrations in fine particulate matter after the phasing out of leaded gasoline in Xi’an, China. Atmospheric Environment. 2012;46:217-224. doi: 10.1016/j.atmosenv.2011.09.078.
- Inchaouh M, Tahiri M. Air Pollution due to road transportation in Morocco: Evolution and impacts. Journal of Multidisciplinary Engineering Science and Technology. 2017;4(6):7547‐7553.
- Karagulian F, Belis CA, Dora CFC, Prüss-Ustün A., Bonjour S, Adair-Rohani H, Amann M. Contributions to cities' ambient particulate matter (PM): A systematic review of local source contributions at global level. Atmospheric Environment. 2015;120:475-483. doi: 10.1016/j.atmosenv.2015.08.087.
- Hopke PK, Dai Q, Li L, Feng Y. Global review of recent source apportionments for airborne particulate matter. Sci Total Environ. 2020 Oct 20;740:140091. doi: 10.1016/j.scitotenv.2020.140091. Epub 2020 Jun 9. PMID: 32559544; PMCID: PMC7456793.
- Nava S, Calzolai G, Chiari M, Giannoni M, Giardi F, Becagli S, Severi M, Traversi R, Lucarelli F. Source apportionment of PM2.5 in Florence (Italy) by PMF analysis of aerosol composition records. Atmosphere. 2020;11(5):484. doi: 10.3390/atmos11050484.
- Taghvaee S, Sowlat MH, Mousavi A, Hassanvand MS, Yunesian M, Naddafi K, Sioutas C. Source apportionment of ambient PM2.5 in two locations in central Tehran using the Positive Matrix Factorization (PMF) model. Sci Total Environ. 2018 Jul 1;628-629:672-686. doi: 10.1016/j.scitotenv.2018.02.096. Epub 2018 Feb 20. PMID: 29455128.
- Murillo JH, Román SR, Marín JF, Ramos AC, Jiménez SB, González BC, Baumgardner D. Chemical characterization and source apportionment of PM10 and PM2.5 in the metropolitan area of Costa Rica, Central America. Atmospheric Pollution Research. 2013;4:181-190. doi: 10.5094/APR.2013.018.
- Nayebare SR, Aburizaiza OS, Khwaja HA, Siddique A, Hussain MM, Zeb J, Khatib F, Carpenter DO, Blake DR. Chemical characterization and source apportionment of PM2.5 in Rabigh, Saudi Arabia. Aerosol and Air Quality Research. 2016;16:3114-3129. doi: 10.4209/aaqr.2015.11.0658.
- Manousakas MI, Florou K, Pandis SN. Source Apportionment of fine organic and inorganic atmospheric aerosol in an urban background area in Greece. Atmosphere. 2020;11(4):330. doi: 10.3390/atmos11040330.
- Perrone MG, Vratolis S, Georgieva E, Török S, Šega K, Veleva B, Osán J, Bešlić I, Kertész Z, Pernigotti D, Eleftheriadis K, Belis CA. Sources and geographic origin of particulate matter in urban areas of the Danube macro-region: The cases of Zagreb (Croatia), Budapest (Hungary) and Sofia (Bulgaria). Sci Total Environ. 2018 Apr 1;619-620:1515-1529. doi: 10.1016/j.scitotenv.2017.11.092. Epub 2017 Dec 11. PMID: 29734626; PMCID: PMC5821697.
- Li P, Sato K, Hasegawa H, Huo M, Minoura H, Inomata Y, Take N, Yuba A, Futami M, Takahashi T, Kotake Y. Chemical characteristics and source apportionment of PM2.5 and long-range transport from Northeast Asia Continent to Niigata in Eastern Japan. Aerosol and Air Quality Research. 2018;18:938-956. doi: 10.4209/aaqr.2017.05.0181.
- Gunchin G, Manousakas M, Osan J, Karydas AG, Eleftheriadis K, Lodoysamba S, Shagjjamba D, Migliori A, Padilla-Alvarez R, Streli C, Darby I. Three-year long source apportionment study of airborne particles in ulaanbaatar using X-ray fluorescence and positive matrix factorization. Aerosol and Air Quality Research. 2019;19:1056-1067. doi: 10.4209/aaqr.2018.09.0351.
- Gaita SM, Boman J, Gatari MJ, Pettersson JBC, Janhäll S. Source apportionment and seasonal variation of PM2.5 in a Sub-Saharan African city: Nairobi, Kenya. Atmospheric Chemistry and Physics. 2014;14:9977-9991. doi: 10.5194/acp-14-9977-2014.
- Ofosu FG, Hopke PK, Aboh IJK, Bamford SA. Characterization of fine particulate sources at ashaiman in Greater Accra, Ghana. Atmospheric Pollution Research. 2012;3:301-310. doi: 10.5094/APR.2012.033.
Content Alerts
SignUp to our
Content alerts.
 This work is licensed under a Creative Commons Attribution 4.0 International License.


