Environmental Sciences . 2023 May 31;4(5):942-952. doi: 10.37871/jbres1755.
Constraining the Potential Evapotranspiration of Egypt Using the Regional Climate Model (RegCM4) and Climate Research Unit Dataset (CRU)
Samy A Anwar*
- Climate research unit
- Egypt
- Hargreaves-samani
- Regional climate model
- Potential evapotranspiration
Abstract
Accurate forecast of the Potential Evapotranspiration (PET) at a location (where station observation is not available) is necessary in arid/hyper-arid regions (e.g., Egypt) to monitor daily agricultural activities. The Penman-Monteith equation is the standard physical method to compute the PET, but it requires many variables (mostly are calculated empirically). Instead, the Hargreaves-Samani (HS) method was used because it is recommended by the Food and Agriculture Organization and it requires only two variables: global incident solar radiation and daily mean air temperature. Additionally, regional climate models (e.g., RegCM4) can be an alternative tool to estimate the PET constrained by a long-term gridded PET data (Climate Research Unit; CRU) at any location. To accomplish this task, a 39-year simulation was conducted. The RegCM4 was driven by the ERA-Interim reanalysis with 60 km grid spacing. Preliminary results indicated that the RegCM4 was able to capture the monthly variability of the simulated PET with respect to the CRU; however the model overestimates the PET particularly in the summer months (June, July and August). Over all considered locations, performance of the RegCM4 was notably improved when a linear regression model (LRM; between RegCM4 and CRU) was used (indicated by a low bias between the corrected RegCM4 and CRU). In conclusion, the RegCM4 model can accurately calculate the PET at the location of interest by means of the HS equation and a LRM either in the present climate or under different future scenarios.
Introduction
One of the water-scarce regions in the world is the Middle East and Northern Africa (MENA; [1]). According to the Fourth Assessment Report of the Intergovernmental Panel on Climate Change (IPCC; [2]), it has been expected that considerable changes in the MENA’s climate will occur. Particularly, potential evapotranspiration (PET) will show a high positive anomaly (with respect the reference period) as a result of temperature increase in the region as reported by [3,4] . For this reason, Terink W, et al. [1] made a special focus on the combination of supply (represented by the total precipitation) and demand (represented by the PET) to possibly detect critical periods with regard to water availability. Therefore, it is important to accurately calculate the PET to such issue. It has been reported that the Penman-Monteith method (PM; [5]) is the standard model to compute the PET on hierarchy of time scales (ranging from hours to annual) because it is based on the physical exchange between the surface and the atmosphere.
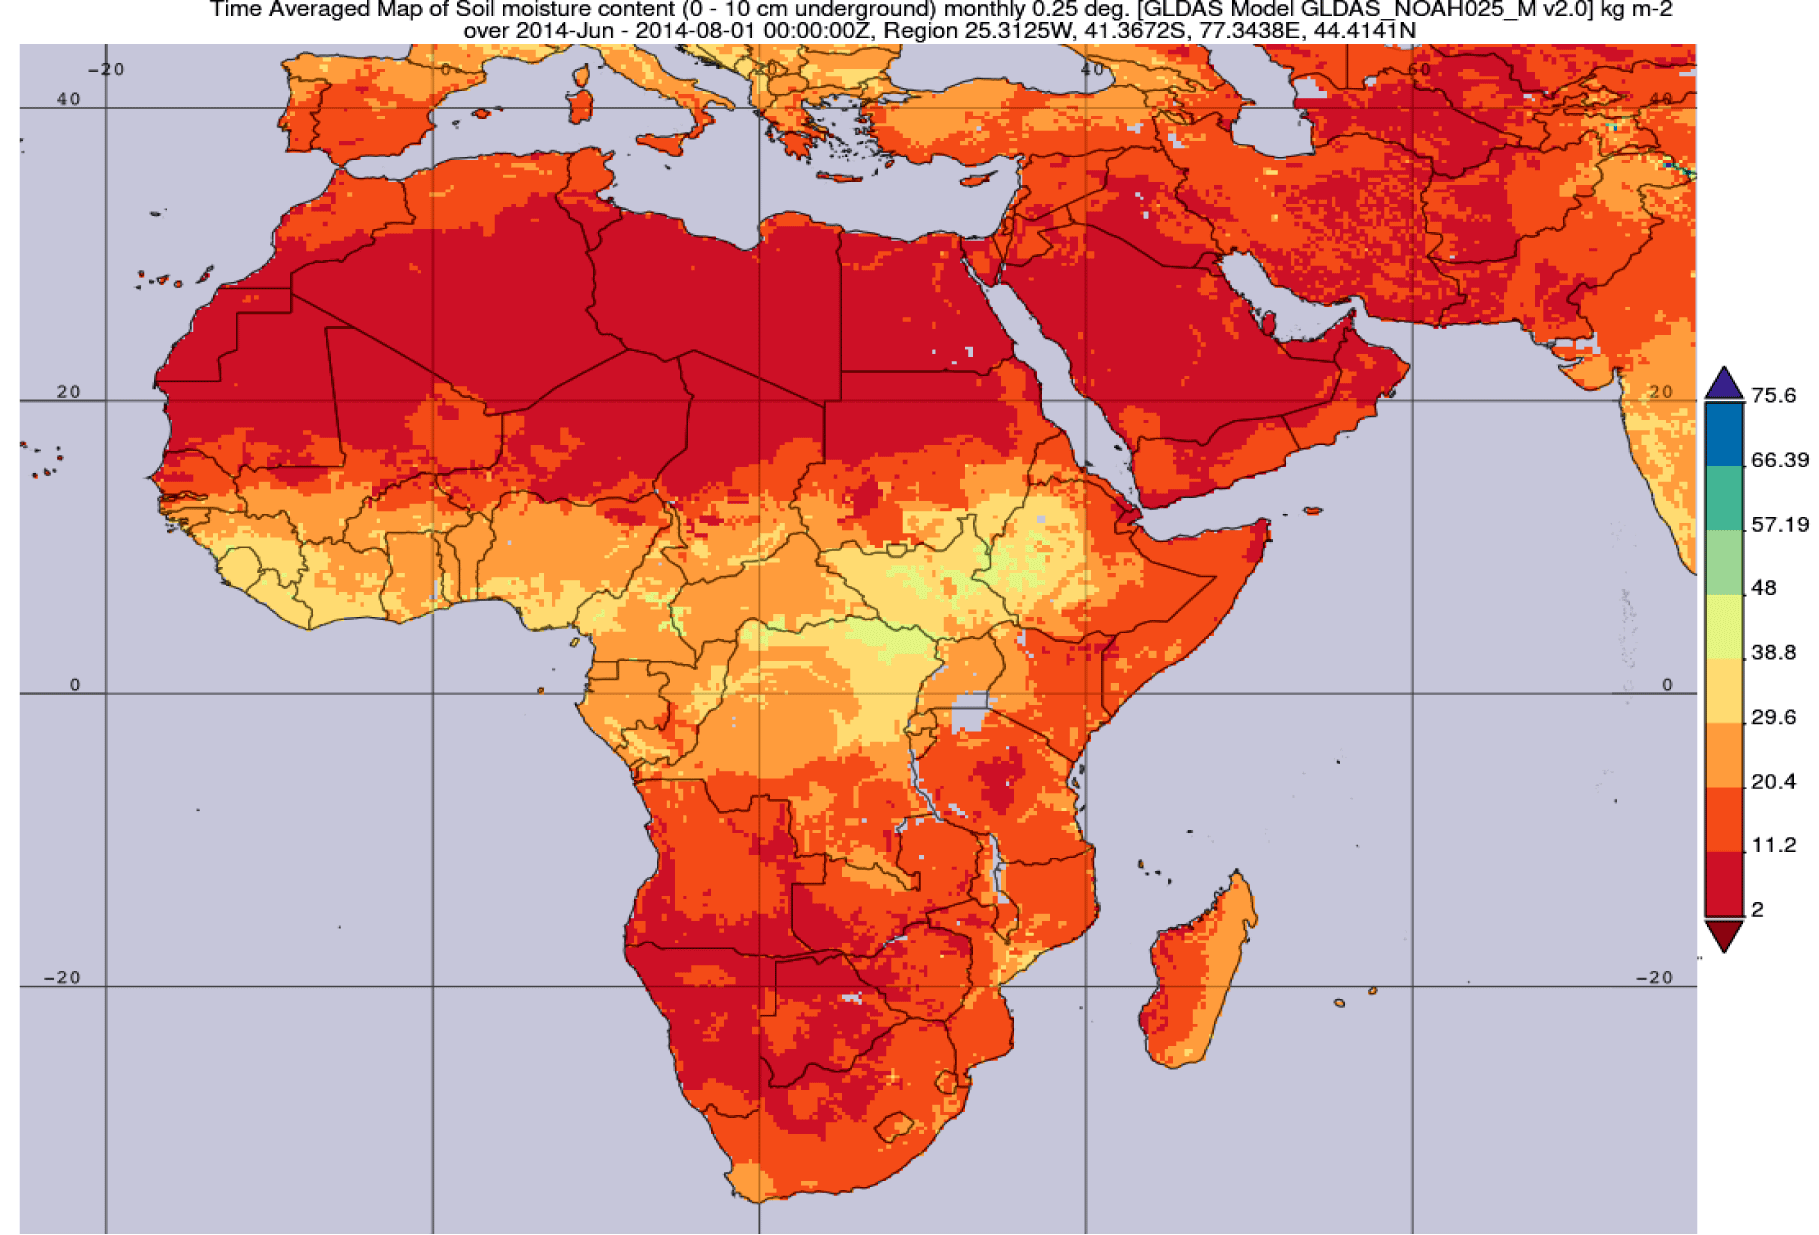
The PM has shown its potential skills in computing the PET with respect to observed data of the Pan Evaporation [6-8]. Regardless of the physical principles of which the PM is based, the PM has some limitations. For instance, Brutsaert W and Parlange MB [9] reported that under extreme dry condition (as in the MENA region; [3,4]), the PM method may not be suitable for computing the PET because the PM requires a surplus of soil moisture (not available in the MENA region because the soil moisture has values up to 11 mm (Figure S1). Besides, the PM involves many atmospheric variables (not often available spatially or temporary) and majority of these variables are computed empirically leading to a large increase of the uncertainty of the computed PET as reported by [10-12].
Niaghi AR, et al. [13] reported that simple empirical methods (with a few number of meteorological inputs) are needed despite of the advantages of the PM as a physically processed based method. According to Anwar SA et al. [11,12], the empirical methods can be categorized as: temperature-based methods [14], radiation-based methods [15]. Among various empirical methods, the Hargreaves-Samani (HS; [14]) method has been recommended to compute the PET after the PM as reported by [10-12]. In addition, the HS has proven its efficiency to compute the PET (compared to PM observations) in Moldova [16], Turkey [17] and the globe [18]. Calibrating the HS equation can give precise estimates of the calculated PET with respect to observations of the PM [11,12-18].
In Egypt, calibrating the HS equation showed promising results either by the linear regression model [10] or by fine-tuning the radiation coefficient of the HS [11]. For the purpose of daily forecast of the PET using the RegCM4 regional climate model [19], the present study aims to calibrate the original HS equation at locations (defined by [10]) to possibly calculate the PET in accurate way using the RegCM4 constrained by the Climate Research Unit (CRU; [20]) and a linear regression model (LRM; [21]). Section 2 describes the study area and experiment design, section 3 shows the results of the study over Egypt. Section 4 provides the discussion and conclusions.
Materials and Methods
Study area
As an important country in the MENA region, Egypt is bounded by the Mediterranean Sea from the north and the Red Sea from the east. From Climatic point of view, Egypt is categorized as a semi-arid, with hot, dry summers and mild winters with minimal precipitation. Also, Egypt is characterized by a special wind regime along the Red Sea and Mediterranean shores. According to the Köppen climate classification, Egypt is classified as desert climate (BWh). For rainfall, the major season is winter for the northern Mediterranean coast otherwise it is extremely dry. In addition, Egypt experiences heatwaves during spring and summer seasons which is intense in Upper Egypt and moderate in the Northern Coast [22].
Experiment design
In this study, version 4.7 of the International Center of Theoretical Physics (ICTP) RegCM regional climate model was used following [11]. Additionally, the following physical schemes were used: Community Climate Model (CCM3; [23]) as the radiation scheme, the boundary layer scheme of [24] and Emanuel [25] as the convection scheme over land and ocean. The model domain was configured following [26]. Caution was taken to ensure that Egypt boundaries lie within the selected domain. The ERA-Interim Reanalysis (EIN15; [27]) Was Used To Provide The RegCM4 Model With The Lateral Boundary Condition (LBC) and Sea Surface Temperature (SST). The model simulation was integrated over the period 1980-2018; the first year was considered as spin up to achieve equilibrium. Therefore, the actual analysis starts at 1981 and ends at 2018. Please note that the indicated period was chosen based on availability of the EIN15 from year 1979 till 2018 as indicated from the ICTP web link data: http://clima-dods.ictp.it/Data/RegCM_Data/EIN15/. It should be noted that the simulated PET was calculated using the original HS equation following [10]. The HS equation is written as:
where SW is the global incident solar radiation (expressed in mm day-1 to match the PET unit) and T2m is the 2 m mean air temperature (in °C). PET is the potential evapotranspiration (in mm day-1).
Observational data
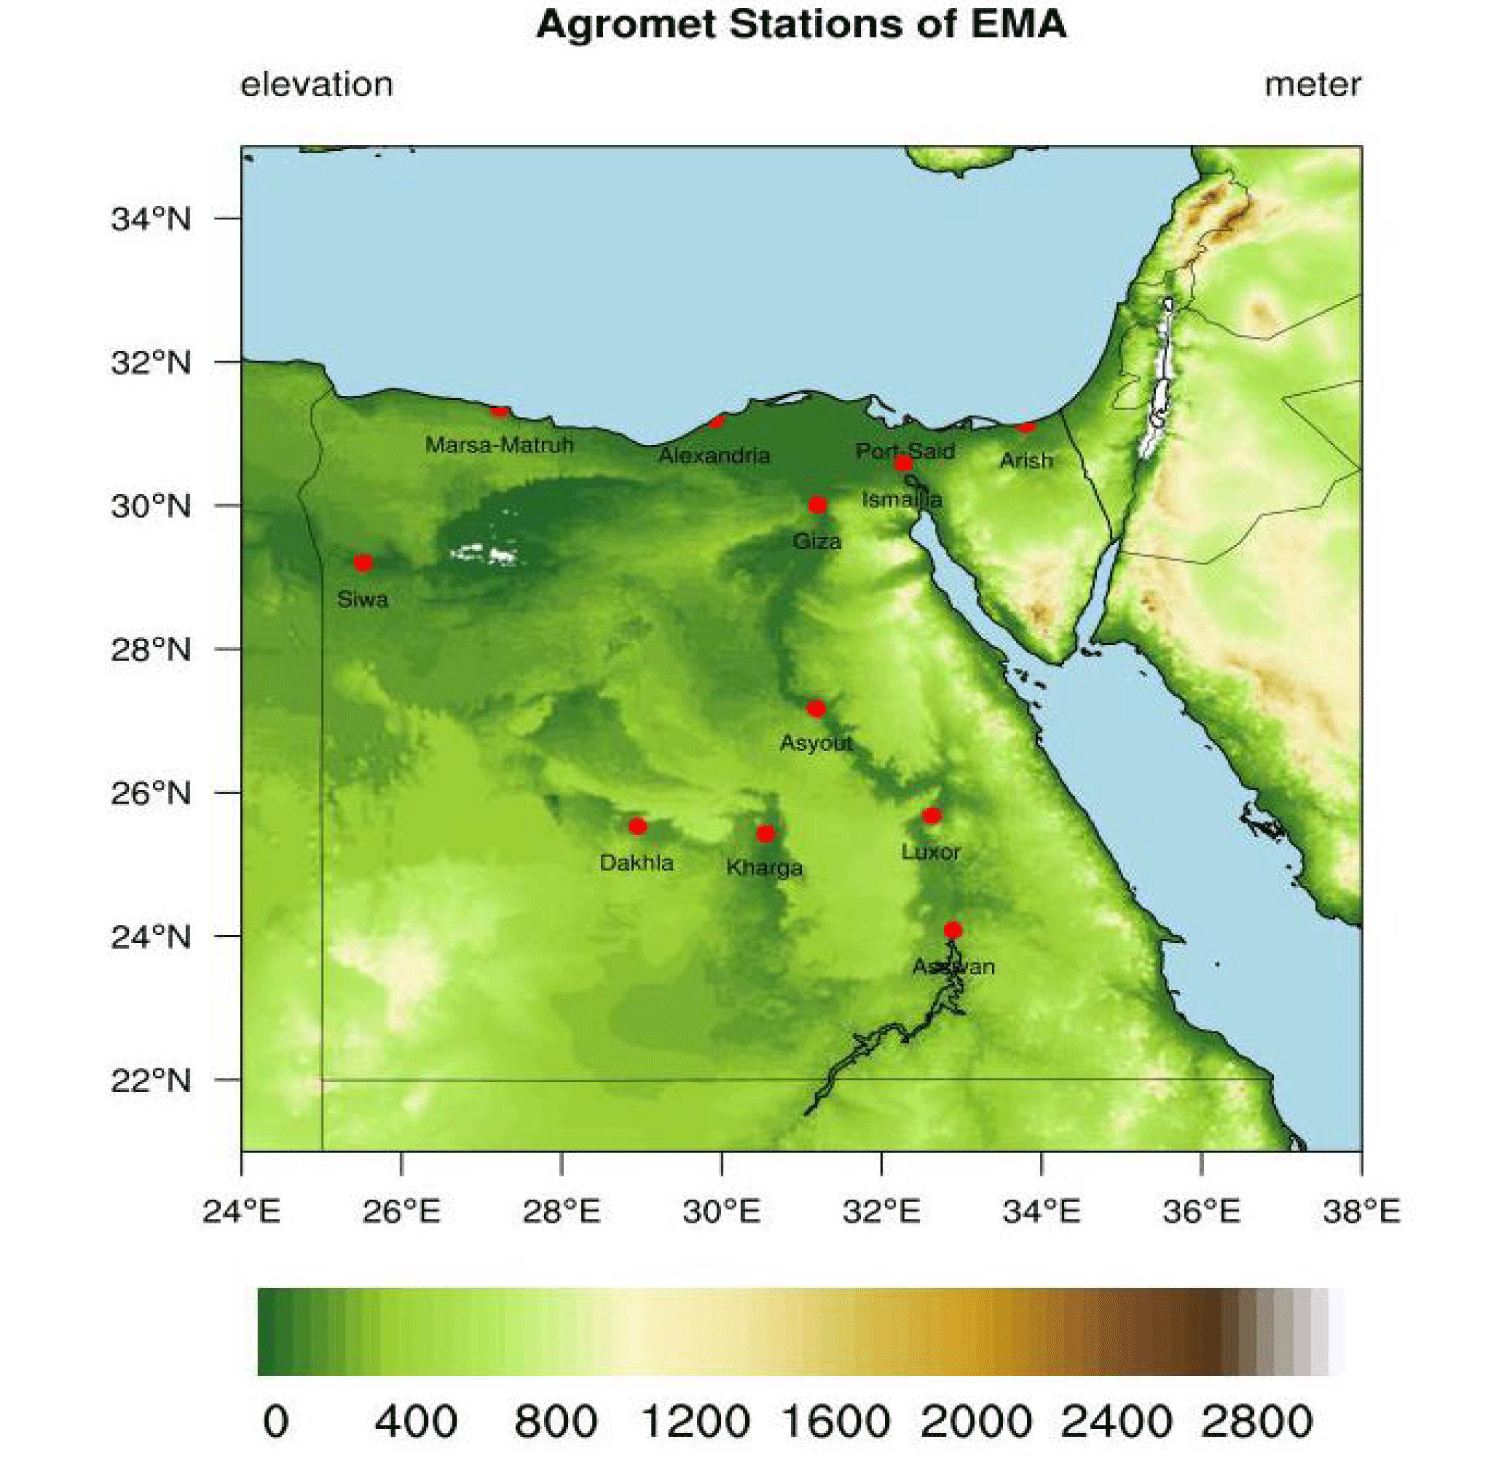
Anwar SA, et al. [10] reported that the PM method requires the knowledge of global incident and extra-terrestrial solar radiation (not available in the majority of the agrometeorology stations) and so calculating PET using the PM method was not feasible during the time of study. To overcome such a problem, the Climate Research Unit version 4.06 (CRU; [20]) dataset was used instead. CRU dataset has been used to evaluate the simulated PET where station observation is not absent or it is not available spatially/temporary following [16,18]. To minimize the error of downscaling the RegCM4 output and CRU to the nearest point of the agrometeorology station, the RegCM4 output and CRU data were regridded to a very high resolution (0.01 degrees) using the nearest neighbor interpolation method. The regridding process was done using the Climate Data Operator (CDO; https://code.mpimet.mpg.de/projects/cdo) and the time series of PET of the RegCM4 and CRU was extracted using the Netcdf Operator (NCO; http://nco.sourceforge.net). Figure 1 shows the location of the agrometeorology stations used in this study.
Results
North zone
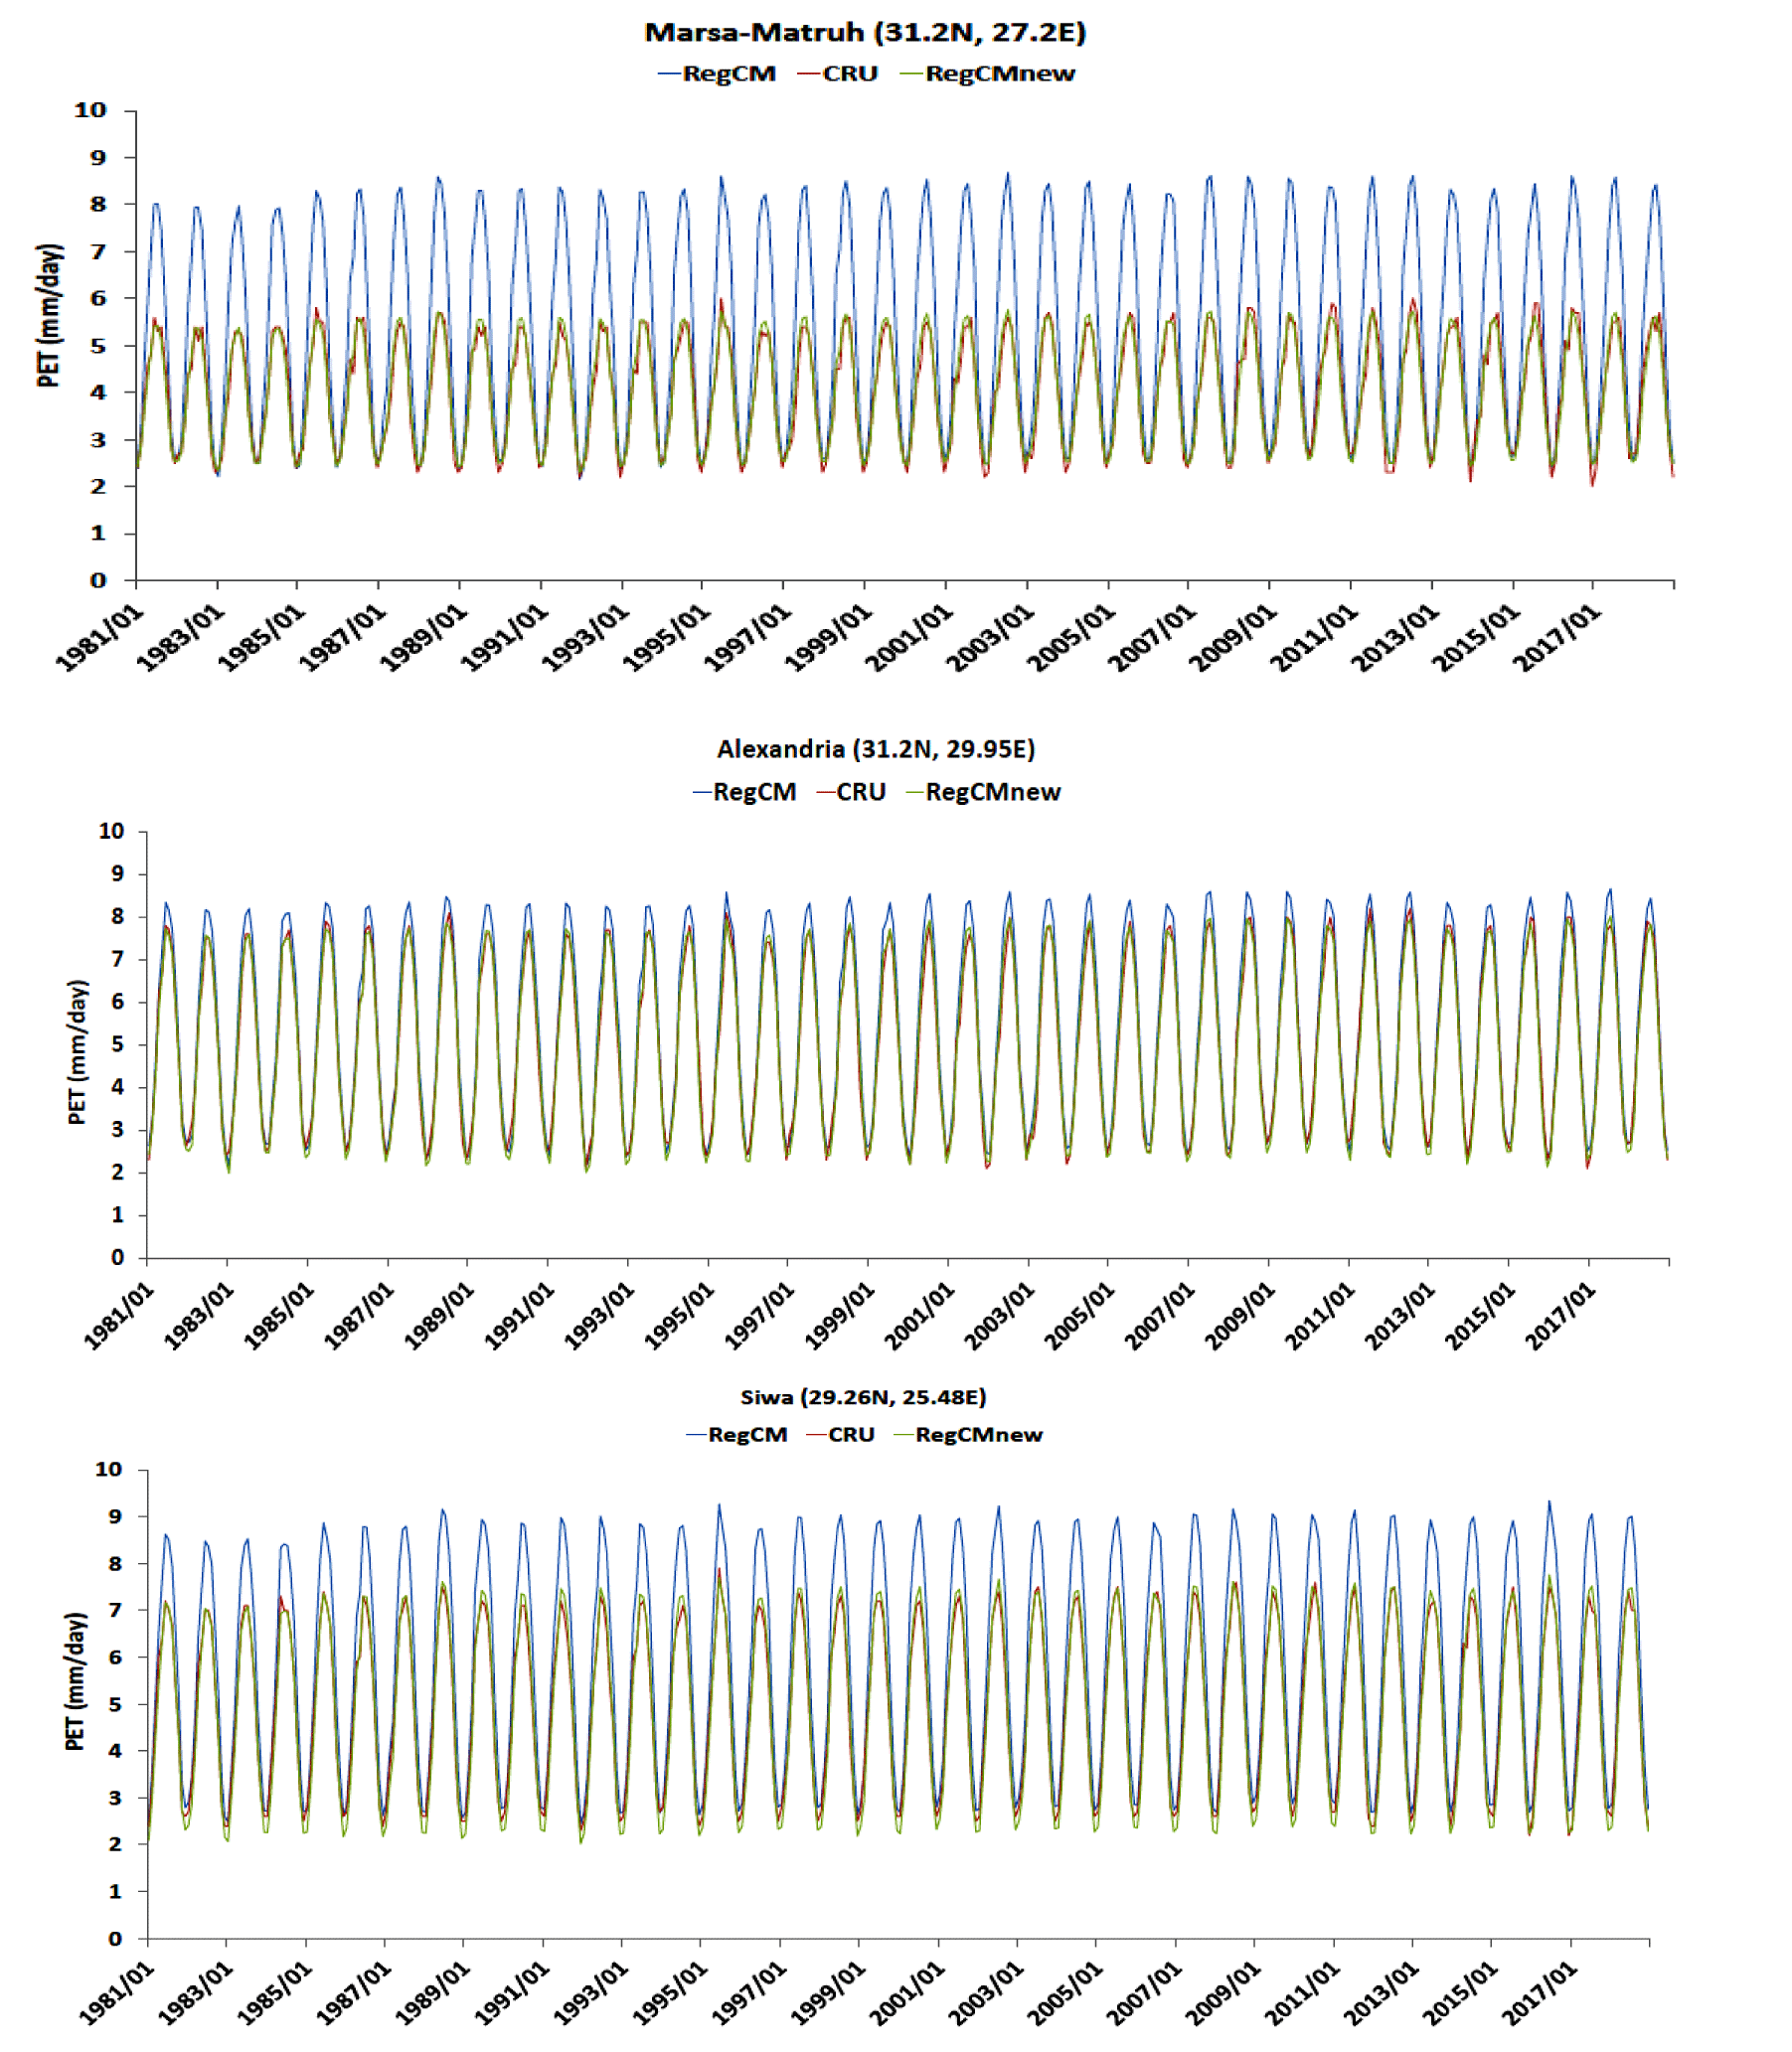
Figure 2 shows the monthly variation of PET as simulated by the RegCM4 model with respect to the CRU. It can be noticed that the RegCM4 shows a good capability for capturing the inter-annual variability with respect to the CRU for the three locations: Alexandria, Marsa-Matruh and Siwa. However the model overestimates the PET particularly in the summer months (i.e. June, July and August), also this overestimation varies according to the location. For example, the RegCM4 slightly overestimates in Alexandria; meanwhile it severely overestimates the PET in Marsa-Matruh and Siwa. This overestimation can be attributed to uncertainty of the simulated global incident solar radiation and mean air temperature as the RegCM4 shows large amplitude in the simulated global solar radiation and mean temperature with respect to the NASA Prediction of Worldwide Energy Resource (POWER; not shown). To bias-correct the RegCM4 with respect to the CRU, a linear regression model (between the RegCM4 and CRU) was applied. Shiri J, et al. [21] applied the concept of the Linear Regression Model (LRM) to calibrate the empirical formula at the location of interest. One can observe that when the LRM was applied, the calculated PET by the RegCM4 was greatly improved in comparison with the CRU particularly in the summer months. Quantitatively, such a superior performance is indicated by a low bias and high correlation as indicated in section (3.2).
Eastern zone
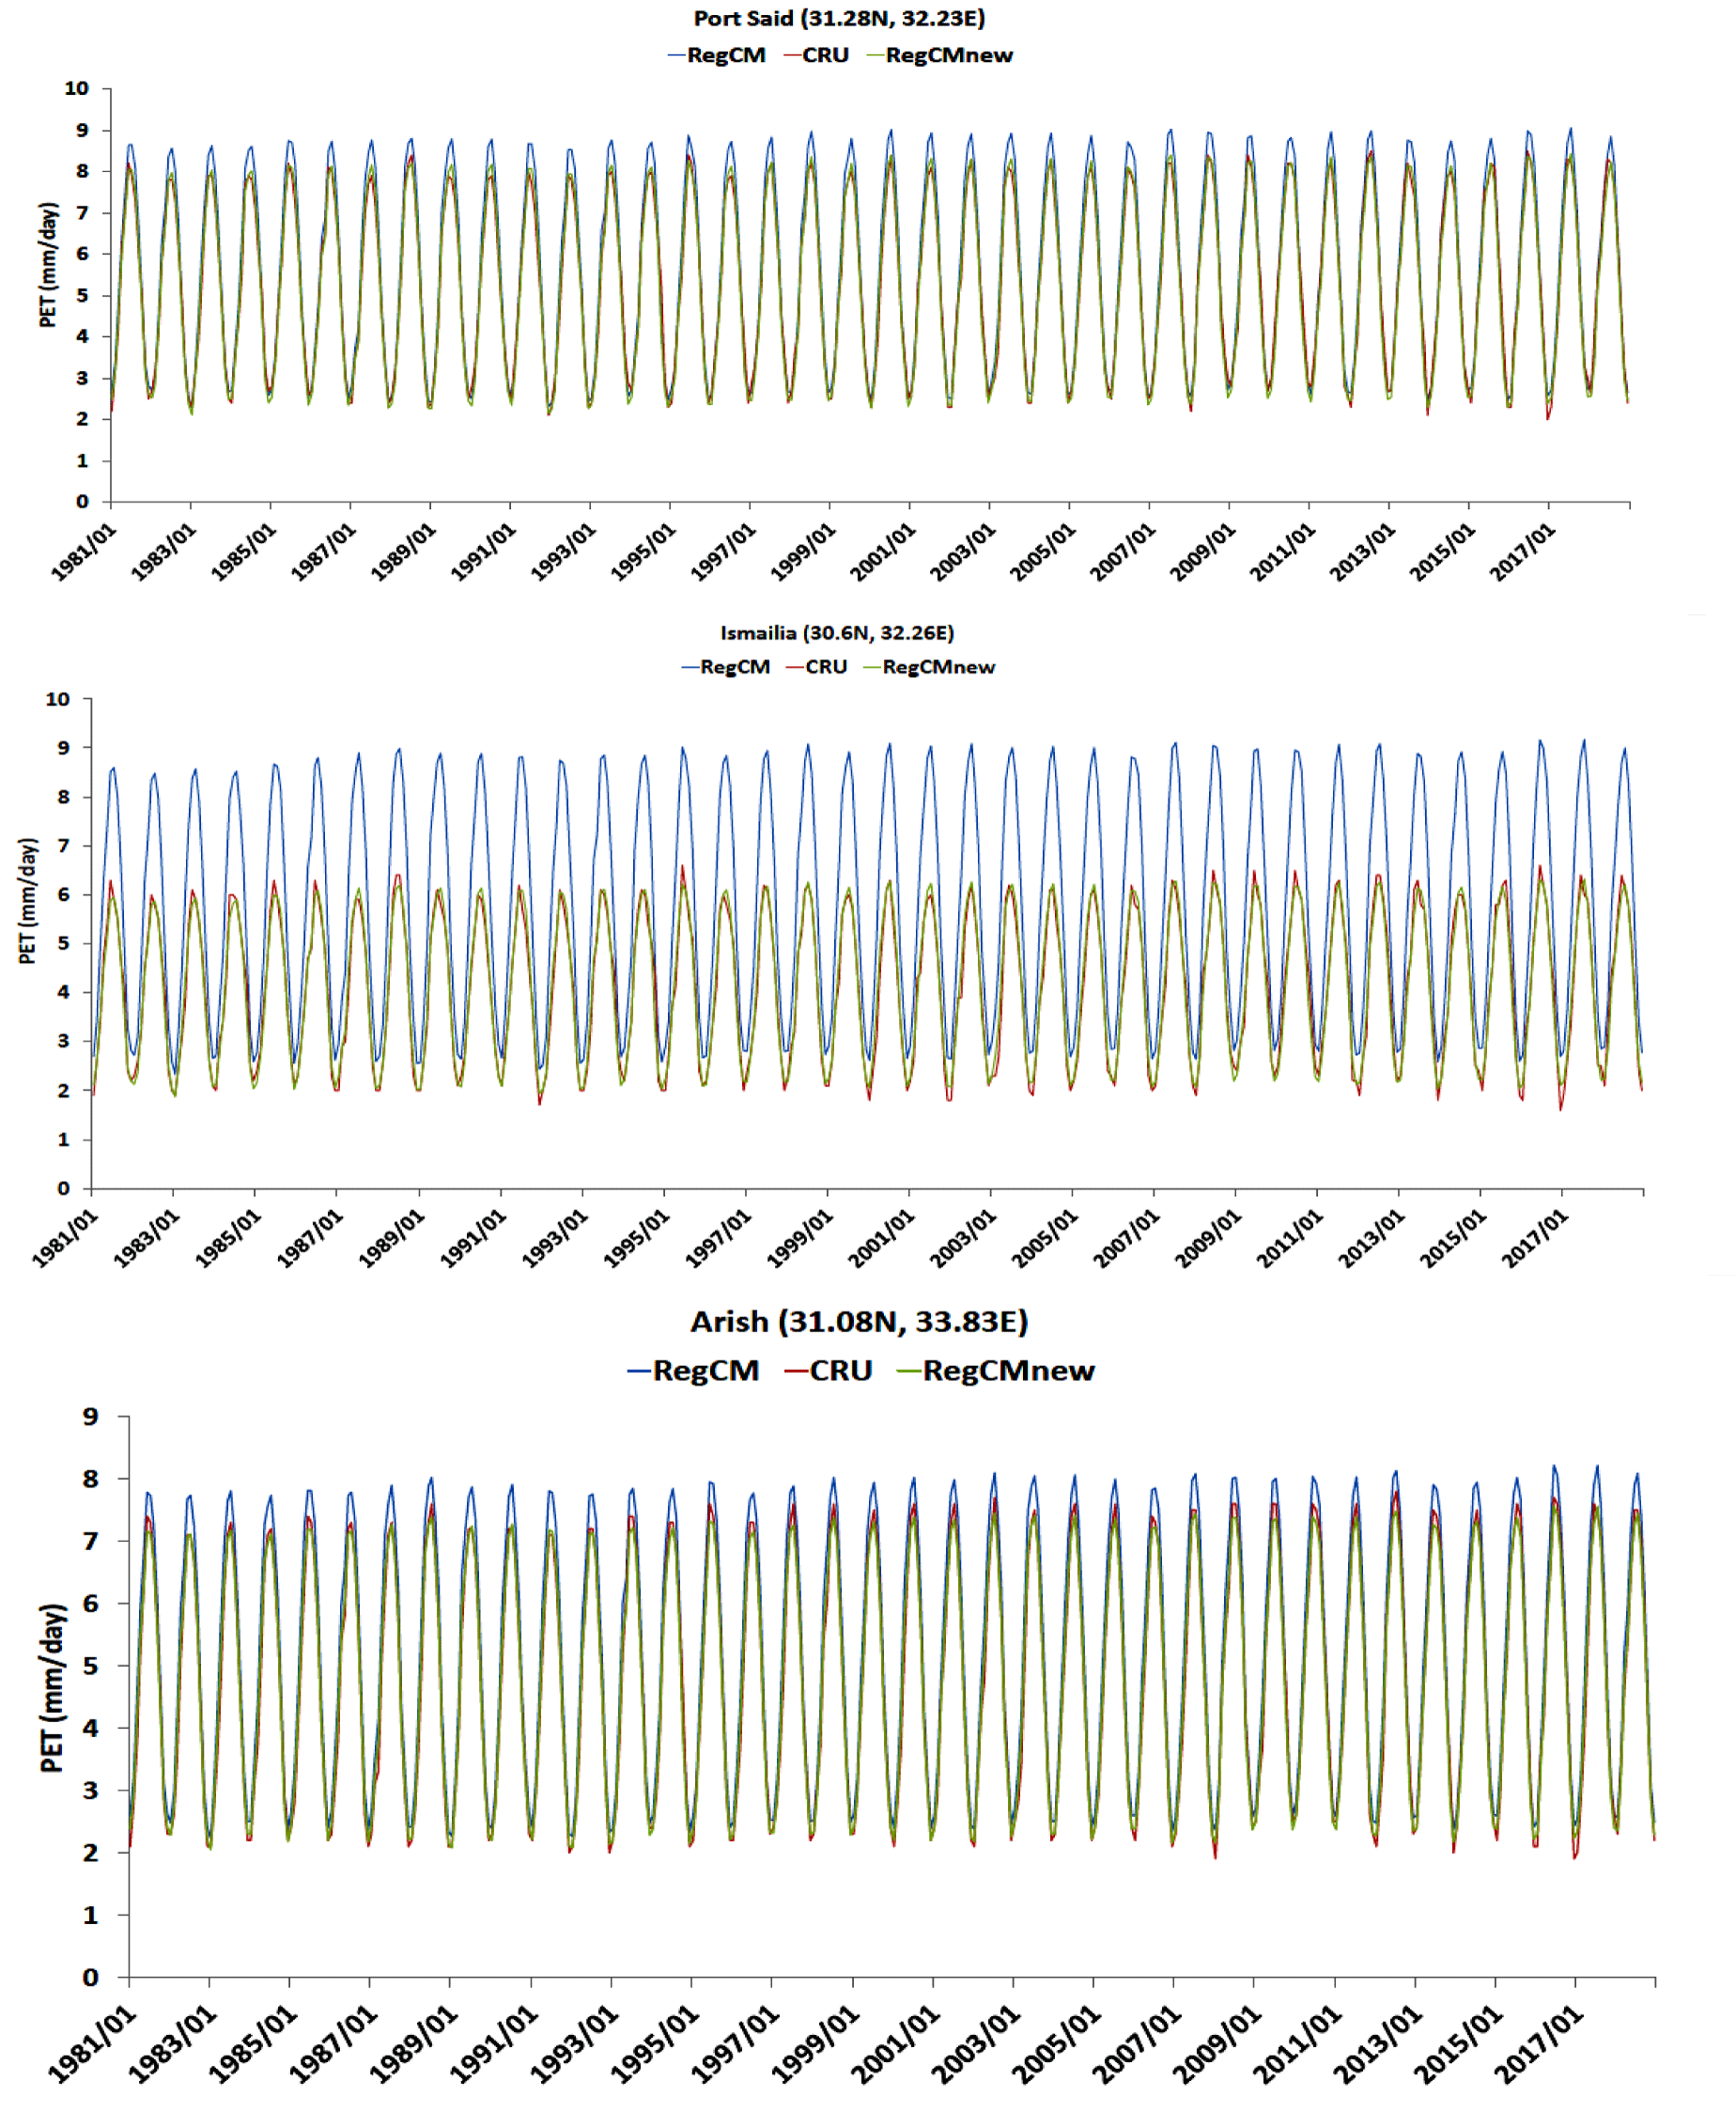
As discussed in section (3.1), the calculated PET by the RegCM4 is affected by the uncertainty of the simulated global incident solar radiation and mean air temperature; which differs according to the location of interest. This is evident in Ismailia as the RegCM4 severely overestimates the PET in comparison with the CRU especially in the summer months. Moreover, when the LRM was applied, the calculated PET stayed close to the CRU with slight over/underestimation depending on the month and year. At Port-Said, the RegCM4 slightly overestimates the PET in the summer months and it is very close to the CRU when the LRM was used. Finally for Arish, the RegCM4 also overestimates the PET relative to the CRU. Although the RegCM4 output was improved after using the LRM, it slightly underestimates PET in the summer months as can be seen in figure 3.
Lower Egypt zone
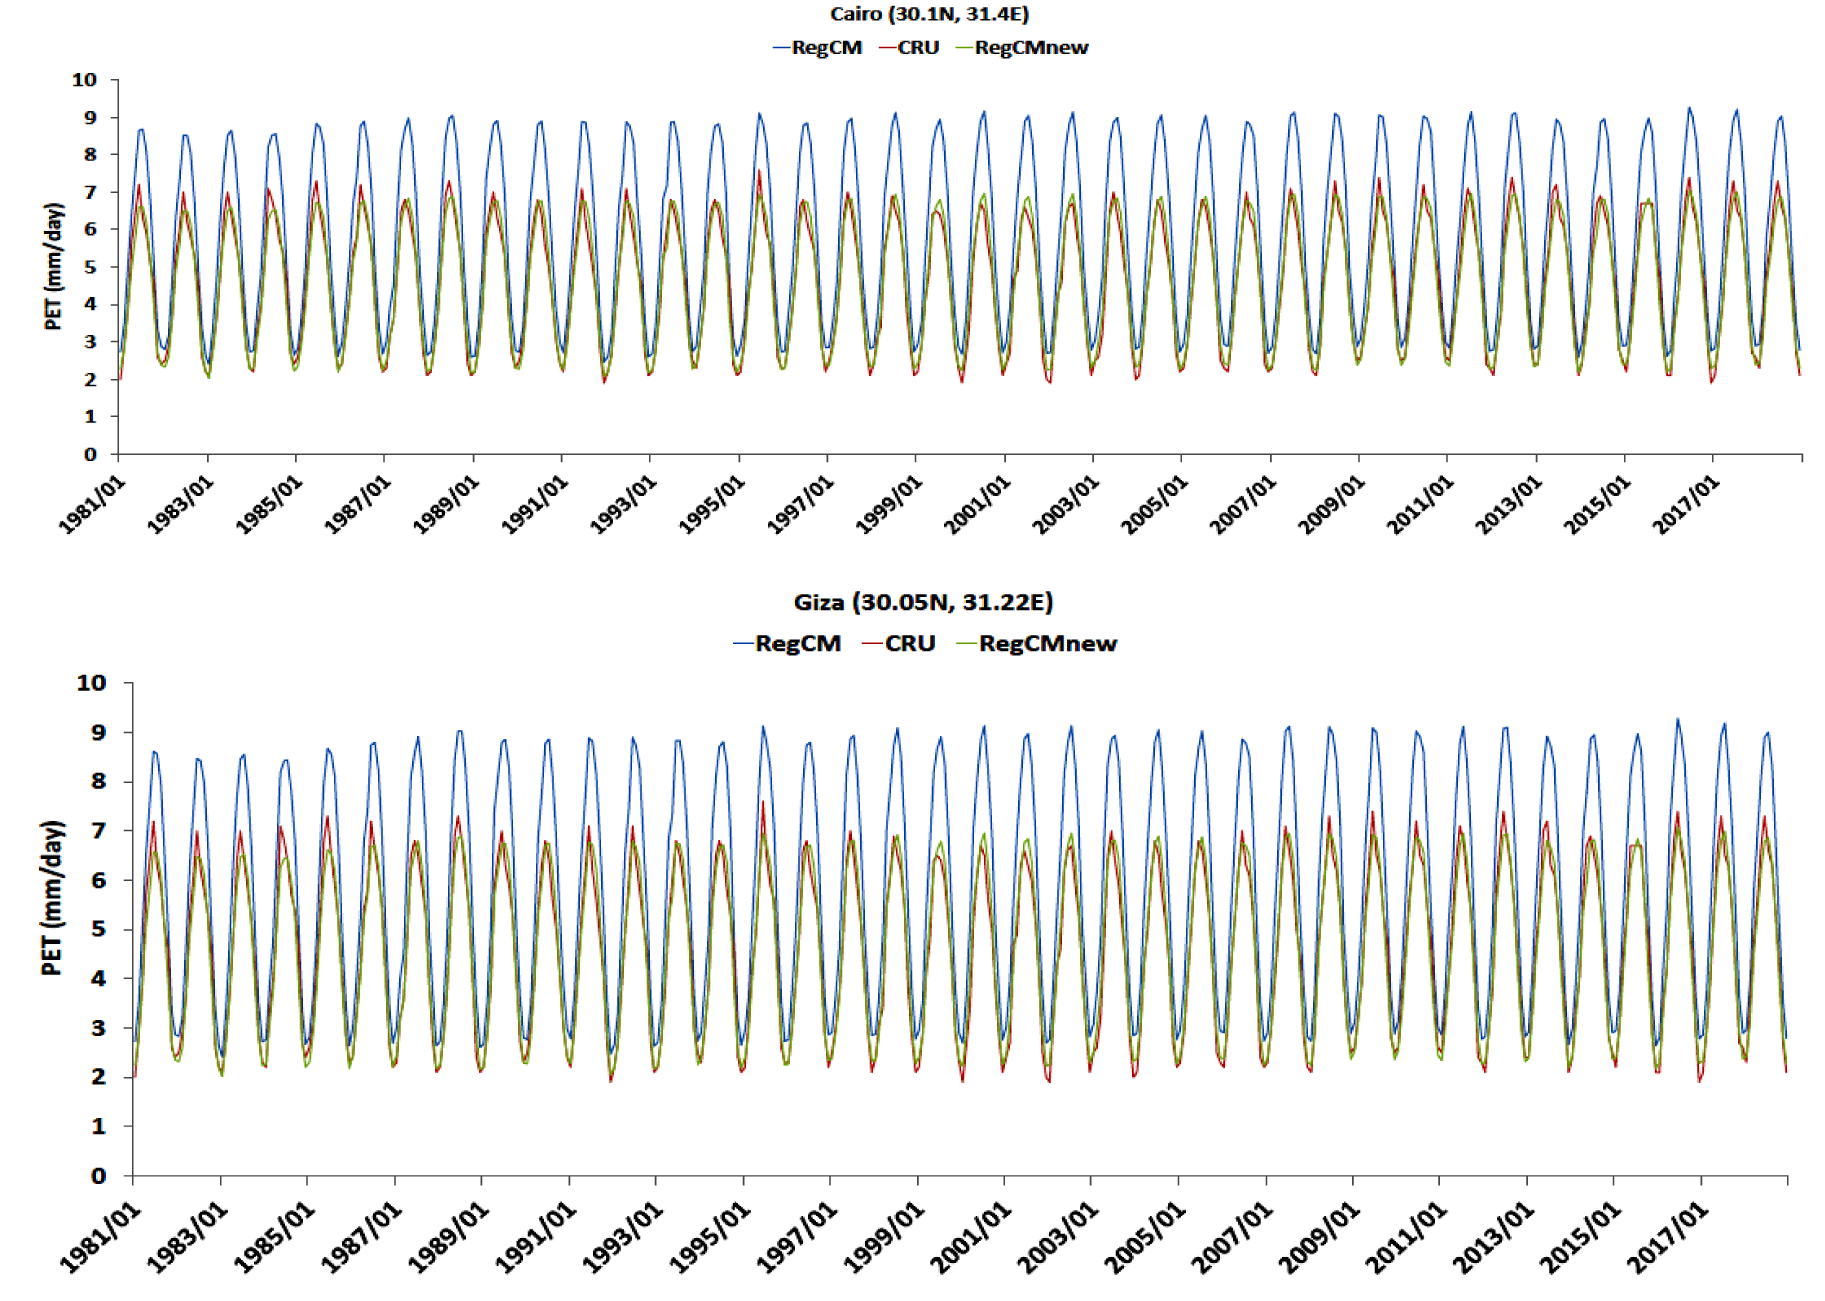
In the Lower Egypt zone (Cairo and Giza); the RegCM4 severely overestimates the PET over all the simulation period particularly in the summer months. In addition to reasons discussed in sections (3.1) and (3.2), this overestimation can be attributed to behaviour of the CCM3 and Emanuel schemes over hyper-arid regions (as in this study). Moreover, the RegCM4 shows a similar behaviour (for the two locations) with respect to the CRU because both locations are in the same area of the RegCM4 grid cell. When the LRM was used, performance of the RegCM4 was notably improved in comparison with the CRU. However, the corrected PET slightly underestimates with respect to the CRU in the summer months (due to the noted behaviour in the raw output of the RegCM4 model) as indicated in figure 4.
Middle and upper Egypt zones
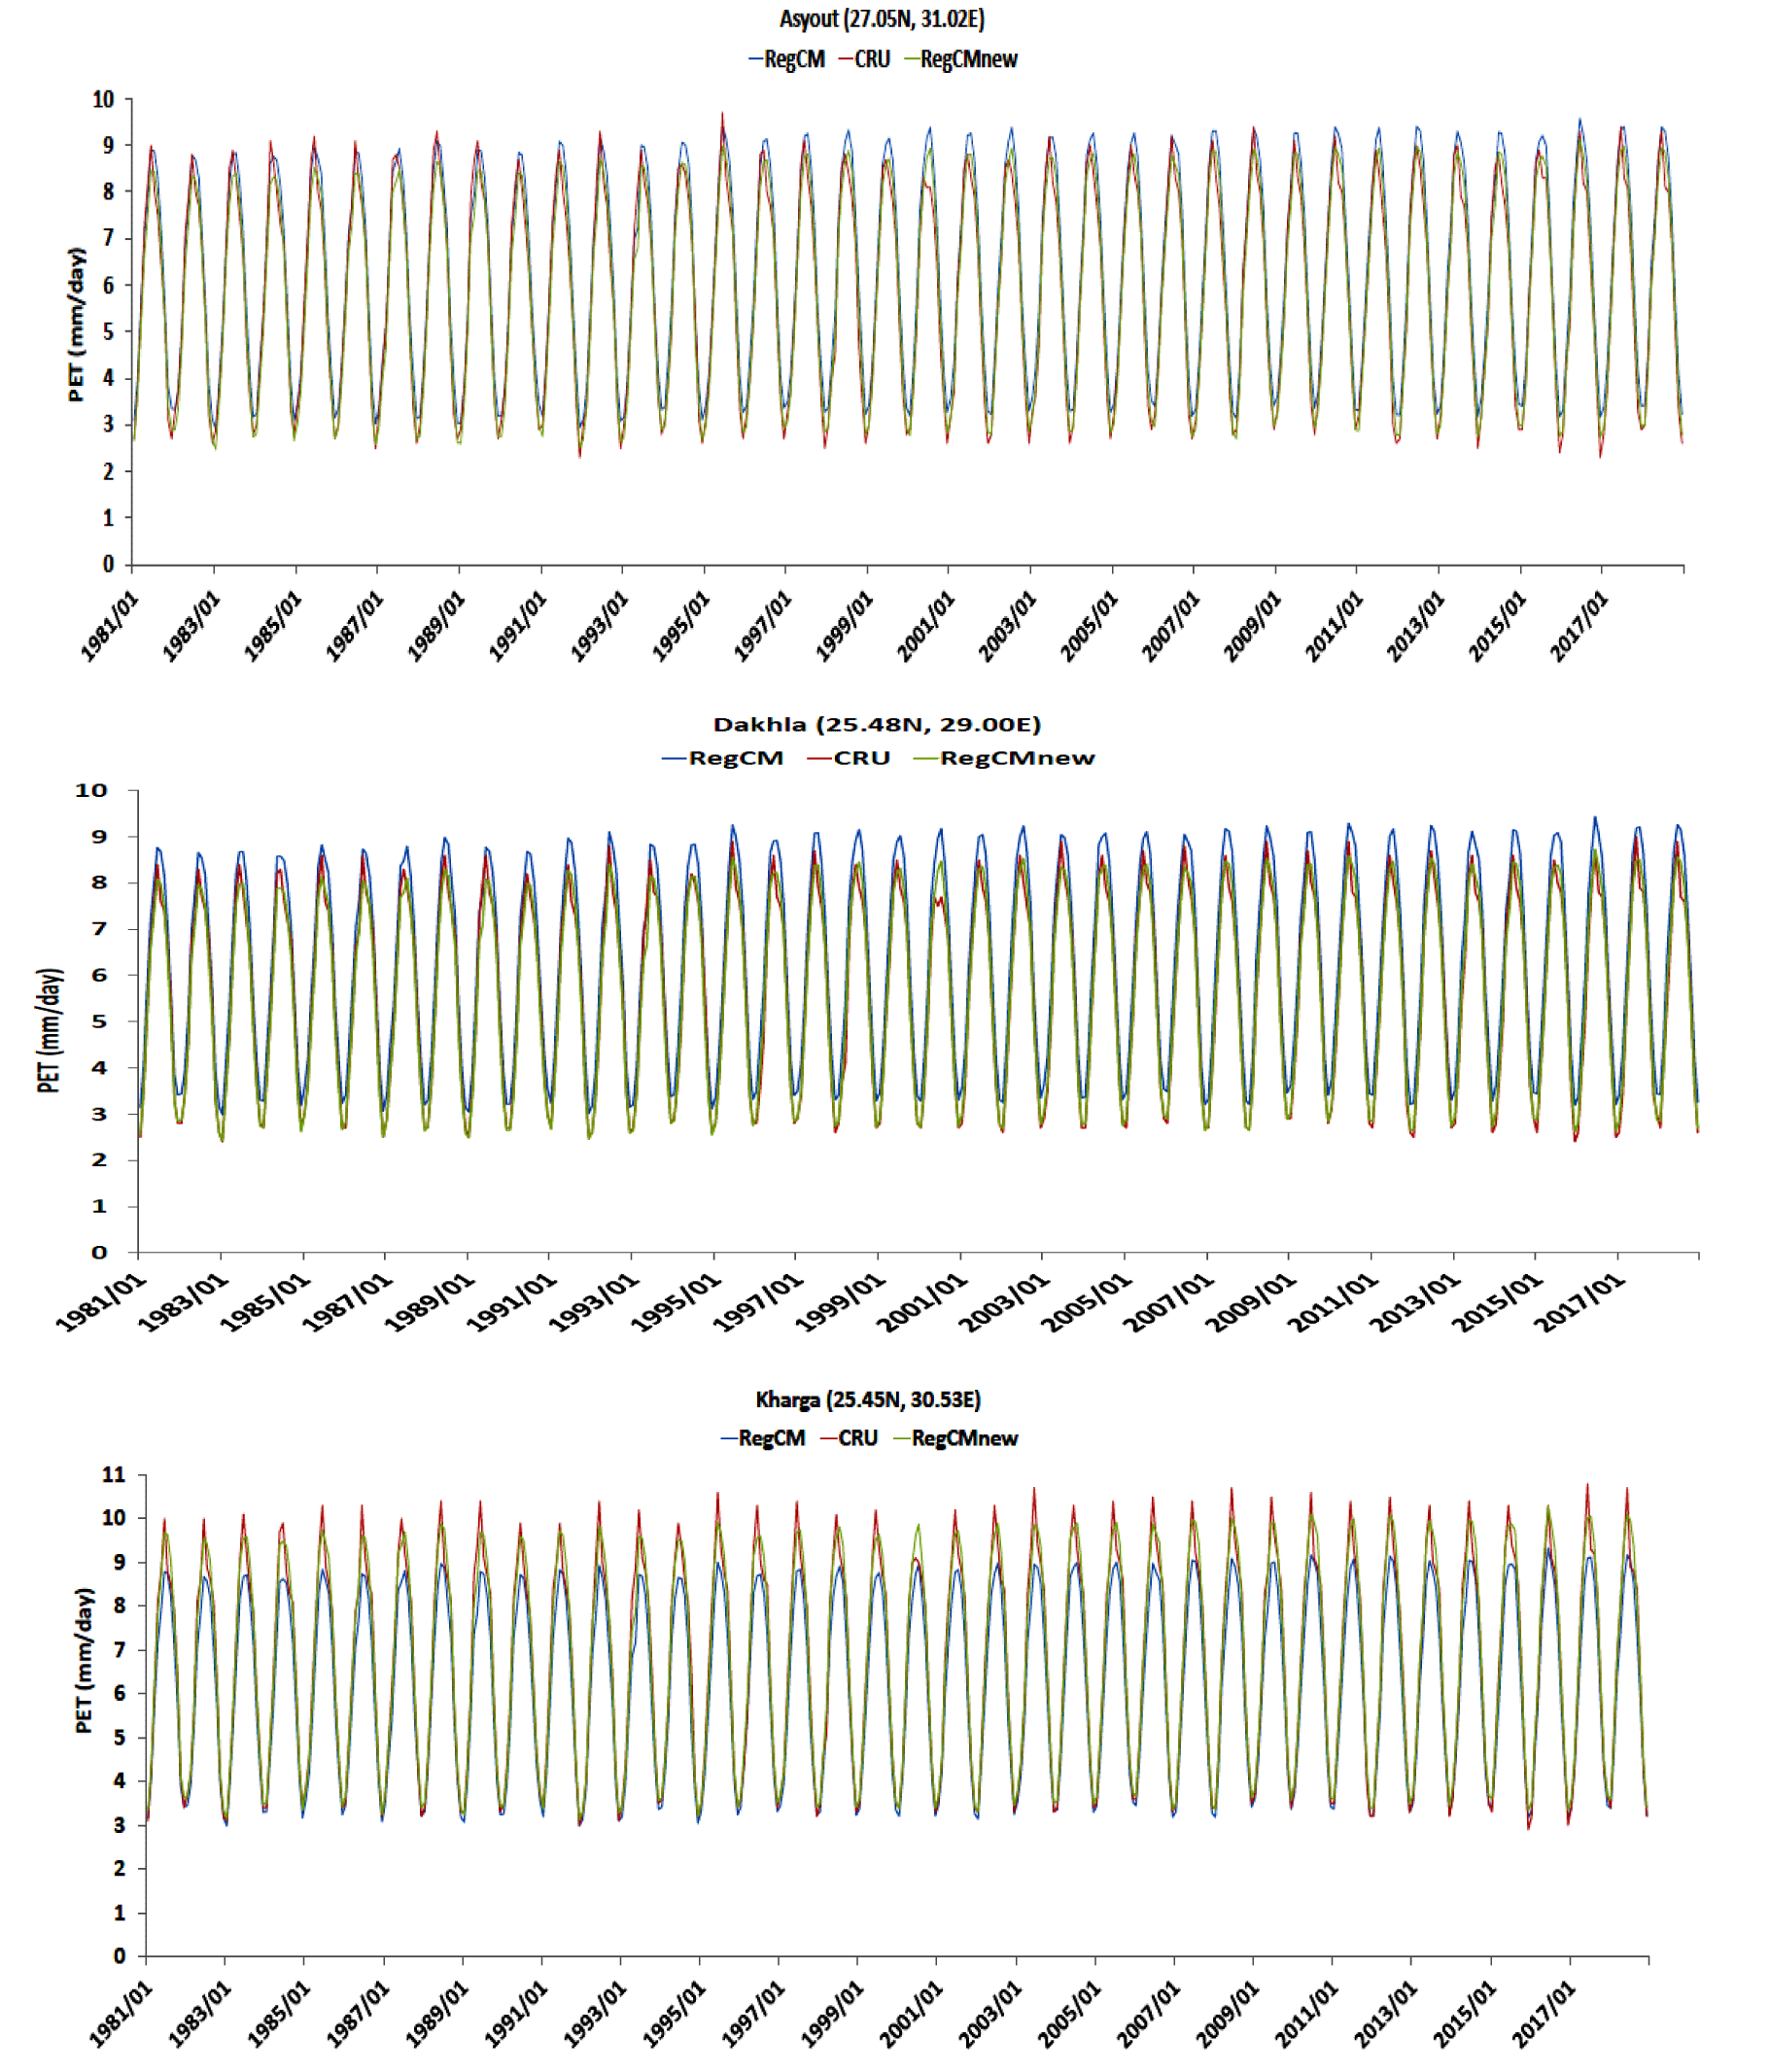
In these zones, the RegCM4 model showed a good capability for capturing the inter-annual variability with respect to the CRU. Moreover, behaviour of the RegCM4 depends on the location of interest. The RegCM4 overestimates the PET at Dakhla in all months particularly in the summer months. In addition, when the LRM was applied; the RegCM4 model is close to the CRU; however it slightly underestimates the PET in the summer months. At Kharga, the RegCM4 severely underestimates the PET with respect to the CRU mainly in the summer months. In addition, the RegCM4 slightly underestimates the PET particularly in the summer months in comparison with the CRU when the LRM was applied. In Asyout, the situation is quite different as the RegCM4 was close to the CRU during the period 1981-1989 and it overestimates for the rest of the simulation period. For this reason, when the LRM was applied, the RegCM4 slightly underestimates the PET in the period 1981-1989 and it is close to the CRU for the rest of the simulation as indicated in figure 5.
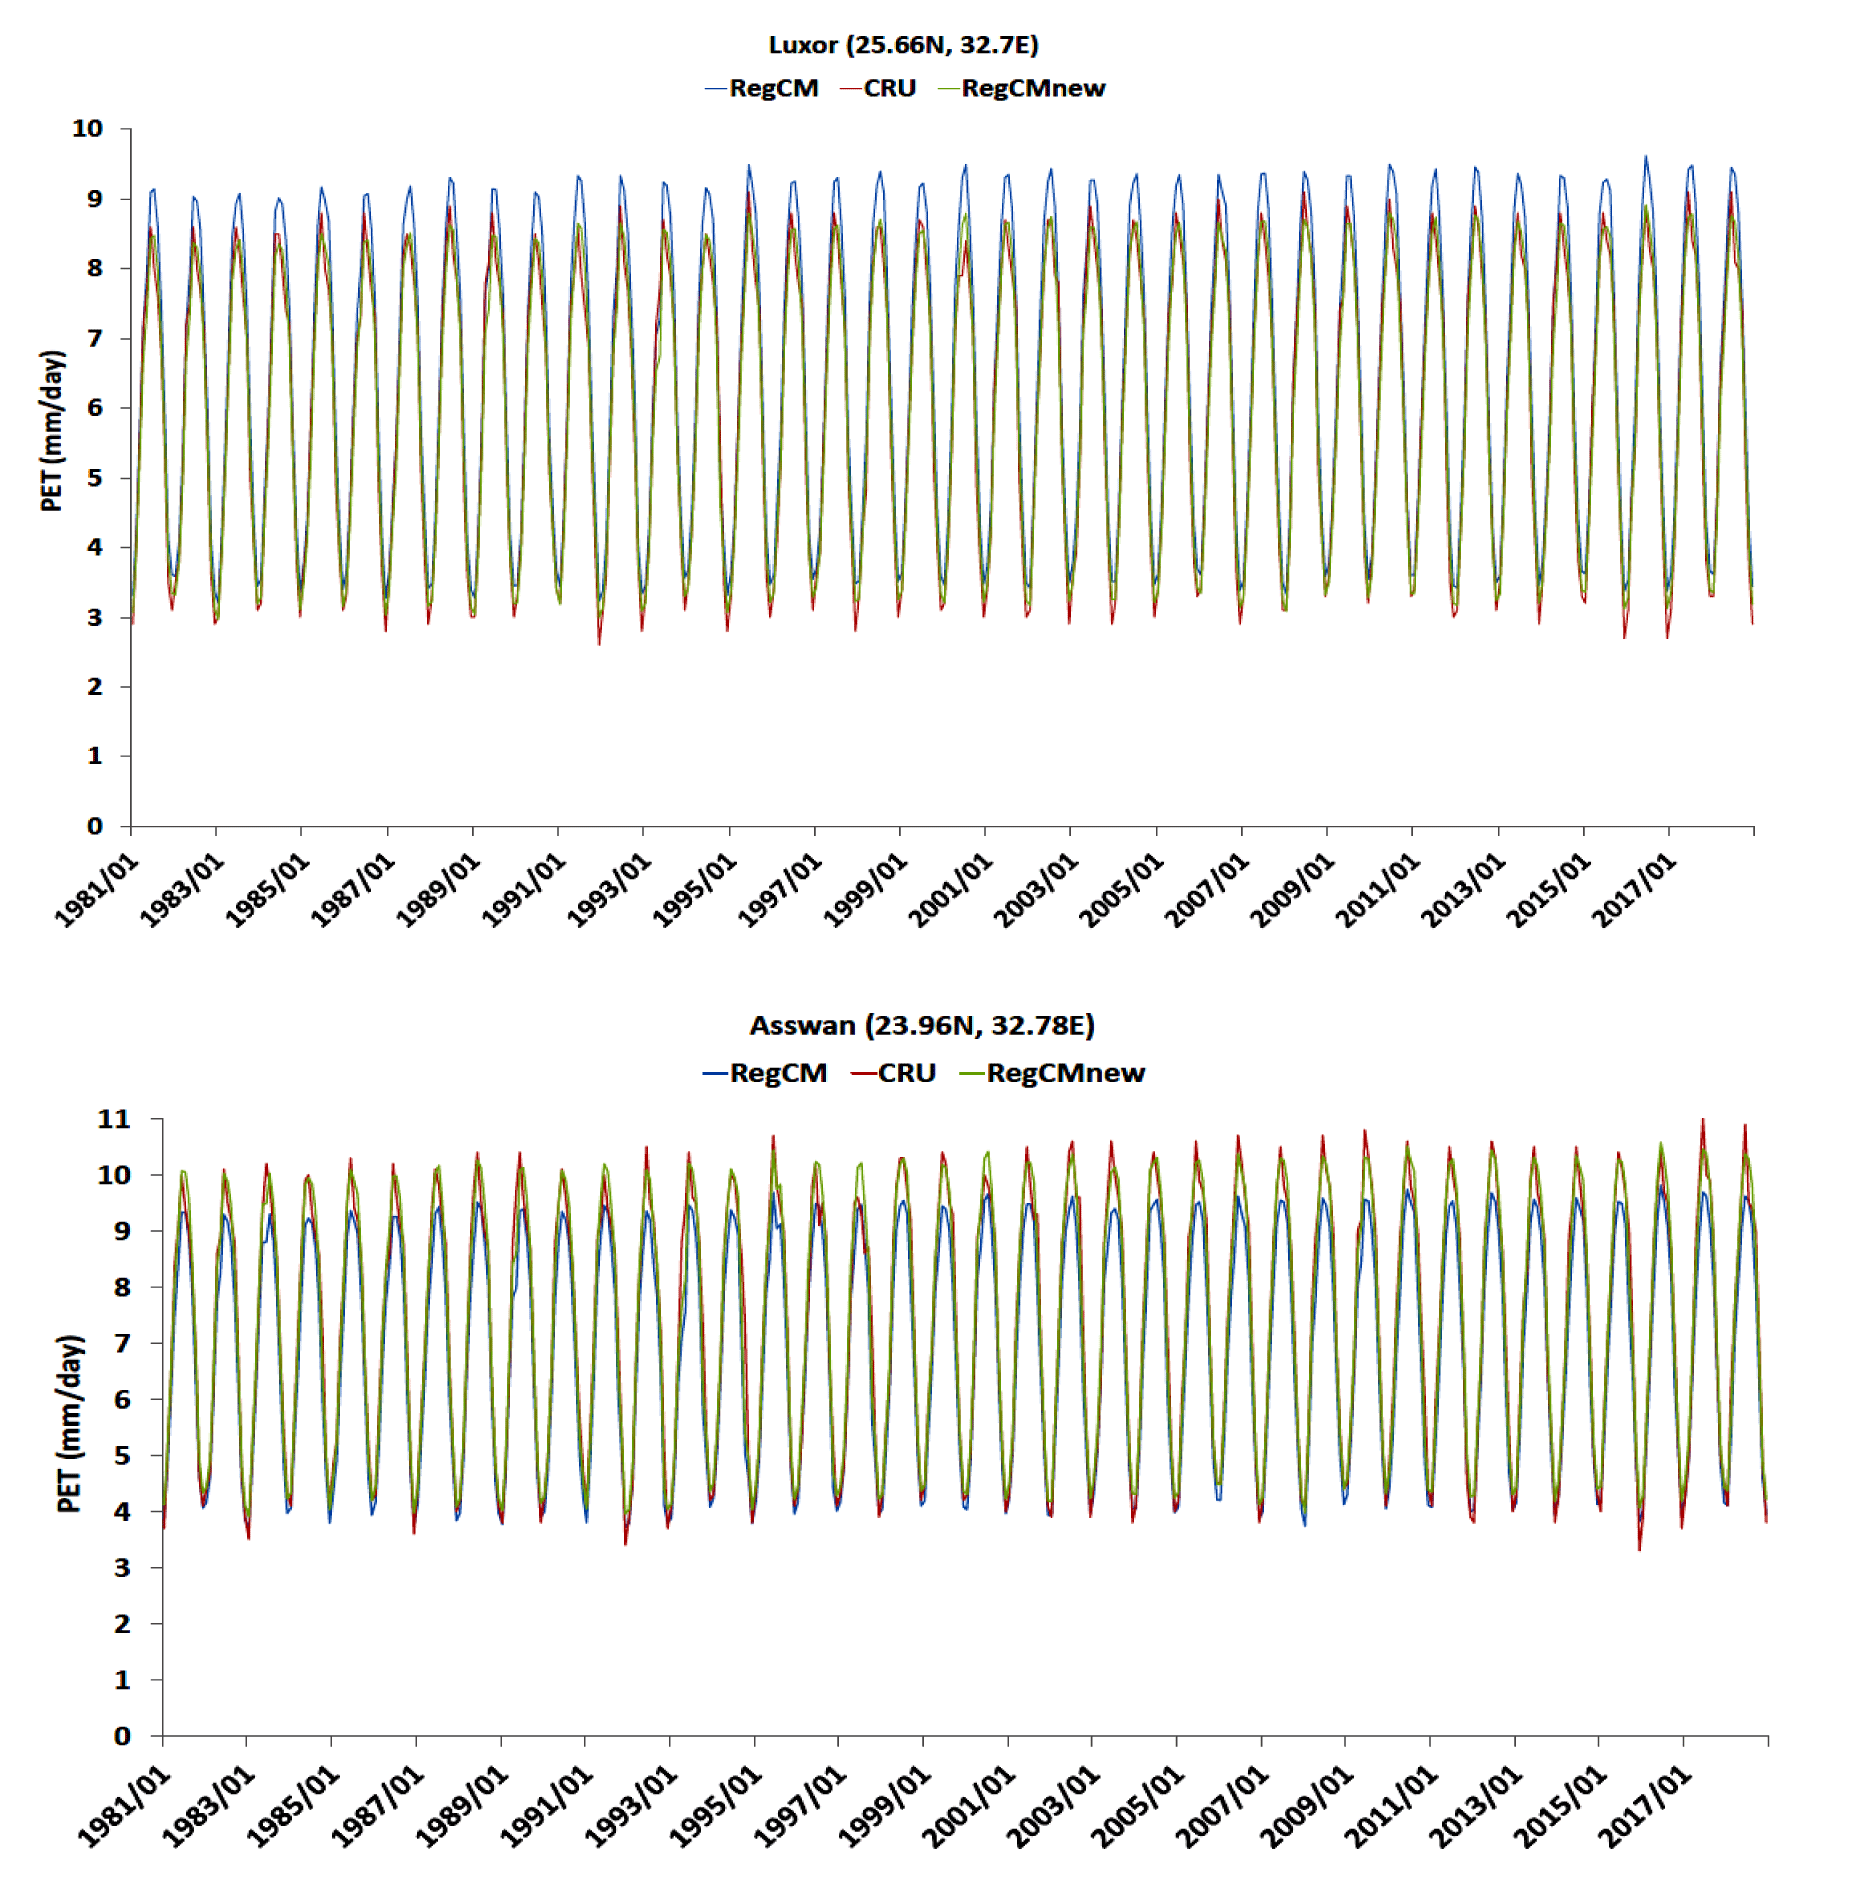
At Luxor, the RegCM4 overestimates the PET with respect to the CRU especially in the summer months. In addition, the corrected RegCM4 is close to the CRU but it slightly underestimates in the summer months (June – July – August) and overestimates in the winter months (December – January – February) as can be noticed in figure 6. The situation is different at Asswan, as the RegCM4 severely underestimates the PET especially in the summer months in comparison with the CRU product. When the LRM was applied, the RegCM4 slightly underestimates in the summer months and overestimates in the winter months but stills shows a good capability for capturing the inter-annual variability with respect to the CRU.
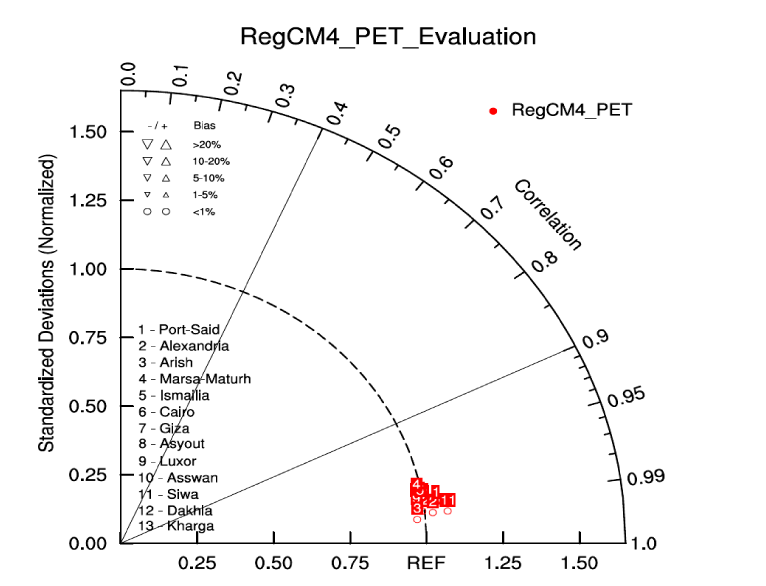
Table 1 shows the LRM applied for the 13 agrometeorology locations reported by [10]. Performance of the RegCM4 was quantitatively evaluated using Taylor diagram [28] in terms of correlation, mean bias and standard deviation ratio. Figure 7 shows the Taylor diagram for quantifying the RegCM4 performance after applying the LRM for the 13 agrometeorology locations from figure 7. It can be observed that the RegCM4 possesses a high Pearson correlation coefficient (~ 0.99), small mean bias (bias percentage is less than 1%) and the standard deviation ratio is close to one except for the locations: Port-Said, Alexandria and Siwa.
| Table 1: shows the Linear Regression Model (LRM) for each station to correct the simulated PET (calculated by the RegCM4) with respect to the CRU. | |||
| Station | LRM | Station | LRM |
| Port-Said | PETcorr = 0.9853 × PETraw | Asyout | PETcorr = 0.9988 × PETraw – 0.4294 |
| Alexandria | PETcorr = 0.9265 × PETraw | Luxor | PETcorr= 0.9267 × PETraw |
| Arish | PETcorr = 0.9201 × PETraw | Asswan | PETcorr = 1.0871 × PETraw– 0.0829 |
| Marsa-Matruh | PETcorr = 0.5304 × PETraw + 1.1595 | Siwa | PETcorr = 0.8305 × PETraw |
| Ismailia | PETcorr = 0.6498 × PETraw + 0.3595 | Dakhla | PETcorr = 0.9774 × PETraw – 0.4934 |
| Cairo | PETcorr = 0.7293 × PETraw + 0.2849 | Kharga | PETcorr = 1.1255 × PETraw – 0.2191 |
| Giza | PETcorr = 0.7360 × PETraw + 0.2347 | ||
Discussion and Conclusion
PET is essential for assessing hydrological and agricultural activities particularly on a regional scale. The FAO organization recommends the PM method to calculate the PET. As a standard model recommended by the FAO, the PM has shown its skills in computing the PET with respect to pan evaporation records as reported by [6-8]. However, the PM has some limitation to be used in this study such as: 1) it cannot be used in arid regions as noted by [9], 2) it requires many meteorological variables (each has its own uncertainty) leading to amplifying the error of the calculated PET because the PM equation is not linear [11,12] and 3) the PM equation has been imbedded in the RegCM4 model code but not confirmed for use till the present day.
As an alternative solution, an empirical equation (with the minimum number of meteorological inputs) is needed to monitor the PET on daily or larger time scales. Among various empirical methods, the HS equation has been recommended by [13]. Although the HS equation has two meteorological inputs [11], it has shown its potential skills in calculating the PET with a reasonable accuracy with respect to observations of the PM, reanalysis or gridded-based products. For instance, Er-Raki S, et al. [29] reported that the HS is suitable for addressing the spatio-temporal variability of the PET in the semi-arid conditions of the Tensift basin. Also, the HS equation has been widely used for various applications such as agricultural planning [30], hydrological modeling [31] and investigation of the meteorological droughts [32]. Additionally, calibrating the HS equation has ensured a reasonable accuracy of the estimated PET around the globe [18], in tropical Africa [33], in Bulgaria [12] and Egypt [13].
In the present study, the original HS equation was used and the simulated PET was corrected be means of the RegCM4 model using the LRM [21] and CRU dataset as the ground truth of observation. To accomplish this task, the RegCM4 was downscaled by the EIN15 for duration of 39 years considering the first year as a spin-up to ensure equilibrium of the atmosphere. This long-term period was considered so the LRM model can be accurate and it can be used in any period outside the chosen period of this study. The Taylor diagram has been used to quantify the RegCM4 performance before and after using the LRM model with respect to the CRU. The results showed that the RegCM4 model is able to capture the inter-annual variability with respect to the CRU; however the model over/underestimates the PET depending on location and time. Additionally, the RegCM4 model indicates a superior performance when the LRM was applied at the location of interest. Quantitatively, such an improved performance was indicated by a high correlation, low mean bias and standard deviation ratio were close to unity. In conclusion, the RegCM4 model can be used to study the inter-annual variability (in the present climate) or correct the daily forecast of the PET at location of interest.
The results from this study can be further improved by: 1) revising the code of the CCM3 radiation scheme, 2) performing an extra sensitivity tests using various convection schemes over hyper arid regions (as in this study) and 3) fine-tuning the radiation coefficient following [11,12,33]. In addition, a future work will downscale the Global Circulation Models (GCMs) - which participated in the fifth/sixth phase of the Coupled Model Intercomparison Project (CMIP5/6; [34,35]) - over Egypt with high-resolution of the RegCM4 to study the influence of climate change on PET of Egypt using the model configuration adopted by [36,37].
Author Contributions
Conceptualization, Anwar SA; methodology, Anwar SA.; software, Anwar SA; validation, Anwar SA; formal analysis, Anwar SA; investigation, Anwar SA; resources, Anwar SA; data curation, Anwar SA; writing—original draft preparation, Anwar SA; writing—review and editing, Anwar SA; visualization, Anwar SA; supervision, Anwar SA; project administration, Anwar SA. All authors have read and agreed to the published version of the manuscript.
Acknowledgment
The Egyptian Meteorological Authority (EMA) is acknowledged for providing the computational power to run the RegCM4 model. The ERA-Interim dataset can be retrieved from http://www.clima-dods.ictp.it/RegCM4. Climate Research Unit (CRU) of the University of East Anglia was acknowledged for providing observed dataset of potential evapotranspiration (Accessed on 01 April 2023). The Prediction of Worldwide Energy Resource (POWER) Project is funded through the NASA Applied Sciences Program within the Earth Science Mission Directorate.
The POWER team could not have completed this task without both technical and scientific inputs from the following Earth Science Mission Directorate teams: The World Climate Research Program (WCRP) Global Energy and Water Cycle Experiment's (GEWEX) Surface Radiation Budget (NASA/GEWEX SRB) and the Clouds and the Earth's Radiant Energy System (CERES) projects at NASA Langley Research Center and the Global Modeling and Assimilation Office at the NASA Goddard Space Flight Center. The data obtained through the Surface Meteorology and Solar Energy (SSE) web portal was made possible by support from the Atmospheric Sciences Data Center.
Finally, I would like to thank Dr Zeinab Salah Mahmoud (Manager of the Air Pollution Department of EMA) for providing the scripts needed to produce figure 1.
References
- Terink W, Immerzeel WW, Droogers P. Climate change projections of precipitation and reference evapotranspiration for the Middle East and Northern Africa until 2050. Int J Climatol. 2013;33:3055-3072. doi: 10.1002/joc.3650.
- IPCC. Climate Change 2007: Synthesis Report. Technical report, IPCC. 2007.
- Ajjur SB, Al-Ghamdi SG. Global hotspots for future absolute temperature extremes from CMIP6 models. Earth Space Sci. 2021;8:2021. doi: 10.1029/2021EA001817.
- Hamed MM, Iqbal Z, Nashwan MS, Ahmed FK, Shamsuddin S. Diminishing evapotranspiration paradox and its cause in the Middle East and North Africa. Atmos Res. 2023;289:106760. doi: 10.1016/j.atmosres.2023.106760.
- Allen GR, Pereira SL, Raes D, Smith M. Crop evapotranspiration: Guidelines for computing crop water requirements. Food and Agricultural Organization of the United Nations (FAO) Report 56. Rome. 1998;300.
- Howell TA, Steiner JL, Schneider AD, Evett SR, Tolk JA. Seasonal and maximum daily evapotranspiration of irrigated winter wheat, sorghum, and corn-southern high plains. Transactions of the American Society of Agricultural Engineers, ASAE. 1997;40(3):623-634. doi: 10.13031/2013.21321.
- Itenfisu D, Elliot RL, Allen RG, Walter IA. Comparison off reference evapotranspiration calculation as part of the ASCE standardization effort. J Irrig Drain Eng. 2003;129(6):440-448. doi: 10.1061/(ASCE)0733-9437(2003)129:6(440).
- Alkaeed O, Flores C, Jinno K, Tsutsumi A. Comparison of several reference evapotranspiration methods for Itoshima Peninsula area, Fukuoka, Japan. Memoirs of the Faculty of Engineering, Kyushu University. 2006;66(1):1-14.
- Brutsaert W, Parlange MB. Hydrologic cycle explains the evaporation paradox. Nature. 1998;396(6706):30.
- Anwar SA, Salah Z, Khald W, Zakey AS. Projecting the potential evapotranspiration of Egypt using a high-resolution Regional Climate Model (RegCM4). Environ Sci Proc. 2022;19(1):43. doi: 10.3390/ecas2022-12841.
- Anwar SA, Lazić I. Estimating the potential evapotranspiration of Egypt using a regional climate model and a high-resolution reanalysis dataset. Environ Sci Proc. 2023;25(1):29. doi: 10.3390/ECWS-7-14253.
- Anwar SA, Malcheva K, Srivastava A. Estimating the potential evapotranspiration of Bulgaria using a high‑resolution regional climate model. Theor Appl Climatol. 2023;152:1175–1188. doi: 10.1007/s00704-023-04438-9.
- Niaghi AR. Evaluate several potential evapotranspiration methods for regional use in Tabriz, Iran. J Appl Environ Biol Sci. 2013;3(6):31-41.
- Hargreaves GL, Allen RG. History and evaluation of hargreaves evapotranspiration equation. J Irrigat Drain Eng. 2013;129:53-63. doi: 10.1061/(ASCE)0733-9437(2003)129:1(53).
- Irmak S, Irmak A, Allen RG, Jones JW. Solar and net radiation-based equations to estimate reference evapotranspiration in humid climates. J Irrig Drain Eng. 2003;129:5. doi: 10.1061/(ASCE)0733-9437(2003)129:5(336).
- Potop V, Boroneant C. Assessment of potential evapotranspiration at Chisinau station. In: Rožnovsky J, Litschmann T, editors. Mendel and Bioclimatology, Conference proceedings from the Mendel and Bioclimatology International Conference, Czech Republic Brno. September 2014;3(5):343–354.
- Murat C, Hatice C, Tefaruk H, Kisi O. Modifying Hargreaves-Samani equation with meteorological variables for estimation of reference evapotranspiration in Turkey. Hydrology Research. 2007;48(2):480-497. doi: 10.2166/nh.2016.217.
- Sperna Weiland FC, Tisseuil C, Durr HH, Vrac M, van Beek LPH. Selecting the optimal method to calculate daily global reference potential evaporation from CFSR reanalysis data for application in a hydrological model study. Hydrol Earth Syst Sci. 2012;16:983-1000. doi: 10.5194/hess-16-983-2012.
- Giorgi F, Coppola E, Solmon F, Mariotti L, Mouhamadou BS, Xunqiang Bi, N Elguindi, GT Diro, Vijayakumar S Nair, G Giuliani, UU Turuncoglu, S Cozzini, Ivan Güttler, TA O’Brien, AB Tawfik, A Shalaby, Sahar Zakey, Allison L S, Frode Stordal, LC Sloan, Čedo Branković. RegCM4: Model description and preliminary tests over multiple CORDEX domains. Clim Res. 2012;52:7-29. doi: 10.3354/cr01018.
- Harris I, Osborn TJ, Jones P, Lister D Version 4 of the CRU TS monthly high-resolution gridded multivariate climate dataset. Sci Data. 2020;7:109. doi: 10.1038/s41597-020-0453-3.
- Shiri J, Nazemi AH, Sadraddini AA, Landeras G, Kisi O, Fard AF, Mart P. Comparison of heuristic and empirical approaches for estimating reference evapotranspiration from limited inputs in Iran. Comput Electron Agric. 2014;108:230-241. doi: 10.1016/j.compag.2014.08.007.
- Mostafa SM, Anwar SA, Zakey AS, Wahab MMA. Bias-correcting the maximum and minimum air temperatures of Egypt using a high-resolution Regional Climate Model (RegCM4). Eng Proc. 2023;31:73. doi: 10.3390/ASEC2022-13852.
- Kiehl JT, Hack JJ, Bonan GB, Boville BA, Briegleb BP, Williamson DL, Rasch PJ. Description of the NCAR Community Climate Model (CCM3) (No. NCAR/TN-420+STR). University Corporation for Atmospheric Research. 1996. doi: 10.5065/D6FF3Q99.
- Holtslag AAM, Boville BA. Local versus nonlocal boundary layer diffusion in a global model. J Climate. 1993;6:1825-1842. doi: 10.1175/1520-0442(1993)006<1825:LVNBLD>2.0.CO;2.
- Emanuel KA. A scheme for representing cumulus convection in large-scale models. J Atmos Sci. 1991;48(21):2313-2335. doi: 10.1175/1520-0469(1991)048<2313:ASFRCC>2.0.CO;2.
- Anwar SA, Hejabi S. The influence of different initial conditions on the soil temperature profile of Egypt using a regional climate model. Eng Proc. 2023;31:62. doi: 10.3390/ASEC2022-13850.
- Dee DP, Uppala SM, Simmons AJ, Berrisford P, P Poli, S Kobayashi, U Andrae, MA Balmaseda, G Balsamo, P Bauer, P Bechtold, ACM Beljaars, L van de Berg, J Bidlot, N Bormann, C Delsol, R Dragani, M Fuentes, AJ Geer, L Haimberger, SB Healy, H Hersbach, EV Hólm, L Isaksen, P Kållberg, M Köhler, M Matricardi, AP McNally, BM Monge-Sanz, JJ Morcrette, BK Park, C Peubey, P de Rosnay, C Tavolato, JN Thépaut, F Vitart. The ERA‐Interim reanalysis: Configuration and performance of the data assimilation system. QJR Meteorol Soc. 2011;137:553-597. doi: 10.1002/qj.828.
- Taylor KE. Summarizing multiple aspects of model performance in a single diagram. J Geophysical Research. 2001;106(D7):7183-7192. doi: 10.1029/2000JD900719.
- Er-Raki S, Chehbouni A, Khabba S, Simonneaux V, Jarlan L, Ouldbba A, Rodriguez JC, Allen R. Assessment of reference evapotranspiration methods in semi-arid regions: Can weather forecast data be used as alternate of ground meteorological parameters? J Arid Environ. 2010;74(12):1587-1596. doi: 10.1016/j.jaridenv.2010.07.002.
- Srivastava A, Sahoo B, Raghuwanshi NS, Singh R. Evaluation of variable-infiltration capacity model and MODIS-terra satellite-derived grid-scale evapotranspiration estimates in a River Basin with Tropical Monsoon-Type climatology. J Irrig Drain. Eng. 2017;143(8). doi: 10.1061/(ASCE)IR.1943-4774.0001199.
- Srivastava A, Kumari N, Maza M. Hydrological response to agricultural land use heterogeneity using variable infiltration capacity model. Water Resour Manag. 2020;34(12):3779-3794. doi: 10.1007/s11269-020-02630-4.
- Jonathan S, Paulo B, Edoardo B, John C, Tereza Ca, Alessandro C, Jens H C, Ole B C, Erika C, Jason P E, Giovanni F, Beate G, Filippo G, Daniela J, Jack K, Torben K, René L, Christopher JL, Levent KM, Delei L, Marta L, Niall MC, Gustavo N, Grigory N, Tugba O, Hans-Jürgen P, Rosmeri PR, Silvina A S, Jozef S, Fredolin T, Claas T, Robert V, Jürgen VV, Katja W, George Zi, Alessandro D. Global exposure of population and land-use to meteorological droughts under different warming levels and SSPs: A CORDEX-based study. Int J Climatol. 2021;41(15):6825-6853. doi: 10.1002/joc.7302.
- Anwar SA, Mamadou O, Diallo I, Sylla MB. On the influence of vegetation cover changes and vegetation-runoff systems on the simulated summer potential evapotranspiration of tropical Africa using RegCM4. Earth Syst Environ. 2021;5:883-897. doi: 10.1007/s41748-021-00252-3.
- Taylor KE, Stouffer RJ, Meehl GA. An Overview of CMIP5 and the experiment design. Bull Amer Meteor Soc. 2012;93:485-498. doi: 10.1175/BAMS-D-11-00094.1.
- Eyring V, Bony S, Meehl GA, Senior CA, Stevens B, Stouffer RJ, Taylor KE. Overview of the coupled model intercomparison project Phase 6 (CMIP6) experimental design and organization. Geosci Model Dev. 2016;9:1937-1958. doi: 10.5194/gmd-9-1937-2016.
- Anwar SA. Influence of direct-downscaling and one-way nesting on daily mean air temperature of Egypt using the RegCM4. J Biomed Res Environ Sci. 2023;4(3):338-347. doi: 10.37871/jbres1681.
- Anwar SA, Mostafa SM. On the sensitivity of the daily mean air temperature of Egypt to boundary layer schemes using a high-resolution regional climate model (RegCM4). J Biomed Res Environ Sci. 2023;4(3):474-484. doi: 10.37871/jbres1700.
Content Alerts
SignUp to our
Content alerts.
 This work is licensed under a Creative Commons Attribution 4.0 International License.


