Environmental Sciences Group. 2024 May 20;5(5):420-429. doi: 10.37871/jbres1910.
Optimum Bleaching Efficiency of Activated Ntezi Bentonite using Response Surface Methodology
Ajemba Regina Obiageli, Nweke Chinenyenwa Nkeiruka*, John Sunday Uzochukwu, Ejiofor Calista Chimelogo
- Activation
- Adsorption
- ANOVA
- Bleaching
- Clay
- Response surface methodology
Abstract
The optimization of the bleaching efficiency of acid-activated Ntezi bentonite was studied by reacting raw bentonite with different concentrations of hydrochloric acid solution for varying periods to activate it. The raw and activated samples were characterized using X-ray fluorescence. The activated samples were used to bleach palm oil and the effects of bleaching process variables were investigated using the Response Surface Methodology (RSM). Results of the analysis showed that the structure of the bentonite was altered by the acid activation and this increased the adsorptive capacity of the activated samples. The statistical analysis indicated that the main and quadratic effects of the bleaching process parameters were significant at the 95% confidence level. The optimum conditions were determined to be: reaction temperature 156.66°C; reaction time, 2.74 hours; adsorbent dosage, 5.93 g; adsorbent/oil ratio, 0.04 g/ml; and stirring speed, 411.62 rpm. Under these conditions, the optimum bleaching efficiency was determined to be 85.48%, which agreed with the experimental value of 86.07%. This study showed that Ntezi bentonite can be used as an effective adsorbent under optimized process conditions.
Abbreviations
RSM: Response surface methodology; ANOVA: Analysis of variance; CaO: Calcium oxide; MgO: Magnesum oxide; Al2O3: Aluminium oxide; CCD: Central composite design ;BBD: Box Behnken design; HCl: Hydrochloride; UV-Vis: Ultraviolet visible
Introduction
Because of their low cost, abundance in most continents of the world, high sorption properties, high dissolubility in acidic solutions, and potential for ion exchange, clay materials are strong candidates as sources of metals and adsorbents. Two structural units are involved in the atomic lattices of most clay minerals one unit consists of closely packed oxygen and hydroxyls in which aluminum, iron and magnesium atoms are embedded in an octahedral combination so that they are equidistant from six oxygen or hydroxyls. The second unit is built of silica tetrahedrons. The silica tetrahedrons are arranged to form a sheet of composition, Si4O6 (OH)4 [1]. Acid treatment of clays changes the clay structure by creating new pores resulting in an increase of surface acidity through the replacement of cations like Al3+, Fe3+, and Ca2+ from the structure with H+. During clay activation with mineral acids, two basic reactions occur: (1) the acid first dissolves part of Al2O3 as well as CaO, MgO… etc., from the lattice. This causes an opening of the crystal lattice and an increase in internal surface area. (2) The second reaction is the gradual exchange of Al, Ca, and Mg ions, located at the surface of the crystal against hydrogen ions from the mineral acid. These metallic ions then react with the negative ions from the mineral acid forming the corresponding salts. Different types of acid treatment have been described in the literature, varying from each other by the nature of the acid used, temperature, intensity, and time of the attack [2,3]. Acid treatment of clay minerals, namely fibrous clays [4-7], smectites [8-10], and Kaolinite [11] is widely applied to optimize their physicochemical behaviour, aiming for better industrial properties.
Designing experiments and standardization of variables affecting the system is very critical in the optimization process. Generally, this optimization is carried out by using the traditional one-factor-at-a-time method, which is simple, time and chemicals are consumed in large quantities. Moreover, this method neglects the interaction effects of process variables. Response Surface Methodology (RSM) is a useful model for studying the effect of several factors influencing the response variable by varying them simultaneously and carrying out a limited number of experiments. The two most commonly used designs in RSM are Central Composite Design (CCD) and Box Behnken Design (BBD) [12]. This methodology was widely adopted in industries such as the drug and food industry, and chemical and biological processes, for either producing high-quality products or operating the process more economically and ensuring the process is more stable and reliable [13]. It has also been successfully applied to different processes for achieving its optimization using experimental designs [14-27].
Experimental Procedures
Acid activation of the clay sample
The clay material was prepared for activation by air-drying and grinding to a particle size of 0.075 mm. 10 g of the prepared sample was weighed into a flask (250 ml capacity) and 100 ml of hydrochloric acid solution was added. The resulting suspension was heated on a magnetically stirred hot plate at a temperature of 90°C for 2 hours and 30 minutes. At the end of the experimental duration, the resulting slurry was poured into a Buchner funnel to separate the acid and clay. The residual clay was washed severally with distilled water until the neutral point was obtained with a pH indicator. The clay residue was dried in an oven at 80°C for 4 hours. The dried samples were crushed and sieved again to 0.075 mm particle size. The activation process was repeated with varying acid concentrations of 0.5-8 mol/L of HCl, varying time of 0.5-6 hours, varying solid/liquid ratio of 0.01-0.1 g/mol, varying stirring speed of 90-540 rpm, and varying temperatures of 50- 180°C.
Bleaching experiment
The bleaching experiments were carried out in a batch process. 50 g of the refined palm oil was charged into a 250 ml beaker and 2 g of the activated clay samples were also added. The mixture of clay and oil was placed in a water bath and heated to a temperature of 80°C for 30 minutes under continuous stirring. At the end of the reaction, the slurry formed was filtered through a dry filter paper. The bleaching capacity of the acid-activated clays was then determined by measuring the colour of the bleached oils using a UV-Vis spectrophotometer (Shimadzu UV mini 1240) at a wavelength of 450 nm. The bleaching efficiency of the acid-activated clay was calculated in this study using the following equation [28,29]:
% Bleaching Efficiency = ((A_unbleached-A_bleached))/A_unbleached × 100% (1)
Where A unbleached and A bleached are the absorbencies of the unbleached and bleached oils, respectively.
Design of experiment
The process variables affecting the dissolution of Ntezi bentonite in hydrochloric acid were investigated using RSM combined with five-level, five-factor fractional factorial design as established by Statistica software (10 trial version), Statsoft, U. S. A. The process variables were reaction temperature of 70-180°C, reaction time of 0.5-4.0 hrs, adsorbent dosage 0.5-10.0 g; adsorbent/oil ratio of 0.02-0.08 g/ml, and stirring speed of 90-540 rpm. The response variable was chosen as % bleaching efficiency. The factor levels were coded as – α, - 1, 0, + 1 and + α. The range and levels are shown in table 1.
| Table 1: Experimental range of the independent variables with different levels. | ||||||
| Variables | Symbol | Range and Levels | ||||
| -α | -1 | 0 | +1 | +α | ||
| Reaction temperature (°C) | X1 | 15 | 70 | 125 | 180 | 235 |
| Reaction time (hours) | X2 | -1.25 | 0.5 | 2.25 | 4.0 | 5.75 |
| Adsorbent dosage (g) | X3 | -4.25 | 0.5 | 5.25 | 10.0 | 14.75 |
| Adsorbent/Oil ratio (g/ml) | X4 | -0.01 | 0.02 | 0.05 | 0.08 | 0.11 |
| Stirring speed (rpm) | X5 | -135 | 90 | 315 | 540 | 765 |
A total of 31 runs were carried out to optimize the process variables and experiments were performed according to the actual experimental design matrix shown in table 2. The experiments were performed randomly to avoid systemic error. The results were analyzed using the coefficient of determination, analysis of variance (ANOVA), and response plots. In RSM, the most widely used second-order polynomial equation developed to fit the experimental data and identify the relevant model terms may be written as:
| Table 2: Experimental design matrix and the experimental and predicted values for bleaching efficiency (%). | ||||||||||||
| Run order | Reaction temperature (°C), X1 | Reaction time (hrs), X2 | Adsorbent dosage (g), X3 | Adsorbent/Oil ratio (g/ml), X4 | Stirring speed (rpm), X5 | Bleaching efficiency (%) | ||||||
| Coded | Real | Coded | Real | Coded | Real | Coded | Real | Coded | Real | Exp | Pred | |
| 1 | -1 | 70 | -1 | 0.5 | -1 | 0.5 | -1 | 0.5 | +1 | 540 | 49 | 47.34 |
| 2 | -1 | 70 | -1 | 0.5 | -1 | 0.5 | +1 | 10 | -1 | 90 | 45 | 40.42 |
| 3 | -1 | 70 | -1 | 0.5 | +1 | 6.0 | -1 | 0.5 | -1 | 90 | 51 | 44.96 |
| 4 | -1 | 70 | -1 | 0.5 | +1 | 6.0 | +1 | 10 | +1 | 540 | 40 | 43.46 |
| 5 | -1 | 70 | +1 | 4 | -1 | 0.5 | -1 | 0.5 | -1 | 90 | 57 | 53.17 |
| 6 | -1 | 70 | +1 | 4 | -1 | 0.5 | +1 | 10 | +1 | 540 | 54 | 49.41 |
| 7 | -1 | 70 | +1 | 4 | +1 | 6.0 | -1 | 0.5 | +1 | 540 | 63 | 54.97 |
| 8 | +1 | 70 | +1 | 4 | +1 | 6.0 | +1 | 10 | -1 | 90 | 55 | 51.64 |
| 9 | +1 | 180 | -1 | 0.5 | -1 | 0.5 | -1 | 0.5 | -1 | 90 | 67 | 54.93 |
| 10 | +1 | 180 | -1 | 0.5 | -1 | 0.5 | +1 | 10 | +1 | 540 | 62 | 54.51 |
| 11 | +1 | 180 | -1 | 0.5 | +1 | 6.0 | -1 | 0.5 | +1 | 540 | 66 | 58.75 |
| 12 | +1 | 180 | -1 | 0.5 | +1 | 6.0 | +1 | 10 | -1 | 90 | 49 | 51.63 |
| 13 | +1 | 180 | +1 | 4 | -1 | 0.5 | -1 | 0.5 | +1 | 540 | 68 | 62.21 |
| 14 | +1 | 180 | +1 | 4 | -1 | 0.5 | +1 | 10 | -1 | 90 | 53 | 53.81 |
| 15 | +1 | 180 | +1 | 4 | +1 | 6.0 | -1 | 0.5 | -1 | 90 | 56 | 56.42 |
| 16 | +1 | 180 | +1 | 4 | +1 | 6.0 | +1 | 10 | +1 | 540 | 71 | 66.92 |
| 17 | -2 | 15 | 0 | 2.25 | 0 | 3.25 | 0 | 5.25 | 0 | 315 | 57 | 58.65 |
| 18 | +2 | 235 | 0 | 2.25 | 0 | 3.25 | 0 | 5.25 | 0 | 315 | 74 | 71.54 |
| 19 | 0 | 125 | -2 | -1.25 | 0 | 3.25 | 0 | 5.25 | 0 | 315 | 59 | 58.12 |
| 20 | 0 | 125 | +2 | 5.75 | 0 | 3.25 | 0 | 5.25 | 0 | 315 | 72 | 70.44 |
| 21 | 0 | 125 | 0 | 2.25 | -2 | -2.25 | 0 | 5.25 | 0 | 315 | 55 | 54.73 |
| 22 | 0 | 125 | 0 | 2.25 | +2 | 8.75 | 0 | 5.25 | 0 | 315 | 69 | 67.32 |
| 23 | 0 | 125 | 0 | 2.25 | 0 | 3.25 | -2 | -4.25 | 0 | 315 | 66 | 59.96 |
| 24 | 0 | 125 | 0 | 2.25 | 0 | 3.25 | +2 | 14.75 | 0 | 315 | 52 | 57.83 |
| 25 | 0 | 125 | 0 | 2.25 | 0 | 3.25 | 0 | 5.25 | -2 | - 135 | 50 | 52.65 |
| 26 | 0 | 125 | 0 | 2.25 | 0 | 3.25 | 0 | 5.25 | +2 | 765 | 67 | 66.83 |
| 27 | 0 | 125 | 0 | 2.25 | 0 | 3.25 | 0 | 5.25 | 0 | 315 | 82 | 81.65 |
| 28 | 0 | 125 | 0 | 2.25 | 0 | 3.25 | 0 | 5.25 | 0 | 315 | 83 | 81.65 |
| 29 | 0 | 125 | 0 | 2.25 | 0 | 3.25 | 0 | 5.25 | 0 | 315 | 82 | 81.65 |
| 30 | 0 | 125 | 0 | 2.25 | 0 | 3.25 | 0 | 5.25 | 0 | 315 | 83 | 81.65 |
| 31 | 0 | 125 | 0 | 2.25 | 0 | 3.25 | 0 | 5.25 | 0 | 315 | 83 | 81.65 |
Y=β_0+[∑β]_i x_i+[∑β]_ii x_ii^2+[∑β]_ij x_i x_j+ε (2)
where Y is the predicted response variable, in this study the % bleaching efficiency, β0 is the constant coefficient, βi is the ith linear coefficient of the input variable xi, βii is the ith quadratic coefficient of the input variable xi, βij is the different interaction coefficients between the input variables xi and xj, and ε is the error of the model.
Statistical analysis
The generated experimental data were analyzed using the Statistica 10 trial version software by StatSoft Inc. USA and then interpreted. The analytical steps used include analysis of variance (ANOVA), regression analysis, and response plots of the interaction effects of the factors to evaluate optimum conditions for the bleaching process. The linear, quadratic, and linear interactive effects of the process variables on the bleaching efficiency were calculated and their respective significance was evaluated by ANOVA test. The p-value was used as the yardstick for measuring the significance of the regression coefficients, values of p greater than 0.05 signified that the coefficient is significant. The experimental data were fitted to the second-order polynomial regression model and the adequacy of the model was tested by the coefficient of determination (R2) value as compared to the adjusted R2 value.
Results and Discussions
Chemical composition of bentonite samples
The chemical composition of the natural and treated bentonite samples is shown in table 3. The content of SiO2 was observed to increase as the acid concentration increased up to 6 mol/L and decreased with further increase in acid concentration and this could be due to the formation of mullite which protects the clay layers from further acid attack. The contents of the octahedral cations (Al2O3, Fe2O3, and MgO) decreased intensely as the acid concentration increased and they were increased with further attack after 6 mol/L concentration (Table 3). The behaviour shown by the Al2O3, Fe2O3, and MgO contents with progressive acid treatment is related to the progressive dissolution of the clay mineral. The octahedral sheet destruction passes the cations into the solution, while the silica generated by the tetrahedral sheet remains in the solid phase due to its insolubility [30,31]. Suggest that this free silica generated by the initial destruction of the tetrahedral sheet is polymerized by the effect of such high acid concentration and is deposited on the undestroyed silicate fractions, thereby protecting it from further acid attack [6,32].
| Table 3: Chemical composition and Si/ [Al + Fe + Mg] of natural and HCl activated bentonite from Ntezi. | |||||||
| Chemical composition | Clay samples | ||||||
| NZ0 | NZ0.5 | NZ1 | NZ2 | NZ4 | NZ6 | NZ8 | |
| Al2O3 | 16.54 | 13.87 | 10.23 | 7.09 | 5.94 | 2.41 | 2.88 |
| SiO2 | 54.72 | 59.93 | 65.84 | 69.75 | 72.53 | 75.61 | 76.09 |
| Fe2O3 | 13.23 | 10.14 | 8.06 | 5.04 | 3.78 | 2.17 | 2.23 |
| CaO | 0.41 | 0.35 | 0.21 | 0.12 | 0.04 | 0.01 | 0.01 |
| MgO | 7.10 | 5.36 | 3.19 | 2.16 | 1.49 | 0.52 | 0.54 |
| K2O | 0.35 | 0.16 | 0.09 | 0.03 | 0.01 | 0.01 | 0.01 |
| TiO2 | 1.24 | 0.93 | 0.68 | 0.48 | 0.27 | 0.14 | 0.06 |
| Na2O | 0.04 | 0.02 | 0.01 | 0.01 | 0.01 | 0.001 | 0.001 |
| ZnO | 0.89 | 0.57 | 0.38 | 0.19 | 0.11 | 0.04 | 0.02 |
| LOI | 5.28 | 3.85 | 3.16 | 2.42 | 1.94 | 1.65 | 1.11 |
| Total | 99.80 | 95.18 | 91.85 | 87.29 | 86.12 | 82.561 | 82.951 |
| Si/[Al + Fe + Mg] | 1.48 | 2.04 | 3.07 | 4.88 | 6.47 | 14.83 | 13.47 |
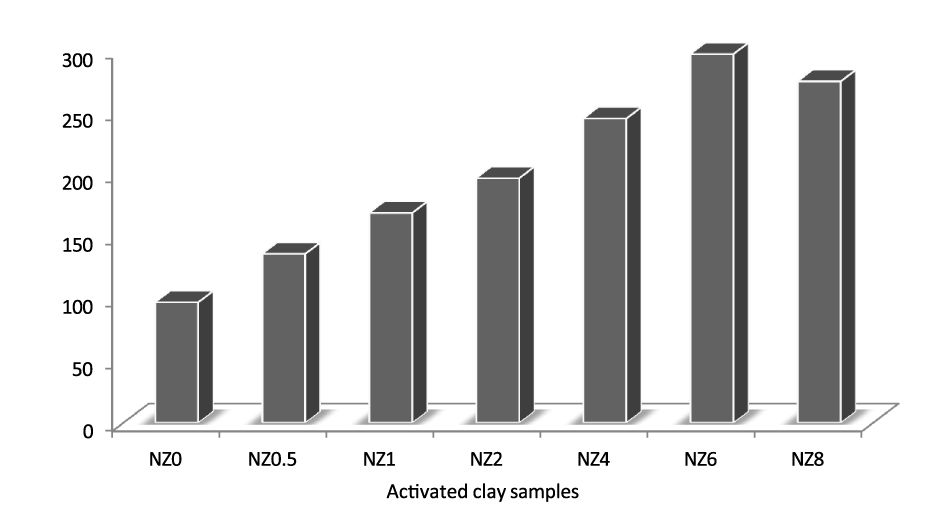
The acid-activation was carried out with hydrochloric acid concentration range from 0.5mol/l to 8mol/l. [33] reported that the surface area of acid activated bentonite generally increases with an increase in acid concentration until a maximum surface area is reached after which it gradually decreases. In this study, the surface area was observed to increase with increase in acid concentration from 2mol/l to 6mol/l. A maximum surface area was obtained with 6 mol/l HCl as shown in figure 1. This increase in surface area with the rise in acid concentration is attributed to the removal of impurities, and replacement of exchangeable cations such as K+, Na+, and Ca2+, with hydrogen ions and leaching out of Al3+, Fe3+, and Mg2+ from the octahedral and tetrahedral sheets which expose the edges of the platelets [34]. The decrease in the surface area with afurther increase in acid concentration could be attributed to the deeper penetration of the acid into the voids and excessive leaching of Al3+, Fe3+, and Mg2+, resulting in the collapse of the crystalline structure [31].
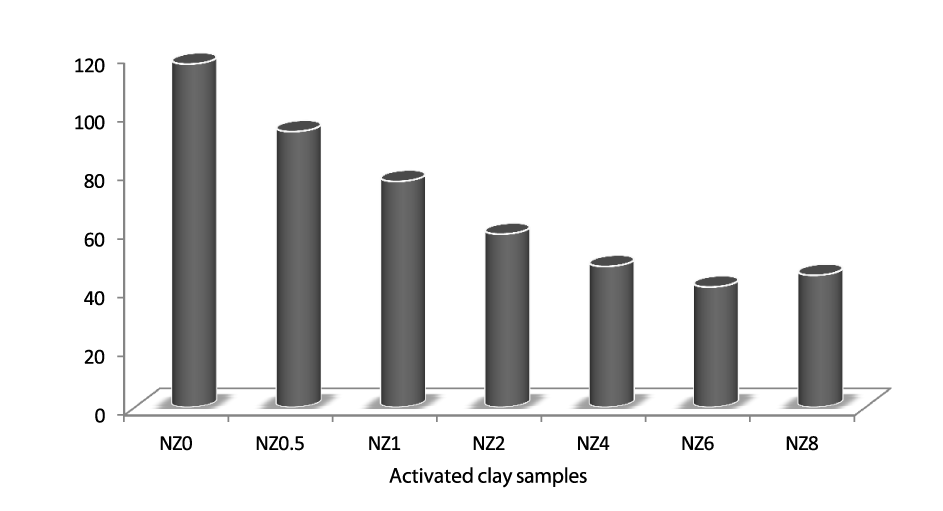
The results of the cation exchange capacity of the activated samples show that the exchangeability of the activated samples decreased as the concentration of the acid used in the activation increased (Figure 2). With the increase in concentration of hydrochloric acid, the bentonite showed a gradual decrease of the CEC until dissolving with 6 mol/l acid. In treatment with 8 mol/l HCl acid, as the SiO2 content decreased, an increase of CEC was observed in comparison with the CEC observed with the sample treated with 6 mol/l. This is due to the removal of the exchangeable ions from the lattice of the clay samples by the acid hydrogen ion which occupies the vacant sites created by the removal of the octahedral and tetrahedral ions.
Evaluation of regression model for bleaching efficiency
The correlation between the experimental process variables and the bleaching efficiency was evaluated using the CCD modeling technique. Second-order polynomial regression equation fitted between the response (bleaching efficiency, (Y)) and the process variables: reaction temperature (X1), reaction time (X2), adsorbent dosage (X3), adsorbent/oil ratio (X4) and stirring speed (X5).
From table 4, the ANOVA results showed that the quadratic model is suitable to analyze the experimental data. The model in terms of the actual values of the process parameters is given by:
| Table 4: ANOVA for analysis of bleaching efficiency, values of regression coefficients and their significant test and effects. | ||||||||
| Source | Coeff. | Sum of Squares | df | Mean Square | f-value | Std. Err. | t(15) | p-value |
| Model | 82.68 | 4261.63 | 20 | 4261.63 | 89.67 | 1.353 | 61.09 | 0.000000 |
| (1) Reaction temperature (°C)(L*) | 4.67 | 522.67 | 1 | 522.67 | 53.99 | 0.635 | 7.348 | 0.000025 |
| Reaction temperature (°C)(Q**) | -4.34 | 531.28 | 1 | 531.28 | 54.88 | 0.586 | -7.408 | 0.000023 |
| (2)Reaction time (hrs)(L) | 3.08 | 228.17 | 1 | 228.17 | 23.57 | 0.635 | 4.855 | 0.000667 |
| Reaction time (hrs)(Q) | -4.34 | 531.28 | 1 | 531.28 | 54.88 | 0.586 | -7.408 | 0.000023 |
| (3)Adsorbent dosage (g)(L) | 1.00 | 24.00 | 1 | 24.00 | 2.48 | 0.635 | 1.575 | 0.146452 |
| Adsorbent dosage (g)(Q) | -5.22 | 767.03 | 1 | 767.03 | 79.23 | 0.586 | -8.901 | 0.000005 |
| (4) Adsorbent/Oil ratio (g/ml)(L) | -3.16 | 240.67 | 1 | 240.67 | 24.86 | 0.635 | -4.986 | 0.000549 |
| Adsorbent/Oil ratio (g/ml)(Q) | -5.97 | 1003.46 | 1 | 1003.46 | 103.65 | 0.586 | - 10.181 | 0.000001 |
| (5)Stirring speed(rpm)(L) | 3.08 | 228.17 | 1 | 228.17 | 23.57 | 0.635 | -3.214 | 0.000667 |
| Stirring speed (rpm)(Q) | -6.09 | 1045.95 | 1 | 1045.95 | 108.04 | 0.586 | - 10.394 | 0.000001 |
| 1L by 2L | -2.50 | 100.00 | 1 | 100.00 | 10.33 | 0.778 | -3.214 | 0.009270 |
| 1L by 3L | -0.75 | 9.00 | 1 | 9.00 | 0.93 | 0.778 | -0.964 | 0.357696 |
| 1L by 4L | 0.25 | 1.00 | 1 | 1.00 | 0.10 | 0.778 | 0.321 | 0.754531 |
| 1L by 5L | 2.75 | 121.00 | 1 | 121.00 | 12.50 | 0.778 | 3.535 | 0.005399 |
| 2L by 3L | 1.88 | 56.25 | 1 | 56.25 | 5.81 | 0.778 | 2.410 | 0.036657 |
| 2L by 4L | 1.63 | 42.25 | 1 | 42.25 | 4.36 | 0.778 | 2.089 | 0.063231 |
| 2L by 5L | 1.88 | 56.25 | 1 | 56.25 | 5.81 | 0.778 | 2.410 | 0.036657 |
| 3L by 4L | 0.38 | 2.25 | 1 | 2.25 | 0.23 | 0.778 | 0.482 | 0.640122 |
| 3L by 5L | 1.12 | 20.25 | 1 | 20.25 | 2.09 | 0.778 | 1.446 | 0.178710 |
| 4L by 5L | 0.63 | 6.25 | 1 | 6.25 | 0.65 | 0.778 | 0.804 | 0.440380 |
| Error | 96.813 | 10 | 9.681 | |||||
| Total SS | 4419.548 | 30 | ||||||
| R2 = 0.9781 Adj. R2 = 0.9343 *Linear effect **Quadratic | ||||||||
Y = 82.68 + 4.67X1 + 3.08X2 + 1.00X3 – 3.16X4 + 3.08X5 – 2.50X1X2 – 0.75X1X3 + 0.25X1X4 + 2.75X1X5 + 1.88X2X3 + 1.63X2X4 + 1.88X2X5 + 0.38X3X4 + 1.12X3X5 + 0.63X4X5 – 4.34X 2 – 4.34X22 – 5.22X32 – 5.97X42 – 6.09X52 (3)
To develop a statistically significant regression model, the significance of the regression coefficients was evaluated based on the p-values. The coefficient terms with p-values more than 0.05 are insignificant and are removed from the regression model. The analysis in table 4 shows that linear, quadratic, and interaction terms of temperature and time are significant model terms. The model reduces to Equation (4) after eliminating the insignificant coefficients.
Y = 82.68 + 4.67X1 + 3.08X2 – 3.16X4 + 3.08X5 – 2.50X1X2 + 2.75X1X5 + 1.88X2X3 + 1.88X2X5 – 4.34X 2 – 4.34X 2 – 5.22X 2 – 5.97X 2 – 6.09X 2 (4)
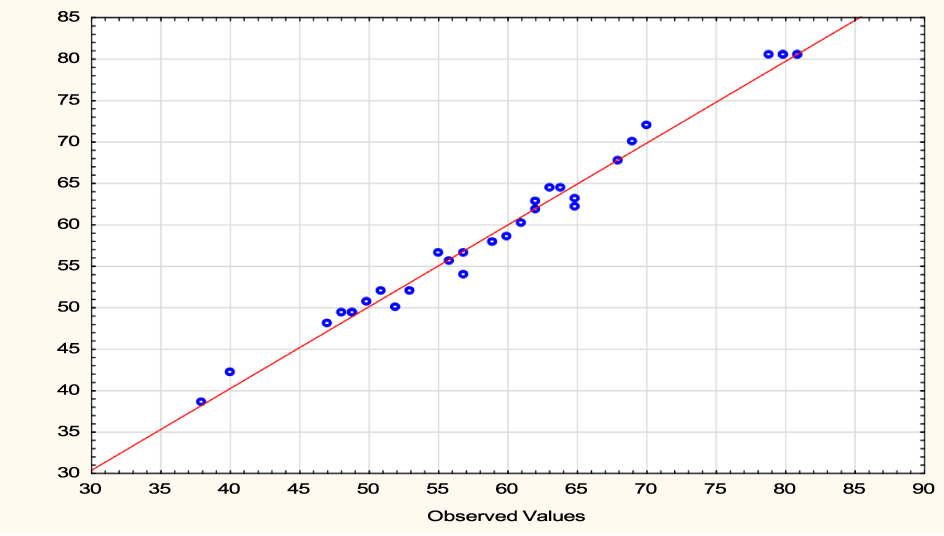
The analysis of variance indicated that the quadratic polynomial model was significant and adequate to represent the actual relationship between bleaching efficiency and the significant model variable as depicted by a very small p-value (0.0000). The significance and adequacy of the established model were further elaborated by the high value of coefficient of determination (R2) value of 0.9781 and adj. R2 value of 0.9343. This means that the model explains 97.81% of the variation in the experimental data. The adequate correlation between the experimental values of the independent variable and predicted values further showed the adequacy of the model as illustrated in figure 3.
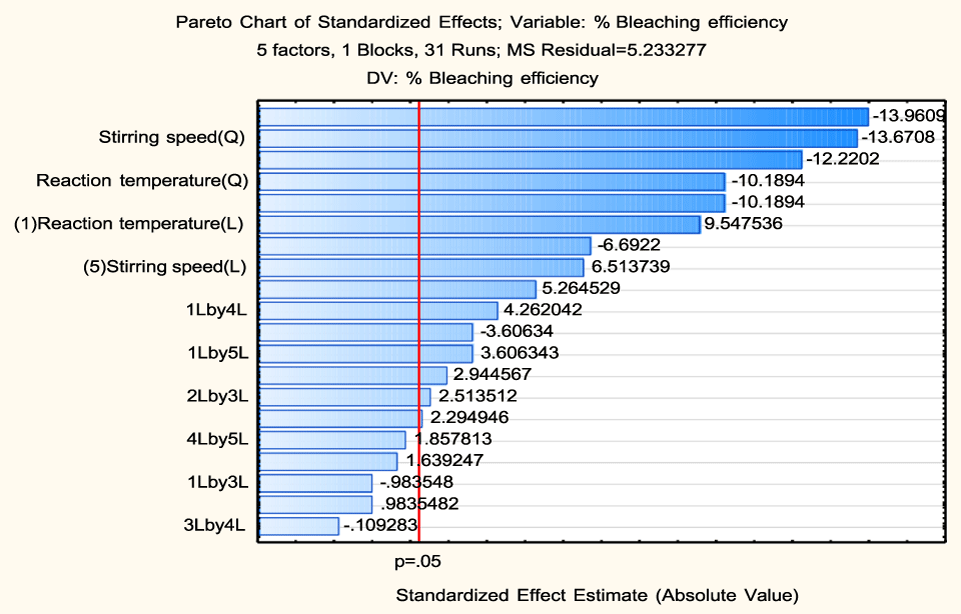
Figure 4 shows the linear, quadratic, and interaction effects of the independent variables, at the 95% confidence level, on the bleaching efficiency. It can be seen that all the variables were significant at the linear and quadratic levels, except the linear effect of adsorbent dosage. The largest main effect observed in the bleaching efficiency was the variable stirring speed at the quadratic level, followed by the adsorbent/oil ratio (quadratic level). These variables have a negative effect on the response variable, that is, their increase reduces the bleaching efficiency. The figure also shows that reaction temperature has the largest positive effect at the linear level followed by the reaction time and stirring speed (linear), then the interaction terms between reaction temperature and stirring speed; reaction time and adsorbent dosage; reaction time and stirring speed; while the interaction term between reaction temperature and reaction time has a negative effect on the response variable. Moreover, the interactive effects between the other independent variables were not significant.
Response surface plots
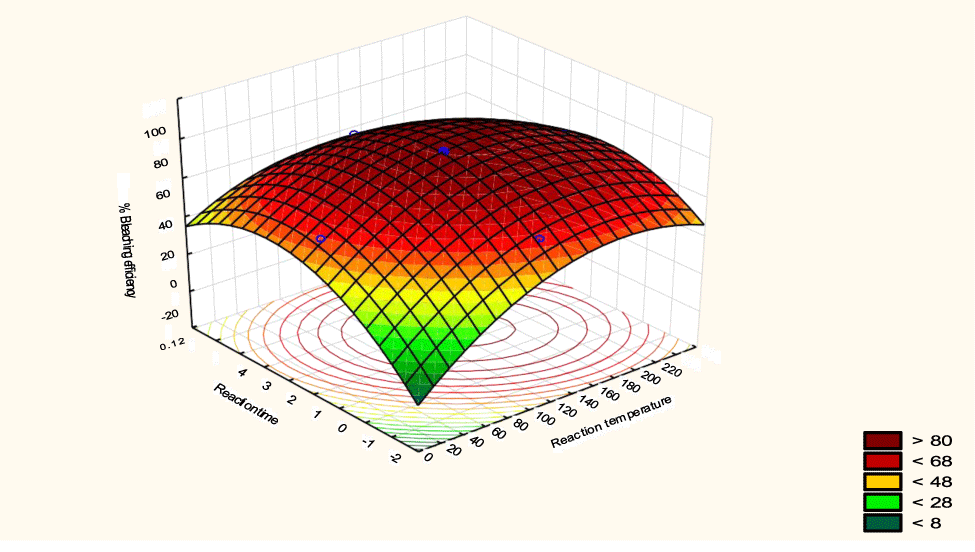
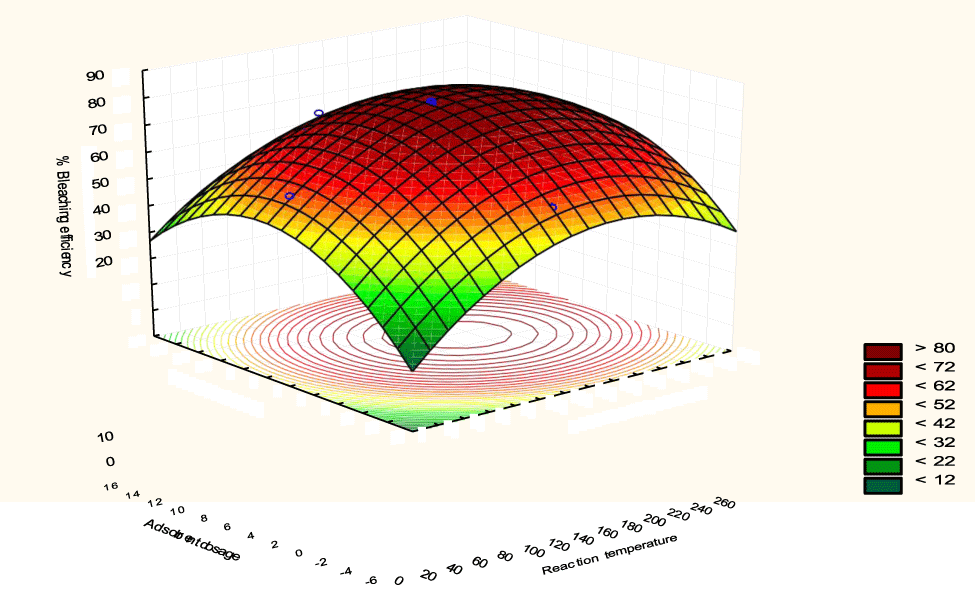
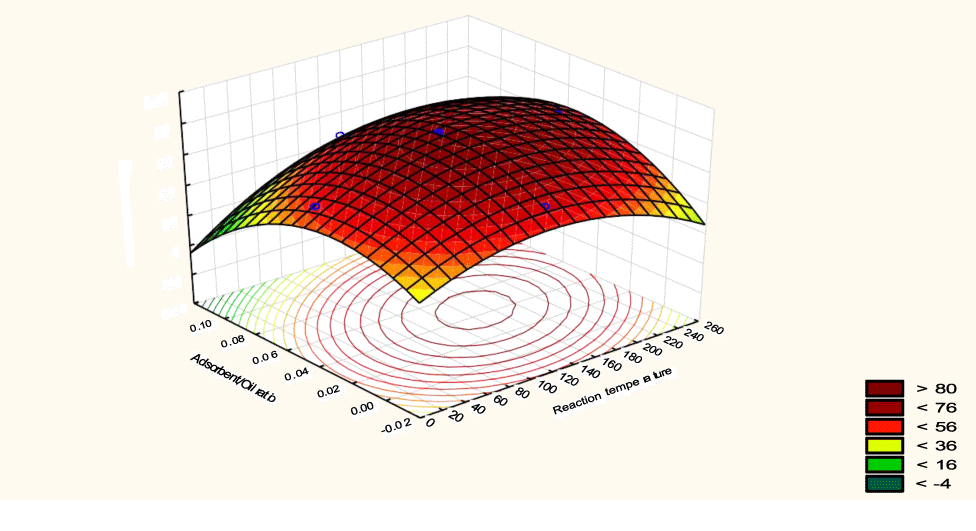
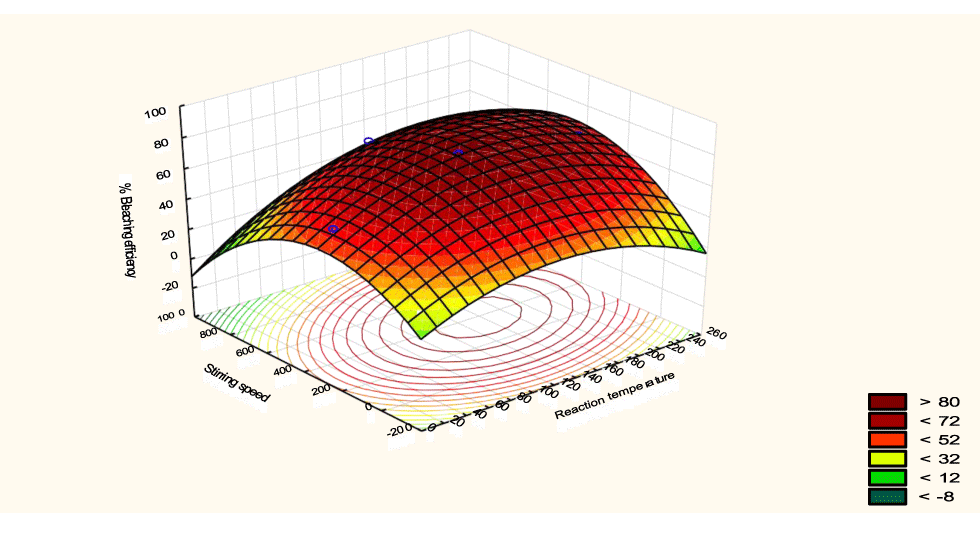
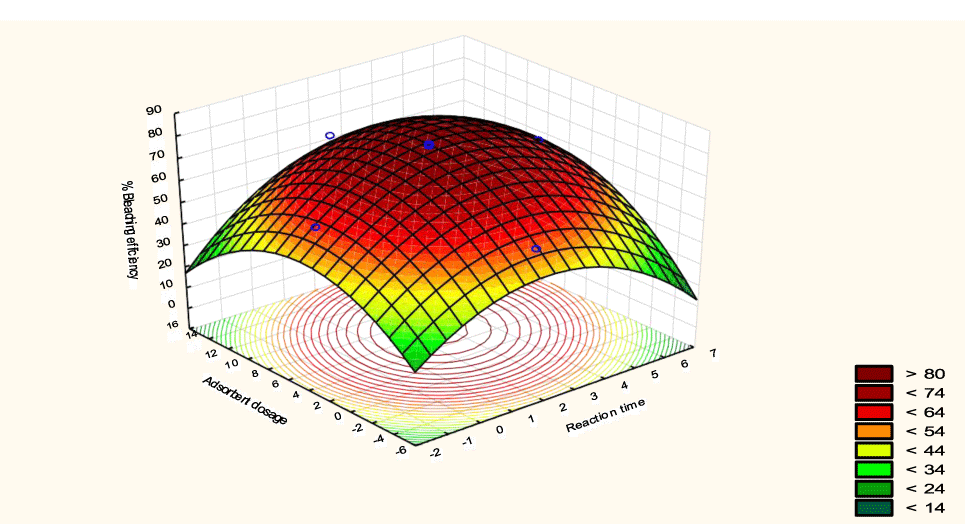
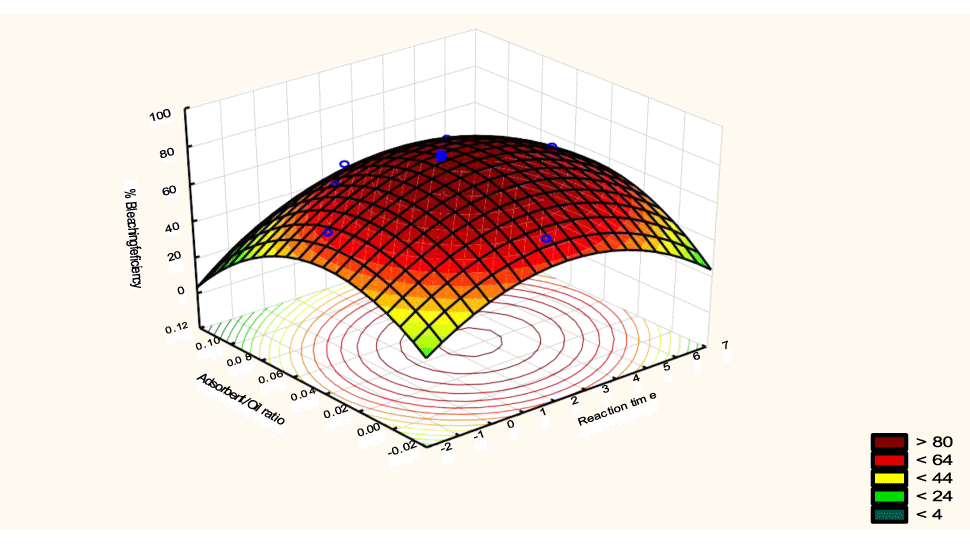
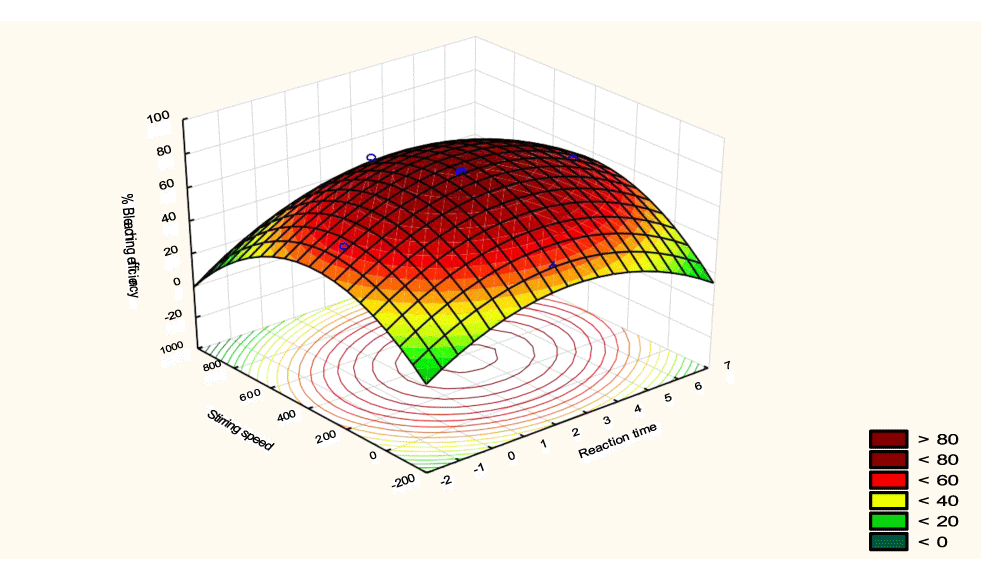
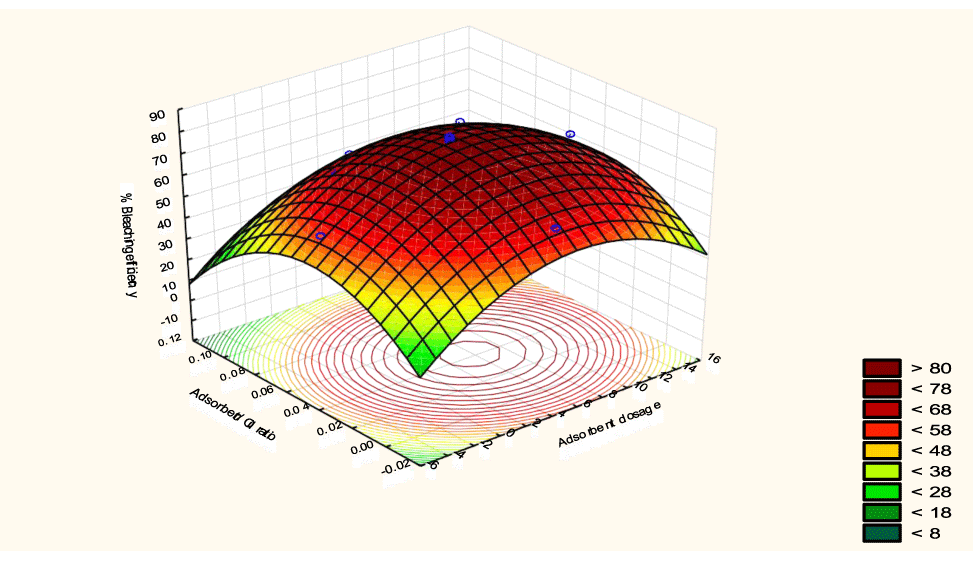
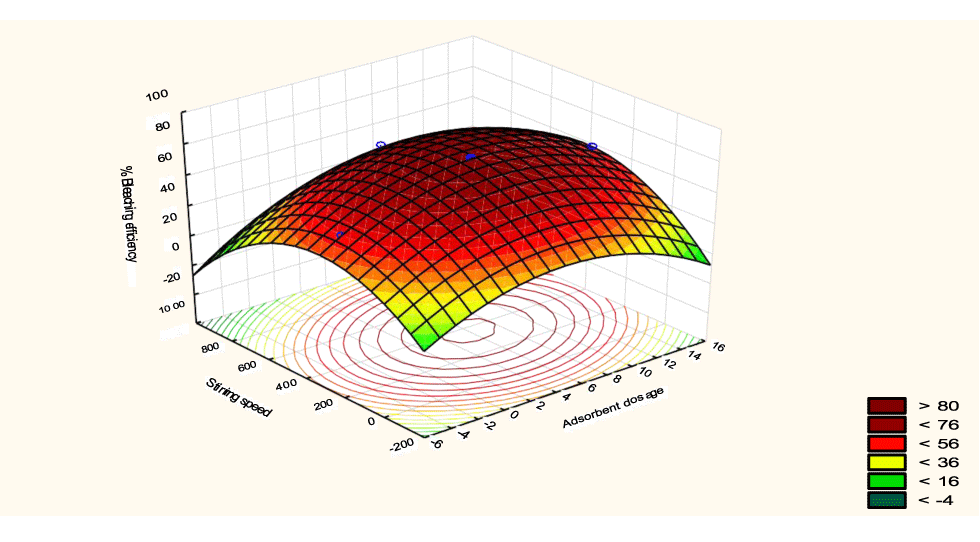
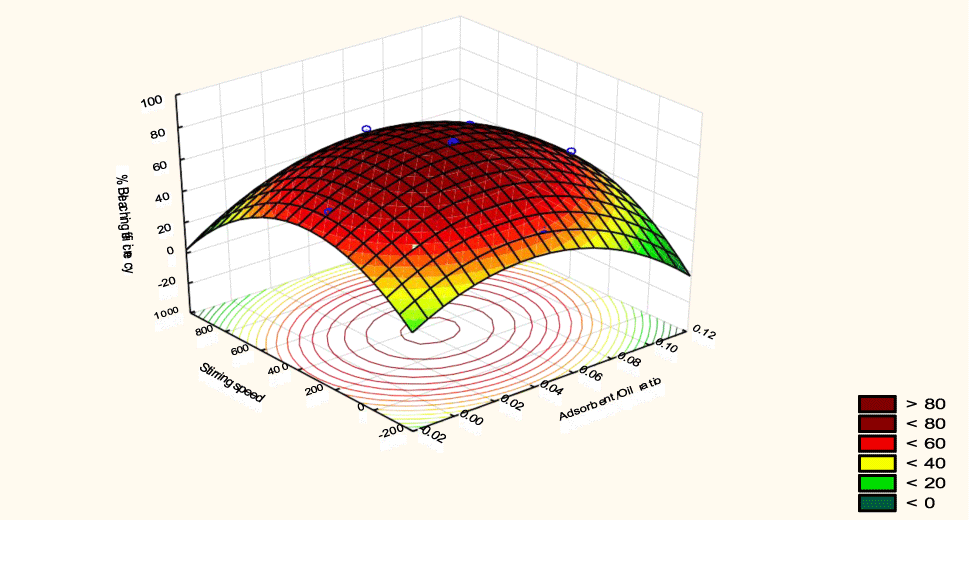
The interactive effects of the process variables on the percent activation efficiency were studied by plotting three-dimensional surface curves against any two independent variables while keeping other variables at their central (0) level. The 3D curves of the response (bleaching efficiency) and contour plots from the interactions between the variables are shown in figures 5-14. The interactive effect of reaction temperature and reaction time on the bleaching efficiency is negative (Table 3), that is, increasing both variables reduces the bleaching efficiency, and this could be attributed to the fact that high temperature and time destroy the crystalline structure of the bentonite, thereby reducing its adsorptive capacity [35]. The response surface plot of the interactive effect of reaction temperature and reaction time is shown in figure 5, the bleaching efficiency increased with a simultaneous increase in reaction temperature and time to 120°C and 2.30 hours and thereafter decreased with further increase in their values. The same trend was observed for the interactive effects of reaction temperature and adsorbent dosage; reaction temperature and adsorbent/oil ratio; reaction temperature and stirring speed and the response surface plots are shown in figures 6-8, respectively. The interactive effects of reaction time and adsorbent dosage on the bleaching efficiency are positive as shown in table 3. The response surface plots of the interactive effect of reaction time and adsorbent dosage are shown in figure 9. The bleaching efficiency increased with a simultaneous increase in reaction time and adsorbent dosage. The bleaching efficiency started to increase from 0.5 hr and 1.0 g and continued to the mid values of both variables. An increase in reaction time resulted in a corresponding increase in bleaching efficiency as was evident in figures 6,9,10. Figure 11 shows that as the adsorbent/oil ratio increased, a higher temperature was required for maximum bleaching efficiency to be achieved, and the same trend was observed in figure 10, at high stirring speed, a temperature less than 80°C was required to give the maximum bleaching efficiency. The effect of stirring speed was observed to be similar to that of temperature effect. High stirring speed gave rise to increased bleaching efficiency as was evident from (Figures 12-14). The optimum conditions are: reaction temperature 156.66°C; reaction time 2.74 hours; adsorbent dosage 5.93 g; adsorbent/oil ratio 0.04 g/ml; stirring speed 411.62 rpm: and the optimum bleaching efficiency at this optimum condition was predicted to be 85.48%. Experiments were carried out at these optimum conditions to validate the predicted optimum values. The experimental value of 86.07% agreed closely with that obtained from the regression model.
Conclusion
The optimum bleaching conditions of bentonite from Ntezi have been studied. Response surface methodology was successfully employed to analyze the bleaching data. The process parameters investigated were all significant both at the linear (except adsorbent dosage) and quadratic level and only the interaction effect of reaction temperature and reaction time; reaction temperature and stirring speed; reaction time and adsorbent dosage; and reaction time and stirring speed; were statistically significant. The high level of correlation between the predicted and observed response proved the regression model to be adequate in explaining the variations in the experimental data. The optimum conditions for the maximum adsorption efficiency of 85.48% were determined to be: 156.66°C temperature; 2.74 hours reaction time; 5.93 g adsorbent dosage; 0.04g/ml adsorbent/oil ratio; and 411.62 rpm stirring speed. This study has revealed that an effective adsorbent can be produced from Ntezi bentonite under optimized process conditions.
References
- Rozic L, Novakovic T, Petrovic S. Process improvement approach to the acid activation of smectite using factorial and orthogonal central composite design methods. J Serb Chem Soc. 2008;73(4):487-97. doi: 10.2298/JSC0804487R.
- Ajemba RO, Nweke CN, Okoye CC, Nwachukwu JO. Adsorption of carotene from crude palm oil by activated Achalla clay. Journal of Engineering Research and Reports. 2023;24(5):1-17. doi: 10.9734/JERR/2023/v24i5813.
- Nweke CN, Ajemba, RO. Clay characterization and bleaching of crude palm oil using acid-activated Nibo clay. Bioremediation Science and Technology Research (BSTR). 2022;10(1):14-21. doi: 10.54987/bstr.v10i1.683.
- Myriam M, Suarez M, Martin-Pozas JM. Structural and textural modifications of palygorskite and sepiolite under acid treatment. Clays and Clay Miner. 1998;46(3):225-231. doi: 10.1346/CCMN.1998.0460301.
- Suarez-Barrios M, Flores-Gonzalez LV, Vicente MA, Martin-Pozas JM. Acid activation of palygorskite with HCl: Development of physico-chemical textural and surface properties. Appl Clay Sci. 1995;10:247-258. doi: 10.1016/0169-1317(95)00007-Q.
- Vicente-Rodriguez MA Lopez-Gonzalez JD, Banares-Munoz MA. Acid activation of a Spanish sepiolite: Physico-chemical characterization, free silica content and surface area of the solids obtained. Clay Miner. 1994a;29:361-67. doi: 10.1180/claymin.1995.030.4.05.
- Vicente-Rodriguez MA, Lopez-Gonzalez JD, Banares-Munoz MA, Casado-Linarejos J. Acid activation of Spanish sepiolite II. Consideration of kinetics and physico-chemical modifications generated. Clay Min. 1995; 30: 315. doi: 10.1180/claymin.1995.030.4.05.
- Suarez M, de Santiago C, Garcia Romero E, Pozas J. Textural and structural modifications of saponite from Cerro Del Aguila by acid treatment. Clay Min. 2001;36:483-488. doi: 10.1180/0009855013640003.
- Prieto O, Vicente MA, Banares-Munoz MA. Study of the porous solids obtained by acid treatment of a high surface area saponite. J Porous Mater. 1999;6:335-44.
- Vicente-Rodriguez MA, Suarez-Barrios M, Lopez-Gonzalez JD, Banares-Munoz MA. Acid activation of a ferrous saponite (griffithite): Physico-chemical characterization and surface area of the products obtained. Clays Clay Miner. 1994b;42:724-730. doi: 10.1346/CCMN.1994.0420608.
- Belver C, Banares-Munoz MA, Vicente MA. Chemical activation of a kaolin under acid and alkaline conditions. Chem Mater. 2002;14(5):234-241. doi: 10.1021/cm0111736.
- Box GEP, Hunter WG, Hunter JS. Statistics for experimenters: An introduction to design, data analysis and model building. New York: Wiley and Sons; 1978. p.672.
- Otto M. Chemometrics: Statistics and Computer Applications in Analytical Chemistry. 3rd ed. New York: Wiley-VCH; 1999. 386 p.
- Abali YC, Yapici S. The optimization of the dissolution of phosphate rock with Cl2-SO2 gas mixture in aqueous medium. Hydrometallurgy. 1997;46:27-35. doi: 10.1016/S0304-386X(96)00095-3.
- Alam MZ, Muyibi SA, Toramae J. Statistical optimization of adsorption processes for removal of 2,4-dichlorophenol by activated carbon derived from oil palm empty fruit bunches. J Environ Sci (China). 2007;19(6):674-7. doi: 10.1016/s1001-0742(07)60113-2. PMID: 17969639.
- Ata ON, Colak S, Ekinci Z, Copur M. Determination of the optimum conditions for the dissolution of stibnite in HCl solution. Chem Biochem Eng Q. 2001;24(4):409-13. doi: 10.1021/ie960258r.
- Copur M, Ozmetin C, Ozmetin E, Kocakerim M. Optimization study of the dissolution of roasted zinc sulphide concentration with sulphuric acid solution. Chem Eng Process. 2004;43(8):1007-14. doi: 10.1016/j.cep.2003.10.001.
- DePaiva JE, Maldonade IR, Scamparini AR. Xylose production from sugarcane bagasse by surface response methodology. R Bras Eng Agric Ambiental. 2009;13(1):75-80. doi: 10.1590/S1415-43662009000100011.
- Dilipkumar M, Rajasimman M, Rajamohan N. Response surface methodology for the optimization of inulinase production by k marxianus var marxianus. J Appl Sci Environ San. 2011;6(1):85-95.
- Fu JF, Zhao YQ, Xue XD, Li WC, Babatunde AO. Multivariate-parameter optimization of acid blue-7 waste water treatment by Ti/TiO2 photo-electro-catalysis via the Box-Behnken design. Desalination. 2009;243(1-3):42-51. doi: 10.1016/j.desal.2008.03.038.
- Gunawan ER, Suhendra D. Four-factor response surface optimization of the enzymatic synthesis of wax ester from palm kernel oil. Indonesian. J Chem. 2008;8(1):83-90. doi: 10.22146/ijc.21653.
- Li D, Park K, Wu Z, Guo X. Response surface design for nickel recovery from laterite by sulfation-roasting-leaching process. Trans. Nonferrous Met Soc China. 2010;20(5):s92-6. doi: 10.1016/S1003-6326(10)60019-2.
- Narayana SK, King P, Gopinadh R, Sreelakshmi V. Response surface optimization of dye removal by using waste prawn shells. Int J Chem Sci & Appl. 2011;2(3):186-193.
- Sudamalla P, Saravanan P, Matheswaran M. Optimization of operating parameters using response surface methodology for adsorption of crystal violet by activated carbon prepared from mango kernel. Sustain Environ Res. 2012;22(1):1-7.
- Umesh G, Sud D. Optimization of process parameters for removal of Cr (VI) from aqueous solutions using modified sugarcane bagasse. E-J Environ Agric Food Chem. 2005;4(6):1150-1160.
- Yartasi A, Copur M, Ozmetin C, Kocakerim M, Temur H. An optimization study of dissolution of oxidized copper ore in NH3 solutions. Energy Educ Sci Tech. 1999;3:77.
- Yi L, Yian Z, Wang A. Response surface methodology for optimizing adsorption process parameters for methylene blue removal by a hydrogel composite. Ads Sci Technol. 2010;28(10):913-923. doi: 10.1260/0263-6174.28.10.913.
- Nweke CN, Nwokedi IC, Chinyelu CE, Chukwudi C. Bleaching of crude palm oil by activated Nise clay: Process kinetics, isotherm and thermodynamic studies. Novateur Publications International Journal Of Innovations In Engineering Research And Technology [IJIERT]. 2024;11(2):55-71. doi: 10.26662/ijiert.v11i2.pp55-71.
- Nweke CN, Onu CN, Iheanacho CO. Kinetic and thermodynamic Studies of crude palm oil bleaching using Amansea clay. Asian Journal of Applied Chemistry Research. 2023;13(1):23-42. doi: 10.9734/AJACR/2023/v13i1234.
- Dias MI, Suarez MB, Prates S, Martin-Pozas JM. Characterization and acid activation of Portuguese special clays. Clay Minerals. 2003;38:537-549.
- Pesquera C, Gonzalez F, Benito I, Blanco C, Mendioroz S, Pajares J. Passivation of a montmorillonite by the silica created in acid activation. J Mater Chem. 1992;2:907-911. Doi: 10.1039/JM9920200907.
- Srasra E, Bergaya F, Vandammne H, Arigub NK. Surface properties of an activated bentonite: Decolourization of rape-seed oils. Appl Clay Sci. 1989;4:411-421. doi: 10.1016/0169-1317(89)90019-7.
- Pushpaletha P, Rugmini S, Lalithambika M. Correlation between surface properties and catalytic activity of clay catalysts. Appl Clay Sci. 2005;30:141-153. doi: 10.1016/j.clay.2005.03.011.
- Tsai WT, Hsu HC, Su TY, Lin KY, Lin CM, Dai TH. The adsorption of cationic dye from aqueous solution onto acid-activated andesite. J Hazard Mater. 2007 Aug 25;147(3):1056-62. doi: 10.1016/j.jhazmat.2007.01.141. Epub 2007 Feb 6. PMID: 17363150.
- Bonilla JL, Lopez-Gonzalez JD, Ramirez-Saenz A, Rodriguez-Reinoso F, Valenzuela-Calahorro C. Activation of a sepiolite with dilute solutions of HNO3 and subsequent heat treatments II: Determination of surface acid centers. Clay Miner. 1981;16:173-179.
Content Alerts
SignUp to our
Content alerts.
 This work is licensed under a Creative Commons Attribution 4.0 International License.


