Biology Group . 2023 March 10;4(2):363-371. doi: 10.37871/jbres1684.
Spatial Analysis of Phospholipids in Insect Models by Positive Ionization Mode Matrix-Assisted Laser Desorption Ionization Mass Spectrometric Imaging
Suzeeta Bhandari, Harsheen Marwah, Laurent Calcul and David J Merkler*
- Phospholipids
- MALDI-MSI
- Drosophila melanogaster
- Tribolium castaneum
- On-tissue MS/MS
Abstract
Matrix-Assisted Laser Desorption/Ionization Mass Spectrometric Imaging (MALDI-MSI) has developed as a useful tool in generating comprehensive metabolite profiles along with spatial information in model organisms. The ability of MALDI-MSI to generate in situ profiles in whole organisms or specific tissue sections serves as an efficient alternative to solvent extraction protocols, especially for the identification of biomolecules that are unstable under extraction conditions. Herein, we have utilized MALDI-MSI to spatially profile various classes of lipids in two model organisms, Drosophila melanogaster (fruit fly), and Tribolium castaneum (red flour beetle). Five different classes of phospholipids were imaged in positive ionization mode in both insect species. Confirmation of the m/z assignment for selected lipids was performed using on-tissue MS/MS fragmentation.
Introduction
Lipids are essential biomolecules distributed from single-celled prokaryotes to highly evolved multicellular eukaryotes. Lipids constitute the backbone of the cell membrane, contribute to the maintenance of the structural integrity of the cell, and participate in cellular functions such as energy storage, signal transduction, apoptosis, and pheromone-induced social behavior of insects [1,2]. Lipid dysregulation has been associated with metabolic and neurological disorders like obesity, Niemann-Pick disease, hyperlipidemia, and epilepsy [2,3]. Thus, analytical procedures have been developed to detect, identify, characterize, and quantify these molecules from a number of model organisms [4,5].
Mass Spectrometry Imaging (MSI) has developed into an important tool for the simultaneous detection and mapping of targeted and untargeted compounds from biological models. MSI has applications in metabolomics, biomarker discovery, in vivo drug distribution studies, and many others [6-8]. Among the different techniques used for MSI are Matrix-Assisted Laser Desorption Ionization (MALDI), Secondary Ion Mass Spectrometry (SIMS) [9], and Desorption Electrospray Ionization (DESI) [10]. Drosophila melanogaster and Tribolium castaneum are two insects that have a long history as useful models for disease, behavior, ecology, and metabolomics studies [11,12]. These insects are inexpensive and straightforward to maintain and their signaling and energy pathways resemble those of mammals, enabling extrapolation to vertebrates [13]. While D. melanogaster has been previously used as a model organism for many of the MSI-based experiments revealing in-depth spatial profiles of metabolites of interest, this technique has not been explored for research in T. castaneum yet. Our study aims to utilize both D. melanogaster and T. castaneum, two pest models with ubiquitous and irksome distribution worldwide for lipid mapping using MSI.
In the present work, we have used positive mode MALDI Time-of-Flight (MALDI-TOF) imaging to map the lipid topography on whole-body sections of D. melanogaster and T. castaneum within the detection range of m/z = 450-1200, and 30 µm spatial resolution. The small and fragile bodies of the insects, however, present a challenge for imaging, in that the whole-body sections cannot be obtained without the support of an embedding media. In this study, we have utilized a Carboxy Methyl Cellulose (CMC) embedding protocol to maintain the integrity of their whole-body cryosections [14-16].
The matrix used in our studies was 2,5-Dihydorxybenzoic Acid (DHB), and barring a few modifications during the embedding steps, the same protocol was followed for sample preparation, data acquisition, and data processing for both the insect samples. To sum it up, our results illustrate the spatial profile of phospholipids in D. melanogaster that are concurrent with previously published studies [15,17,18], and additionally, we present the first reported spatial profile of phospholipids in T. castaneum, thus giving a comparative lipid distribution pattern in two pest models.
Materials and Methods
Insect husbandry and sample preprocessing
D. melanogaster was cultured on 4-24 Instant Medium at room temperature. A few fly larvae were isolated and maintained in individual culture tubes to obtain virgin flies. Flies were processed for embedding 3-4 days after pupal hatching. Select flies were anesthetized, and their wings and legs were removed with surgical knives and forceps. The fly sample did not require prior infiltration or dehydration steps and was directly proceeded to embedding.
T. castaneum was cultured in plain flour and maintained at 25-35°C in the dark. Adult beetles were used for the study indiscriminate of their sexes. The selected beetles were anesthetized, soaked in ethanol for 10 mins each, and allowed to air dry. T. castaneum has a hard exoskeleton and soft heterogeneous internal tissues. The brief dehydration step was included to harden the internal tissue to keep subsequently cut sections intact [15].
Embedding and cryosectioning
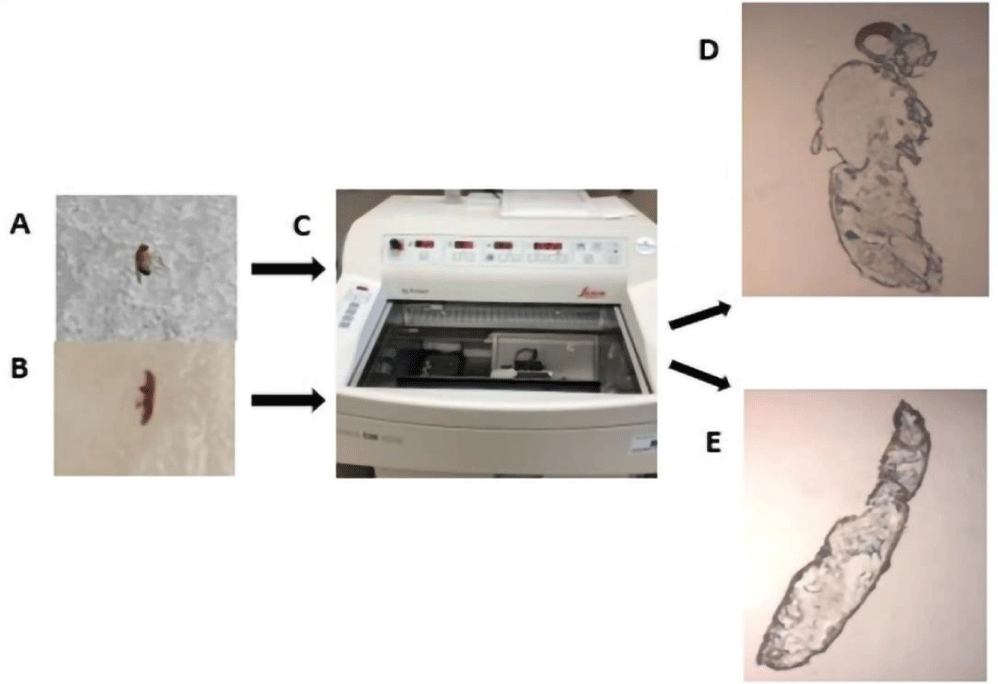
We experimented with gelatin, Optimal Cutting Temperature (OCT) media, and CMC for the embedding of insect samples. Ultimately, 5% (w/v) CMC sodium salt provided reproducible and good quality sections for both the samples and, also, did not produce interfering signals during MSI. For the preparation of the embedding media, CMC was slowly added to water and vortexed. CMC was completely dissolved in water using the following protocol: A microwave heat (20 sec)/room temperature cool (5-10 sec) cycle for a total of 90 sec. followed by incubation in a 50°C water bath until a homogenous and clear solution was achieved. The media was then degassed in an ultrasonic bath. For embedding, a thin layer of media was applied to the mold, and a single insect sample was placed firmly in it. The sample was then completely covered with additional media and placed at -80°C for at least 24 hours (Figures 1A,B).
Prior to sectioning, the embedded samples were equilibrated to the chamber temperature (-20°C) of a Leica CM 1950 cryostat (Leica Biosystems, Illinois, USA) (Figure 1C). Whole body sections (20 µm) were cut for each of the insect samples and thaw mounted on Indium Tin Oxide (ITO)-coated glass slides (Bruker Daltonics, Bremen, Germany) for MALDI imaging (Figures 1D,E). For the purpose of this study, multiple sections from at least three biological replicates were obtained and used for MSI method optimization and final lipid profile generation.
Matrix application
2,5-Dihydroxybenzoic Acid (DHB) was the matrix of choice for imaging lipids in positive ionization mode. For this purpose, 50 mg/mL DHB solution was prepared in 50% acetone (v/v) and 0.1% (v/v) TFA. The matrix solution was sprayed homogeneously across the tissue section with a 0.2 mm nozzle caliber airbrush connected to 30 psi N2 back pressure. A total of 8-10 alternate spraying (~3 sec) and drying (~45 sec) cycles were performed for matrix application for each sample. Matrix-coated samples were dried for ~1 hr at room temperature before analysis.
Instrumentation
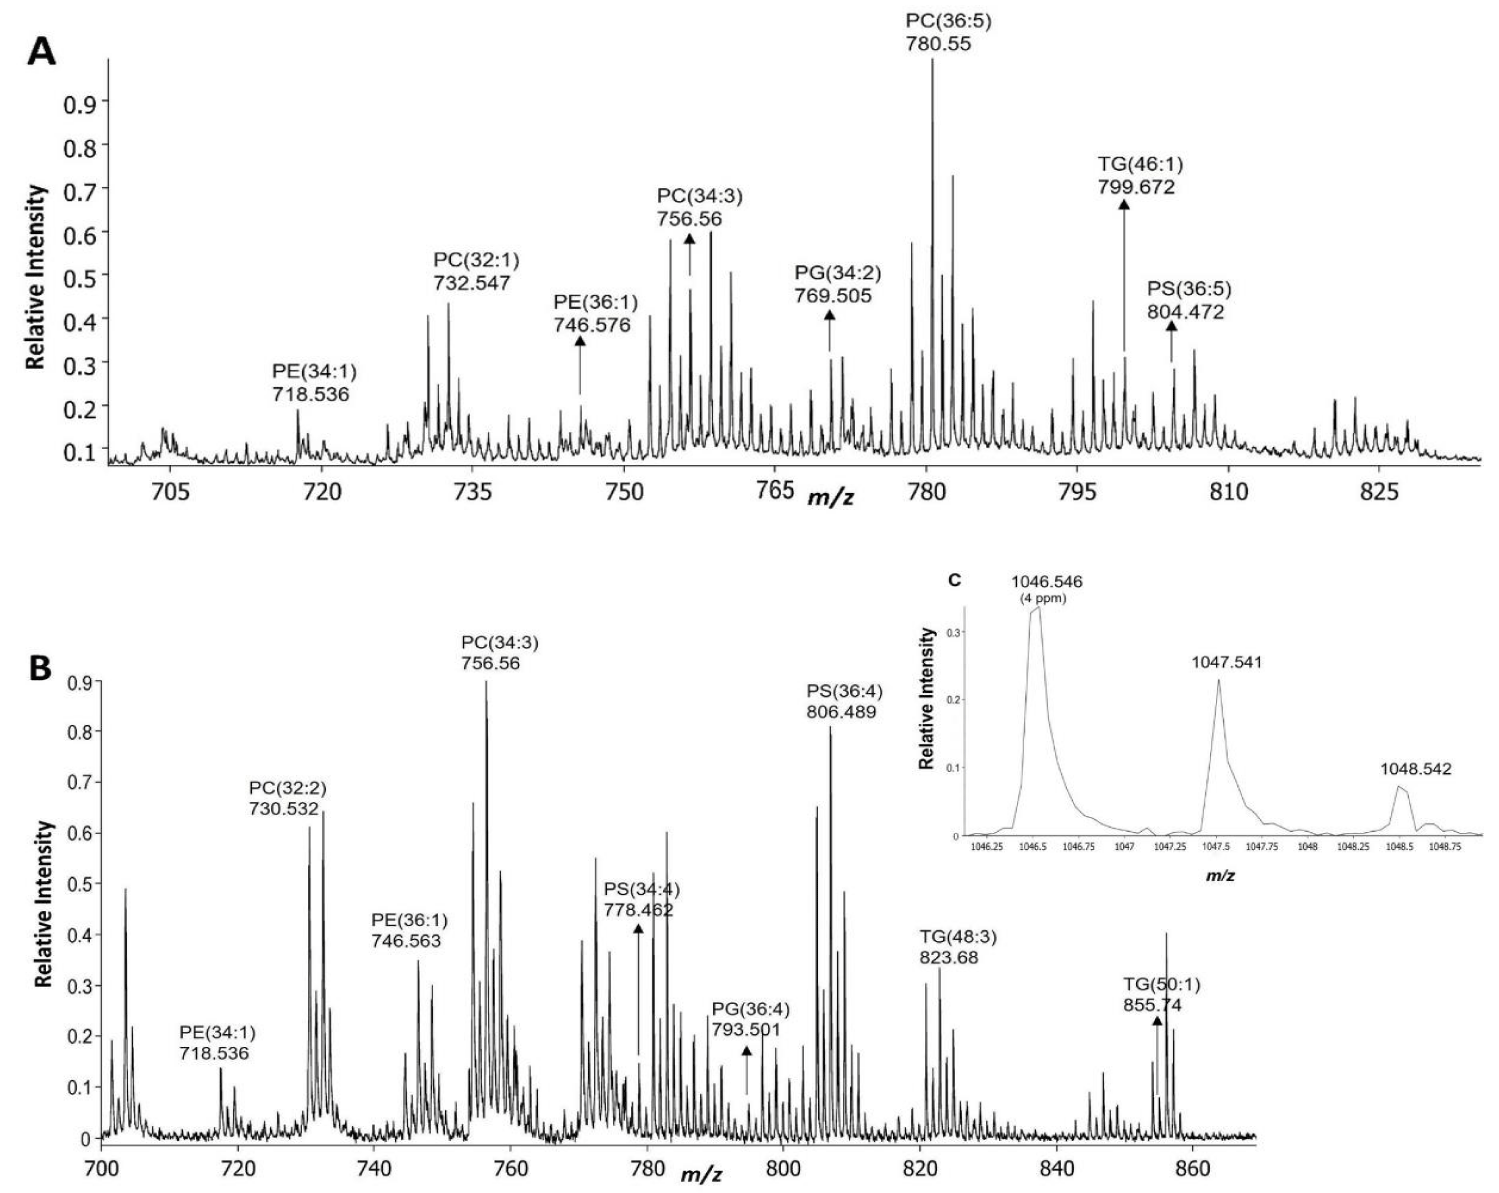
All imaging experiments were performed on a MALDI TOF-TOF mass spectrometer (Ultraflextreme, Bruker Daltonics, Bremen, Germany) equipped with a Smartbeam II (modified Nd: YAG) laser. All analyses were done in positive ion reflectron mode at a 1000 Hz laser repetition rate. The detection range was set to 450-1200 m/z with matrix suppression up to 400 m/z. The accelerating voltage for ion source 1 was set to 20.05 kV, the extraction voltage for ion source 2 was set to 17.64 kV, the lens voltage was set to 7.5 kV, and the pulsed ion extraction was set to 160 ns. Imaging data were acquired at a 1.25 GS/s sample rate using a step size of 30 μm × 30 µm. At each raster position, 300 shots were acquired without random walk and summed up for generating the overall average spectrum (Figures 2A,B). Instrument calibration was performed in cubic enhanced fit at < 1.5 ppm standard deviation using odd red phosphorous clusters in the mass range of interest [1]. Angiotensin II (Bruker Daltonics, Bremen, Germany), sprayed along with matrix was used as a standard to determine mass accuracy (Figure 2C).
Image processing and data analysis
Imaging data were preprocessed concomitantly during acquisition by a method script created on Flexanalysis version 3.4 software. As such, spectra from each pixel were processed for noise exclusion with signal-to-noise ratio ≥ 3, with the TopHat filter for baseline correction and the Savitsky-Golay filter set at 0.01 m/z, width/1 cycle for smoothing. The overall average spectrum and the images were reconstructed and analyzed using SCiLS Lab (version 2021b, SCiLS GmbH, Bruker Daltonics). The spectra were normalized with respect to Total Ion Count (TIC). Relevant peaks were selected, and the software-recommended average width of Δm/z = 0.02 was set for image generation. Lipid assignment was based on a comparison of detected m/z values against theoretical m/z in the LIPID MAPS database.
On tissue tandem mass spectroscopy
Lipid assignment was corroborated by MS/MS studies performed in LIFT-TOF/TOF mode directly at the non-normalized spatial location of the lipid on the tissue section. Fragments were generated for mono-isotope of interest under the following LIFT mode conditions: precursor ion selector mass limit = 2-4 Da, CID mode = OFF, PIE delay of 90 ns, ion source voltage (1/2) of 7.5 kV/6.75 kV, lens voltage of 3.5 kV, and LIFT voltage (1/2) of 19 kV/3.25 kV in positive ionization mode.
Results and Discussion
Sample preparation and instrumental parameters
The heterogeneous tissue composition, in combination with the delicate and minute insect body, poses a challenge towards obtaining reproducible and intact cryosections [17]. Furthermore, any procedure followed for sample preparation must ensure the preservation of section integrity, that of its endogenous compounds, and be compatible with MS studies [19,20]. Embedding media, namely CMC, gelatin, or OCT, is extensively used for MSI preparation when obtaining whole-body sections [14,20,21]. While reproducible sections are generated when using OCT, its content of relatively high concentrations of Polyethylene Glycol (PEG) polymers causes analyte ion suppression during data acquisition [22]. CMC and gelatin, on the other hand, are compatible with MS acquisition, and hence, are more reliable for MSI sample preparation [15,17]. We selected 5% (w/v) CMC for embedding the insect samples based on a series of trial experiments (not shown). For T. castaneum, a brief alcohol infiltration before embedding was necessary to obtain intact sections. Unfortunately, some of the cuticular lipids in T. castaneum could diffuse because of the alcohol infiltration step [15].
The spatial resolution of an image generated from MSI is dependent on the matrix crystal size and laser spot size [23]. For these studies, we used a portable airbrush for matrix application. The advantages of the portable airbrush relative to commercial matrix application systems (HTX TM-sprayer, Bruker ImagePrep) were low cost and simplicity of maintenance. However, the process is analyst dependent and may not be as reliable when reproducible high-resolution images are desired. The spatial resolution that we could achieve with the sample preparation process and instrumental parameters detailed here was 30 µm.
MALDI TOF is based on the utilization of matrix to absorb laser energy for the generation of analyte ions. DHB is ideal for positive ionization mode in the low molecular weight region because it typically does not promote the formation of matrix ion clusters and ionizes different classes of lipids as the proton or alkali metal adducts, typically Na+ in this study [24]. The sensitivity of detection of each lipid class could be different and is dependent upon both the solvent system used and the presence of contaminating salts. DHB in acetone provides better sensitivity for detection [25].
Based on mass accuracy measurement in the average mass spectra, a total of 46 polar as well as neutral lipids belonging to 5 different classes were identified in D. melanogaster (Table S1). Similarly, 54 lipids were identified in T. castaneum (Table S2). Only the lipids consistently identified in two biological replicates of each insect species were selected. Mass accuracy within 10 ppm of the theoretical mass was taken into consideration for lipid assignment. The assignment was confirmed by MS/MS measurement of some of the identified peaks on the tissue sample, to consider near isobaric peaks.
Detected lipid classes
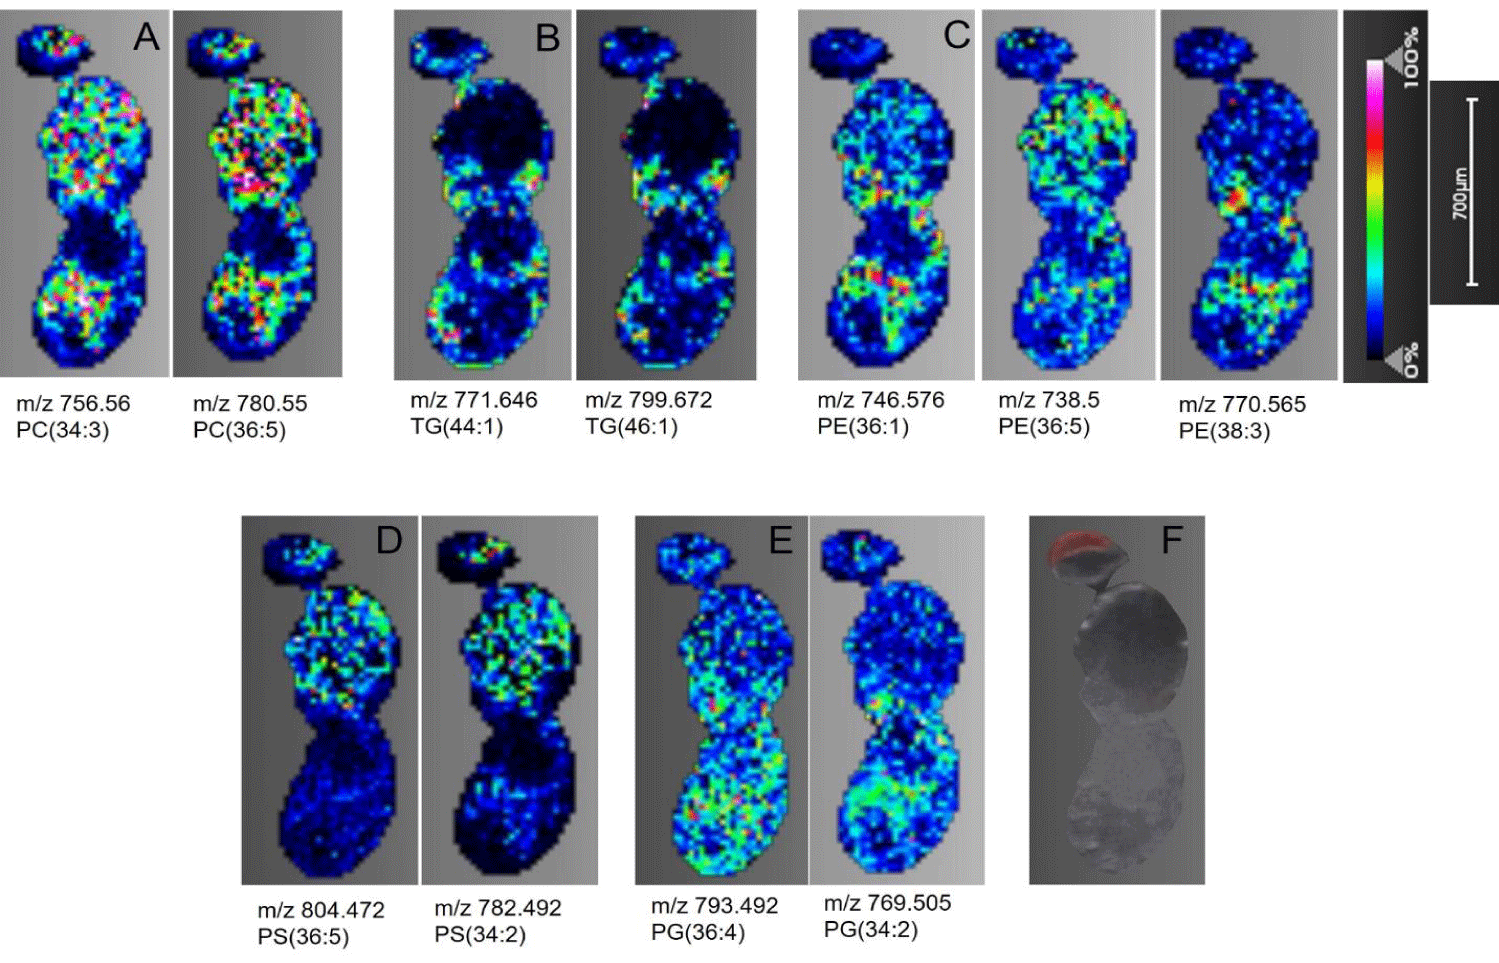
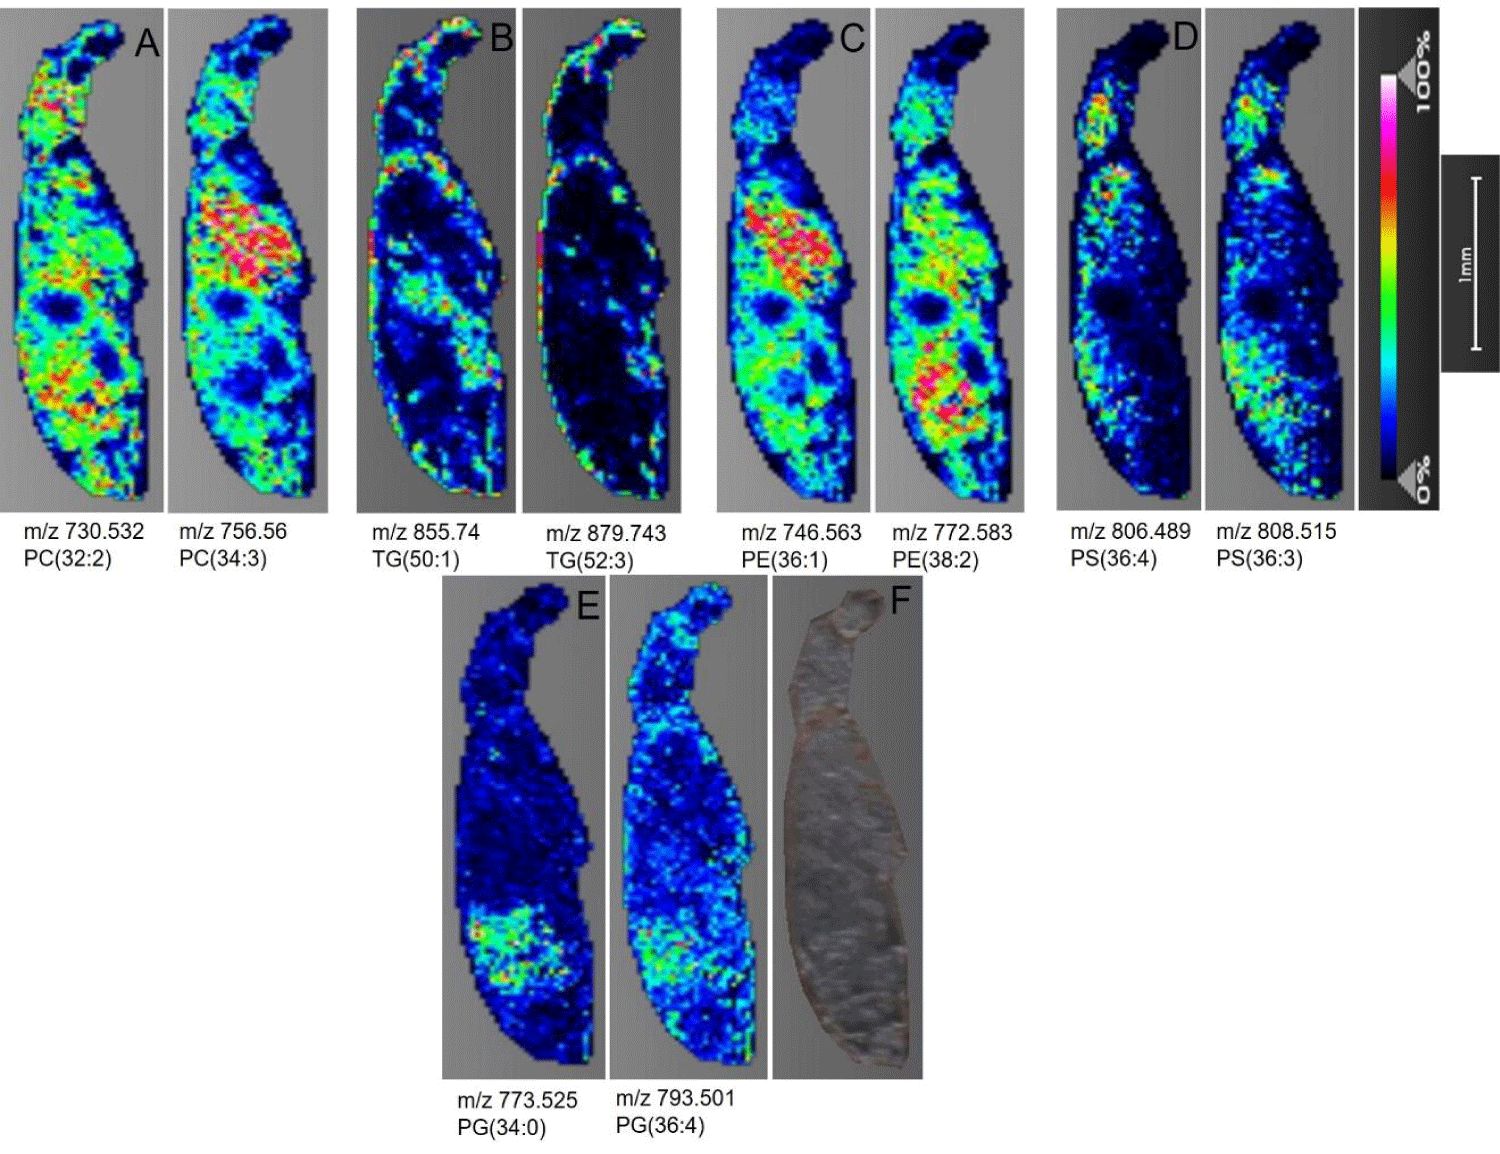
Phosphatidylcholine (PC): As a major class of glycerophospholipid, PCs are ubiquitous across major eukaryotic and some prokaryotic cells as a structural and cell signaling lipid [26]. PCs are composed of the phosphocholine head group, and two fatty acid chains covalently linked to the glycerol backbone in the sn-1 and sn-2 positions [27]. Being one of the most abundant lipid classes with easily ionizable structure, PCs were detected with high intensity across the head, thorax, and abdomen region of both D. melanogaster (Figure 3A) and T. castaneum (Figure 4A) samples as [M+H+] ions. Signals corresponding to 14 PCs with fatty acyl chain lengths ranging from 28-38 were imaged in Drosophila sections (Table S1). Similarly, 12 PCs with chain lengths between 30-38 with varying degrees of unsaturation were observed in the Tribolium sections (Table S2). Additionally, the characteristic fragment of phosphorylcholine head group loss is represented by 184.073 m/z, and the [M-59+H+] peak is generated from the neutral loss of trimethylamine (C3H9N) [28,29]. Both were detected for selected PC precursor ions subjected to tandem MS at their spatial location on the section (Figure S1B).
Phosphatidylethanolamine (PE): Phospatidylethanolamines are the second most abundant lipids in insect tissues with structural functions aiding in membrane fusion and fluidity [30,31]. Additionally, PE serves as a precursor for biologically active molecules including, secondary messengers, pain modulators, and proapoptotic substances, and plays a critical role in ensuring the progression of cytokines during cell division [26]. Its characteristic phosphoethanolamine head group (neutral loss of 141 Da) in the positive ion mode (Figure S1A) serves as a key identification fragment during mass spectrometric analysis [29].
In Drosophila, PE is mostly distributed in the thorax and the abdominal region as indicated by representative normalized distributions of m/z 738.5 and 746.576 (Figure 3C). Similarly, [M+H]+ ions for PE showed relatively even intensity distribution across the thorax and abdomen in T. castaneum (Figure 4C). In both the insect samples, low to negligible PE distribution was seen in the head.
Phosphatidylserine (PS): Although negatively charged at physiological pH and well ionized in the negative MS mode, sodium adducts of phosphatidylserine in the positive ionization mode are well documented in previous MS studies [32,33]. Consistent with these reports, sodium adducts of PS were found distributed across insect sections at varying intensities of distribution. Figure 3D shows the normalized [M+Na]+ ion distribution of PS(34:2) and PS(36:5) across the D. melanogaster sections. As depicted in the images, PS was distributed across brain tissues and the thorax region. In contrast, no PS signals were detected on the head in the T. castaneum sections, however, PS was moderately scattered across the thorax and dorsal abdominal region in the T. castaneum sections, shown by the distribution of PS(36:3) and PS(36:4) of figure 4D. The MS/MS spectrum for PS shows the [M-185+Na]+ peak and the [M-207]+peak representing neutral loss of phosphoserine head group including and not including sodium respectively (Figure S2A).
Triacylglyceride (TAG): Triglycerides are important caloric reserves in insects. These can be used for energy generation through β-oxidation during diapause, disease, embryogenesis, and prolonged flight periods [34,35]. In addition, triglycerides form a major component of cuticular and visceral lipids stored in the form of fat droplets [17]. It has been reported that MALDI-TOF MS mass spectra for TAGs in the positive ion mode are almost exclusively dominated by Na+ adducts [25]. 10 TAG species ranging in carbon chain length of 40-48 were detected in D. melanogaster (Table S1) while 14 species with chain lengths of 36-52 carbon atoms were detected in T. castaneum (Table S2). Pseudocolor images of select TAGs in the thorax and abdomen of D. melanogaster are shown in (Figure 3B). In the T. castaneum sections, TAG distribution was uniform across the cuticular region, and some prominent localization is seen in the head and abdominal viscera (Figure 4B).
Phosphatidylglycerol (PG): Two phosphatidylglycerols, PG(34:2) and PG(36:4). were detected in D. melanogaster (Figure 3E). Their distribution is predominant in the thorax and abdomen regions. On the other hand, three phosphatidylglycerols, PG(34:0), PG(34:4), and PG(36:4), were identified in T. castaneum with distribution localized in the lower abdomen region (Figure 4E). Sodium adducts of PG are observed in the positive ionization mode.
Conclusion
Herein, we have employed an MSI-dependent technique to generate spatial profiles of 5 different lipid classes in Drosophila melanogaster and Tribolium castaneum. Using a dedicated sample preparation protocol and data acquisition method, we obtained spatial profiles first for D. melanogaster and applied the same to T. castaneum. Additionally, our identification and spatial mapping results from T. castaneum are the first of this type in this insect model. We see distinct intensity and distribution patterns of various lipids in T. castaneum with intense signal distribution for PC and PE throughout the body, whereas localized distribution for TG, PS, and PG. This study demonstrates the use of the MSI technique to generate spatial profiles of endogenous compounds in small pest models, and it could be optimized further to image and understand metabolite distribution including, but not limited to lipids, peptides, and proteins in various small pests potentially in response to insecticide.
Supplementary Information
Table of detected and assigned lipids in D. melanogaster and T. castaneum and representative MS/MS spectra of lipid species (DOC).
Acknowledgment
This work has been supported by grants from the University of South Florida (a Proposal Enhancement grant and a Creative Scholarship grant), the Shirley W. and William L. Griffin Charitable Foundation, and the National Institute of General Medical Sciences at the National Institutes of Health (R21-GM140390) to D.J.M.
In addition, this work has also received support from the Mass Spectrometry and Peptide Facility, Department of Chemistry, University of South Florida; the Chemical Purification Analysis and Screening Core Facility (CPAS) at the University of South Florida; and the Tissue Core at the H. Lee Moffitt Cancer Center and Research Institute (Tampa, FL).
Conflict of Interest
The authors declare that there are no conflicts of interest.
References
- Angel PM, Spraggins JM, Baldwin HS, Caprioli R. Enhanced sensitivity for high spatial resolution lipid analysis by negative ion mode matrix assisted laser desorption ionization imaging mass spectrometry. Anal Chem. 2012 Feb 7;84(3):1557-64. doi: 10.1021/ac202383m. Epub 2012 Jan 25. PMID: 22243218; PMCID: PMC3277660.
- Liu Z, Huang X. Lipid metabolism in drosophila: development and disease. Acta Biochim Biophys Sin (Shanghai). 2013 Jan;45(1):44-50. doi: 10.1093/abbs/gms105. PMID: 23257293.
- Kraut R. Roles of Sphingolipids in Drosophila Development and Disease. J Neurochem. 2011 Mar;116(5):764-78. doi:10.1111/j.1471-4159.2010.07022.x. PMID: 33042014.
- Jeffries KA, Dempsey DR, Behari AL, Anderson RL, Merkler DJ. Drosophila melanogaster as A Model System to Study Long-Chain Fatty Acid Amide Metabolism. FEBS Lett. 2014 May 2;588(9):1596-1602. doi:10.1016/j.febslet.2014.02.051. PMID: 24650760.
- Zahradníčková H, Tomčala A, Berková P, Schneedorferová I, Okrouhlík J, Simek P, Hodková M. Cost effective, robust, and reliable coupled separation techniques for the identification and quantification of phospholipids in complex biological matrices: application to insects. J Sep Sci. 2014 Aug;37(15):2062-8. doi: 10.1002/jssc.201400113. Epub 2014 Jul 1. PMID: 24799084.
- Seeley EH, Caprioli RM. Imaging mass spectrometry: towards clinical diagnostics. Proteomics Clin Appl. 2008 Oct;2(10-11):1435-43. doi:10.1002/prca.200800013. PMID: 21136792.
- Gode D, Volmer DA. Lipid Imaging by Mass Spectrometry – A Review. Analyst. 2013;138(5):1289. doi:10.1039/c2an36337b. PMID: 23314100.
- Scott AJ, Jones JW, Orschell CM, MacVittie TJ, Kane MA, Ernst RK. Mass Spectrometry Imaging Enriches Biomarker Discovery Approaches with Candidate Mapping. Health Phys. 2014 Jan;106(1):120-28. doi:10.1097/HP.0b013e3182a4ec2f. PMID: 24276555.
- Moore KL, Lombi E, Zhao FJ, Grovenor CRM. Elemental Imaging at the Nanoscale: Nanosims and Complementary Techniques for Element Localisation in Plants. Anal Bioanal Chem. 2012 Apr 4;402(10):3263-73. doi:10.1007/s00216-011-5484-3. PMID: 22052155.
- Ifa DR, Wiseman JM, Song Q, Cooks RG. Development of capabilities for imaging mass spectrometry under ambient conditions with desorption electrospray ionization (desi). Int J Mass Spectrom. 2007 Jan;259(1-3):8-15. doi: 10.1016/j.ijms.2006.08.003.
- Campbell JF, Athanassiou CG, Hagstrum DW, Zhu KY. Tribolium castaneum : A Model Insect for Fundamental and Applied Research. Annu Rev Entomol. 2022 Jan 7;67(1):347-65. doi:10.1146/annurev-ento-080921-075157. PMID: 34614365.
- Niu Y, Hardy G, Agarwal M, Hua L, Ren Y. Characterization of volatiles Tribolium castaneum (h.) In flour using solid phase microextraction-gas chromatography mass spectrometry (spme-gcms). Food Sci Hum Wellness. 2016 Mar;5(1):24-29. doi: 10.1016/j.fshw.2015.11.002.
- Trinh I, Boulianne GL. Modeling Obesity and Its Associated Disorders in Drosophila. Physiology. 2013 Mar;28(2):117-24. doi:10.1152/physiol.00025.2012. PMID: 23455770.
- Nelson KA, Daniels GJ, Fournie JW, Hemmer MJ. Optimization of Whole-Body Zebrafish Sectioning Methods for Mass Spectrometry Imaging. J Biomol Tech. 2013 Sep;24(3):119-27. doi:10.7171/jbt.13-2403-002. PMID: 23997659.
- Khalil SM, Pretzel J, Becker K, Spengler B. High-resolution ap-smaldi mass spectrometry imaging of Drosophila melanogaster. Int J Mass Spectrom. 2017 May;416:1-19. doi: 10.1016/j.ijms.2017.04.001.
- Khalil SM, Römpp A, Pretzel J, Becker K, Spengler B. Phospholipid Topography of Whole-Body Sections of the Anopheles stephensi Mosquito, Characterized by High-Resolution Atmospheric-Pressure Scanning Microprobe Matrix-Assisted Laser Desorption/Ionization Mass Spectrometry Imaging. Anal Chem. 2015 Nov 17;87(22):11309-16. doi:10.1021/acs.analchem.5b02781. PMID: 26491885.
- Niehoff AC, Kettling H, Pirkl A, Chiang YN, Dreisewerd K, Yew JY. Analysis of Drosophila Lipids by Matrix-Assisted Laser Desorption/Ionization Mass Spectrometric Imaging. Anal Chem. 2014 Nov 18;86(22):11086-92. doi:10.1021/ac503171f. PMID: 25329240.
- Tuthill BF, Searcy LA, Yost RA, Musselman LP. Tissue-specific analysis of lipid species in Drosophila during overnutrition by UHPLC-MS/MS and MALDI-MSI. J Lipid Res. 2020 Mar;61(3):275-90. doi:10.1194/jlr.RA119000198. PMID: 31900315.
- Goodwin RJA. Sample preparation for mass spectrometry imaging: Small Mistakes Can Lead to Big Consequences. J Proteomics. 2012 Aug;75(16):4893-911. doi:10.1016/j.jprot.2012.04.012. PMID: 22554910.
- Swales JG, Hamm G, Clench MR, Goodwin RJA. Mass spectrometry imaging and its application in pharmaceutical research and development: A concise review. Int J Mass Spectrom. 2019 Mar;437:99-112. doi: 10.1016/j.ijms.2018.02.007.
- Stutts WL, Knuth MM, Ekelöf M, Mahapatra D, Kullman SW, Muddiman DC. Methods for Cryosectioning and Mass Spectrometry Imaging of Whole-Body Zebrafish. J Am Soc Mass Spectrom. 2020 Apr 1;31(4):768-72. doi:10.1021/jasms.9b00097. PMID: 32129621.
- Truong JXM, Spotbeen X, White J, et al. Removal of Optimal Cutting Temperature (O.C.T.) Compound from Embedded Tissue for MALDI Imaging of Lipids. Anal Bioanal Chem. 2021 Apr 9;413(10):2695-708. doi:10.1007/s00216-020-03128-z. PMID: 33564925.
- Hansen RL, Lee YJ. High-Spatial Resolution Mass Spectrometry Imaging: Toward Single Cell Metabolomics in Plant Tissues. The Chem Rec. 2018 Jan;18(1):65-77. doi:10.1002/tcr.201700027. PMID: 28685965.
- Leopold J, Popkova Y, Engel K, Schiller J. Recent Developments of Useful MALDI Matrices for the Mass Spectrometric Characterization of Lipids. Biomolecules. 2018 Dec 13;8(4):173. doi:10.3390/biom8040173. PMID: 30551655.
- Asbury GR, Al-Saad K, Siems WF, Hannan RM, Hill HH. Analysis of triacylglycerols and whole oils by matrix-assisted laser desorption/ionization time of flight mass spectrometry. J Am Soc Mass Spectrom. 1999 Oct 1;10(10):983-91. doi: 10.1016/S1044-0305(99)00063-X.
- Gibellini F, Smith TK. The Kennedy Pathway-De Novo Synthesis of Phosphatidylethanolamine and Phosphatidylcholine. IUBMB Life. 2010 Jun;62(6):414-28. doi: 10.1002/iub.337. PMID: 20503434.
- Kanno K, Wu MK, Scapa EF, Roderick SL, Cohen DE. Structure and Function of Phosphatidylcholine Transfer Protein (PC-TP)/StarD2. Biochimica et Biophysica Acta (BBA) - Molecular and Cell Biology of Lipids. 2007 Jun;1771(6):654-62. doi:10.1016/j.bbalip.2007.04.003. PMID: 17499021.
- Dean AW, Glasgow BJ. Mass Spectrometric Identification of Phospholipids in Human Tears and Tear Lipocalin. Invest Ophthalmol Vis Sci. 2012 Apr 2;53(4):1773. doi:10.1167/iovs.11-9419. PMID: 22395887.
- Godzien J, Ciborowski M, Martínez-Alcázar MP, Samczuk P, Kretowski A, Barbas C. Rapid and Reliable Identification of Phospholipids for Untargeted Metabolomics with LC–ESI–QTOF–MS/MS. J Proteome Res. 2015 Aug 7;14(8):3204-16. doi:10.1021/acs.jproteome.5b00169. PMID: 26080858.
- Dawaliby R, Trubbia C, Delporte C, et al. Phosphatidylethanolamine Is a Key Regulator of Membrane Fluidity in Eukaryotic Cells. J Biol Chem. 2016 Feb;291(7):3658-67. doi:10.1074/jbc.M115.706523. PMID: 26663081.
- Furt F, Moreau P. Importance of Lipid Metabolism for Intracellular and Mitochondrial Membrane Fusion/fission Processes. Int J Biochem Cell Biol. 2009 Oct;41(10):1828-36. doi:10.1016/j.biocel.2009.02.005. PMID: 19703652.
- Hsu FF, Turk J. Studies on Phosphatidylserine by Tandem Quadrupole and Multiple Stage Quadrupole Ion-trap Mass Spectrometry with Electrospray Ionization: Structural Characterization and the Fragmentation Processes. J Am Soc Mass Spectrom. 2005 Sep 1;16(9):1510-22. doi:10.1016/j.jasms.2005.04.018. PMID: 16023863.
- Ham BM, Jacob JT, Cole RB. MALDI-TOF MS of Phosphorylated Lipids in Biological Fluids Using Immobilized Metal Affinity Chromatography and a Solid Ionic Crystal Matrix. Anal Chem. 2005 Jul 1;77(14):4439-47. doi:10.1021/ac058000a. PMID: 16013857.
- Arrese EL, Soulages JL. Insect Fat Body: Energy, Metabolism, and Regulation. Annu Rev Entomol. 2010 Jan 1;55(1):207-25. doi:10.1146/annurev-ento-112408-085356. PMID: 19725772.
- Buszczak M, Lu X, Segraves WA, Chang TY, Cooley L. Mutations in the midway Gene Disrupt a Drosophila Acyl Coenzyme A: Diacylglycerol Acyltransferase. Genetics. 2002 Apr 1;160(4):1511-18. doi:10.1093/genetics/160.4.1511. PMID: 11973306.
Content Alerts
SignUp to our
Content alerts.
 This work is licensed under a Creative Commons Attribution 4.0 International License.


