Environmental Sciences Group. 2023 December 27;4(12):1697-1712. doi: 10.37871/jbres1855.
Nitrogen Supply of Crops and Type of Fertilization and Their Impact on the Soil Case Study of Apulia Region
Angelantonio Calabrese1*, Mariavirginia Campanale2 and Fabiola Iurino1
2Engeo Soc.Cop. A.R.L., Bari 70122, Italy
- Nitrogen
- Soil
- Type of fertilization
- Nitrogen impact
Abstract
Nitrogen (N) is one of the fundamental elements for plant development: it plays a very important role in biochemical processes, such as chlorophyll photosynthesis, the production of amino acids and proteins, but it is also the most critical element in fertilization. When nitrogen is administered to the soil, in its more complex forms, organic and ureic, it transforms into increasingly simple forms Ammonia (NH4+) and Nitric (NO3-) and becomes assailable by plants. Due to its agronomic function, nitrogen represents an element that must be appropriately integrated into the crop cycle through careful fertilization and a careful balance between withdrawals, losses and contributions. The choice of the nitrogen fertilization strategy must obviously aim to guarantee the availability of the element to the crops in the phases in which they need it most, avoiding losses that can represent a threat to the environment or to the crop economic balance.
This article has the main purpose of highlighting the impact of the main fertilizations used in the regional agricultural context, in relation to the concentration of nitrogen in its various forms which remains in the soil, thus becoming part of a potential environmental impact both of the matrix itself and of the aquifers. Below, through the analysis of the main crop types. The conclusion is the impact of the main crop type and them fertilization on the soil in particular for the nitrogen compounds.
Introduction
One of the main forms of groundwater contamination is linked to the presence of nitrogenous compounds. The growing needs of nitrogen by the human population for the production of food and energy have led to an increase in the production of nitrogen in reactive form (i.e. all forms except the molecular state N2) [1,2]. It is estimated that the input of reactive nitrogen from human activities are primarily industrial processes and the use of fertilizers, grew by 225% from 1970 to 2000 [3,4] and that this represents 45% of the total nitrogen fixed on Earth [5]. The amount of nitrogen that is not removed and/or immobilized from the soil can leach [6,7] until it reaches groundwater and surface water bodies, causing various negative effects both in the environment and in the man [8,9]. However, not all forms undergo the leaching action in the soil, the only highly leachable form is nitric nitrogen more abundant, more mobile and therefore absorbed in greater quantities by plants, unlike ammonia nitrogen which is very volatile and is not subject to leaching also because it is absorbed very quickly by plants and mainly used for the synthesis of amino acids [10].
Simple nitrogen-based fertilizers can contain nitrogen in nitric, ammonia, nitric-ammonia and organic forms [11]. Fertilizers with nitrate nitrogen are directly and readily absorbed by plants, while those with ammonia nitrogen, although having the same physiological value, are absorbed directly more slowly, but are mostly used indirectly undergoing transformation into nitrogen in the soil nitrate by nitrifying bacteria [11]. Fertilizers based on organic nitrogen exert their action very slowly, having to undergo successive transformations into ammonia and then nitric nitrogen in the soil. The main nitric nitrogen fertilizers are sodium nitrate (NaNO3) and calcium (Ca(NO3)2). The latter also acts as a corrective for soils lacking or poor in calcium. Among the nitrogen fertilizers are ammonium sulphate ((NH4)2SO4) and ammonium carbonate ((NH4)2CO3). A double-acting nitrate, containing equal parts of both nitric and ammonia nitrogen, is ammonium nitrate (NH4NO3). It is the most widely used compound in almost all fertilizer producing countries, but has the drawback of a high hygroscopicity which makes storage difficult. Furthermore, ammonium nitrate is susceptible to detonation due to its sensitivity to heat and shock, so it is diluted with inert substances such as calcium carbonate, diatomaceous earth or clay [12].
Organic nitrogen fertilizers are mainly urea and calcium cyanimide. Urea, CO(NH₂)₂, is the solid fertilizer with the highest nitrogen title, about 46%; its physiological-agricultural action is comparable to that of ammonia nitrogen, given that it is easily hydrolysed in the soil, turning into ammonium carbonate [12].
The use of chemical fertilizers was created to meet the need for plant nutrients for their development; on the other hand, however, poor management in the use of fertilizers has been the cause of massive nitrate pollution in groundwater. Several studies have shown that fertilizers are often administered in a single solution, thus exceeding the absorption capacity of plants [13]. The plants, on the other hand, require multiple administrations during the different seasons. But above all it has been found that the fertilizers are supplied in excessive quantities with respect to the real needs of the crops [13]. The report on the state of the environment presented by the ministry of the environment to parliament in 2001, refers to a use of more than 4,600,000 t of fertilizers containing N, P and K which correspond to about 890,000 t of nitrogen, with an average around 53 kg/ha of nitrogen [14]. The geographical distribution of these inputs of nutrients is very diversified, reaching in certain provinces inputs such as to generally have a surplus of more than 200 kg/ha. When such excess fertilization occurs, the nitrates present in the fertilizers are easily subject to leaching by rainfall and irrigation. In this way, in the underlying groundwater, the formation of polluted plumes with high concentrations of nitrates can occur [14].
In agriculture there are different types of fertilizers used in order to provide the right amount of nitrogen to plants [15]. Due to its agronomic function, nitrogen represents an element that must be appropriately integrated into the crop cycle through careful fertilization and a balanced balance between withdrawals, losses and contributions. The choice of the nitrogen fertilization strategy must obviously aim to guarantee the availability of the element to the crops in the phases in which they need it most, avoiding losses that can represent a threat to the environment or to the crop economic balance. In recent times, agriculture has favoured different types of fertilization which can be divided into four macro groups: chemical fertilization [16], based on the use of synthetic fertilizer which contains essential nutrients such as nitrogen, phosphorus and potassium, mineral fertilization [17], i.e. the use of nutrients in the form of mineral salts, integrated fertilization [18], with the use of mineral fertilization and integrating the needs of crops with chemical fertilization, and organic fertilization [19], with the use of organic elements of animal, vegetable or mixed at the basis of organic and biodynamic agriculture.
This article has the main purpose of highlighting the impact of the main fertilizations used in the regional context, in relation to the concentration of nitrogen in its various forms which remains in the soil, thus becoming part of a potential environmental impact both of the matrix itself and of the aquifers. Below, through the analysis of the main crop types.
Material and Methods
Study areas and sampling
It was been identified six monitoring areas in the Puglia region. The selected areas were previously analysed using the existing databases in order to identify areas that have the same lithology and soil type. In each of the six areas, the uses of the land were thus identified through the use of the corine land cover map in order to identify the predominant uses present. It was proceed with the identification of sub-areas, 24 sub-areas for each area, for a total of 144 sub-areas. The sub-areas were classified into: 4 sub-areas with orchards (in total 24 sub-areas), 4 sub-areas with uncultivated fields (in total 24 sub-areas), 4 sub-areas with horticulture (in total 24 sub-areas), 4 sub-areas with arable crops (in total 24 sub-areas), 4 sub-areas with olive groves (in total 24 sub-areas) and 4 sub-areas with vineyards (in total 24 sub-areas). For each sub-area, 25 sampling sites were identified and two series of sampling were carried out in the 2021 year before the start of the agronomic practices and in the 2022 at the end of all the agronomic practices.
The soil matrix sample was carried out in according to the methods of Soil Chemical Analysis ‖ issued by the Ministry of Agricultural and Forestry Politics, approved with the Ministerial Decree 13th September 1999.
The basic aim of this sampling procedure is to obtain a truly representative sample of the soil under investigation.
Samples were collected from the soil at a depth between 15-30 cm using a sterile spatula and excluding the first two centimetres presenting grass. They were then put inside sterile envelopes and stored at 10°C.
Chemical analysis
The analysis set was performed on the collected soil samples according to the official Methods of Chemical Analysis of Soils (MUACS) as required by the Ministerial Decree 13 September 1999 issued by the Ministry of Agricultural and Forestry Policies.
The preparation of the sample is such that the smallest weighing is representative of the entire sample collected in the field.
Determination of total nitrogen by kjeldahl mineralization with hydrogen peroxide (Method XIV.2)
The method is based on the oxidation of the sample in concentrated sulfuric acid according to the Kjeldahl methodology. To complete the transformation of organic nitrogen into mineral nitrogen, hydrogen peroxide is used as a further oxidant.
Transfer 2.5 g of fine soil to a 300 ml Kjeldahl flask. Add 4 ml of hydrogen peroxide (H2O2) [30% m/m (p = 1.122)]. After removing the organic substance, carefully add 11 ml of sulfuric acid [96% (p = 1.835)]. Place a funnel of glass at the mouth of the flask and boil on a Bunsen flame for 30 minutes. Cool and slowly add another 4ml of hydrogen peroxide. Heat and continue boiling for 30 minutes. After cooling, quantitatively transfer the suspension into 250 ml volumetric flask. Make up to the mark with H2O. Homogenize and let the solid particles present settle. The total nitrogen content in the clear supernatant solution was determined by distillation according to Kjeldahl.
Distillation according to kjeldahl (Method XIV.3)
The method applies to the clear solution obtained according to Method XIV.2. The ammonia nitrogen is distilled in an alkaline environment and absorbed in a solution of known sulfuric acid content. The excess sulfuric acid is titrated with a solution of known sodium hydroxide content. Collect 200 ml of clear supernatant into the flask (A). Add 2-3 pumice granules. Connect flask A to the distillation apparatus. Collect 50 ml of the sulfuric acid solution (0.01 mol/L) using a precision burette and transfer 50 ml of the sulfuric acid solution into a 500 ml Erlenmeyer conical flask (E). Immerse the extension (D) in the coolant (C) in the sulfuric solution, taking care that the tip of the extension does not touch the bottom of the flask to avoid rising sulfuric acid. Add 30 ml of sodium hydroxide solution (300 g/L) to flask A. Wash the funnel (B) with H2O. Distil the ammonia by boiling the solution contained in the flask (A), moderately at first and then more vigorously. Complete distillation takes 30 to 45 minutes. Make sure, using litmus paper, that all the ammonia is distilled. Detach the extension (D) from the coolant and wash it with H2O.
Titrate the excess sulfuric acid present in the Erlenmeyer conical flask (E) with the sodium hydroxide solution (0.02 moles/L), using the acid: base indicator (bromocresol green and methyl red).
The total nitrogen content is expressed in g x kg-1, to one decimal place. For the calculation the expression is used:
Where:
C = Total nitrogen content in the soil, expressed in g x kg-1.
B = Volume of the solution of sulfuric acid (0.01 molxL-1), expressed in ml (50 ml).
K = Solution correction factor of sulfuric acid (0.01 molxL-1).
B1 = Volume of the solution of sodium hydroxide (0.02 molxL-1).
K1 = Solution correction factor of sodium hydroxide (0.02 molxL-1): 0.28 = 250 ml/ 200 ml = volumetric ratio.
m = Mass of the fine earth sample used for the analysis, expressed in grams.
Determination of nitrate nitrogen, nitrous nitrogen and ammonia nitrogen
For the determination of these elements it was extracted from soil and brought into solution using the method XIV.4 - extraction of mineral nitrogen with potassium chloride solution official Methods of Chemical Analysis of Soils (MUACS) as expected Decree 13 September 1999 issued by the Ministry of Agricultural and Forestry Policies. The different forms of mineral nitrogen present in the soil are extracted at 20° ± 1°C with a KCl solution. In these conditions, potassium removes the ammonium ion bound to the soil exchangers, while the nitrogenous fraction including nitrates and nitrites is brought into solution due to the dipolar effect of the water. The analysis of the individual elements is carried out using a laboratory photometer.
Results and Discussion
The results obtained highlighted how the different crops analysed, with the same quantity of nitrogen used for fertilization (120 gN/Kg of soil as per current legislation), present diversified ranges. As regards the total nitrogen that remains in the soil (Figure 1a) the orchards have a range with a minimum of 0.89 g of N/Kg of soil to a maximum of 3.12 g of N/Kg of soil, horticultural crops have a range from a minimum of 1.02 g of N/Kg of soil to a maximum of 5.4 g of N/Kg of soil, arable crops have a range from a minimum of 0.95 g of N/Kg of soil to a maximum of 2.52 g of N/Kg of soil, olive groves have a range from a minimum of 0.69 g of N/Kg of soil to a maximum of 3.44 g of N/Kg of soil and vineyards have a range of a minimum of 0.64 g of N/Kg of soil to a maximum of 3.00 g of N/Kg of soil. Uncultivated fields have a range from a minimum of 1.02 g of N/Kg of soil to a maximum of 4.16 g of N/Kg of soil. The analyses carried out before the agronomic activity (year 2021) and those after the agronomic activity (2022) (Figure 1b), highlighted how only for fields with orchards or uncultivated fields there is no variation in the presence of total nitrogen in the soil remaining at least constant. In relation to other types of crops, it was noted that fields cultivated with vegetables present a very large increase in nitrogen after agronomic activities, going from an average concentration of 1.69 g of N/Kg of soil in 2021 to an average concentration of 3.26 g of N /Kg of soil in 2022. The increase relating to arable land is significantly smaller, although present (from an average concentration of 1.43 g of N/Kg of soil in 2021 to an average concentration of 1.92 g of N/Kg of soil in 2022), olive grove (from an average concentration of 1.80 g of N/Kg of soil in 2021 to an average concentration of 2.07 g of N/Kg of soil in 2022) and vineyard (from an average concentration of 1.72 g of N/Kg of soil in 2021 to an average concentration of 2.25 g of N/Kg of soil in 2022).
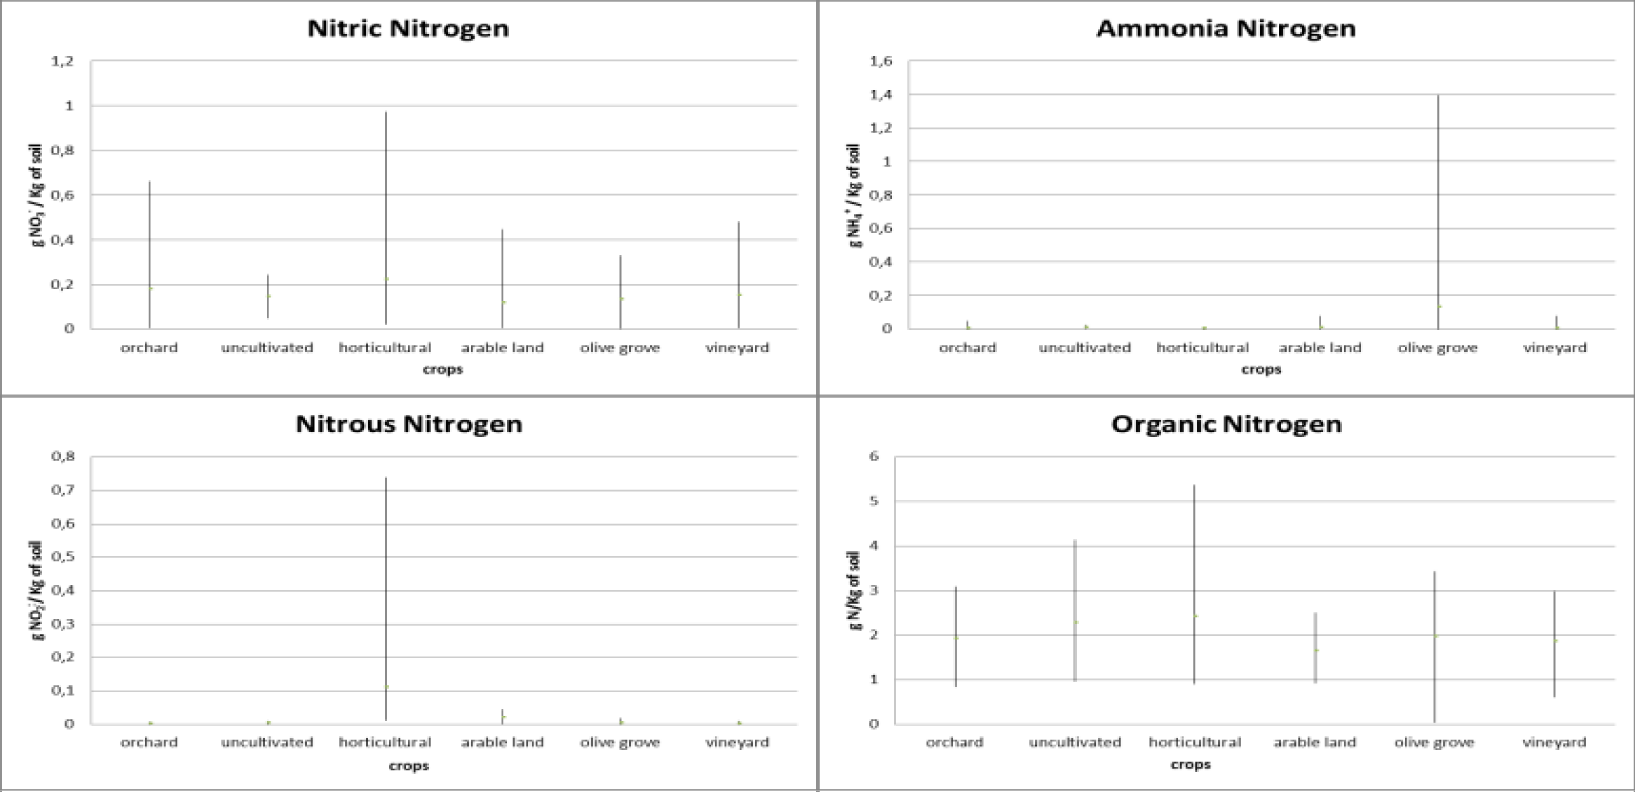
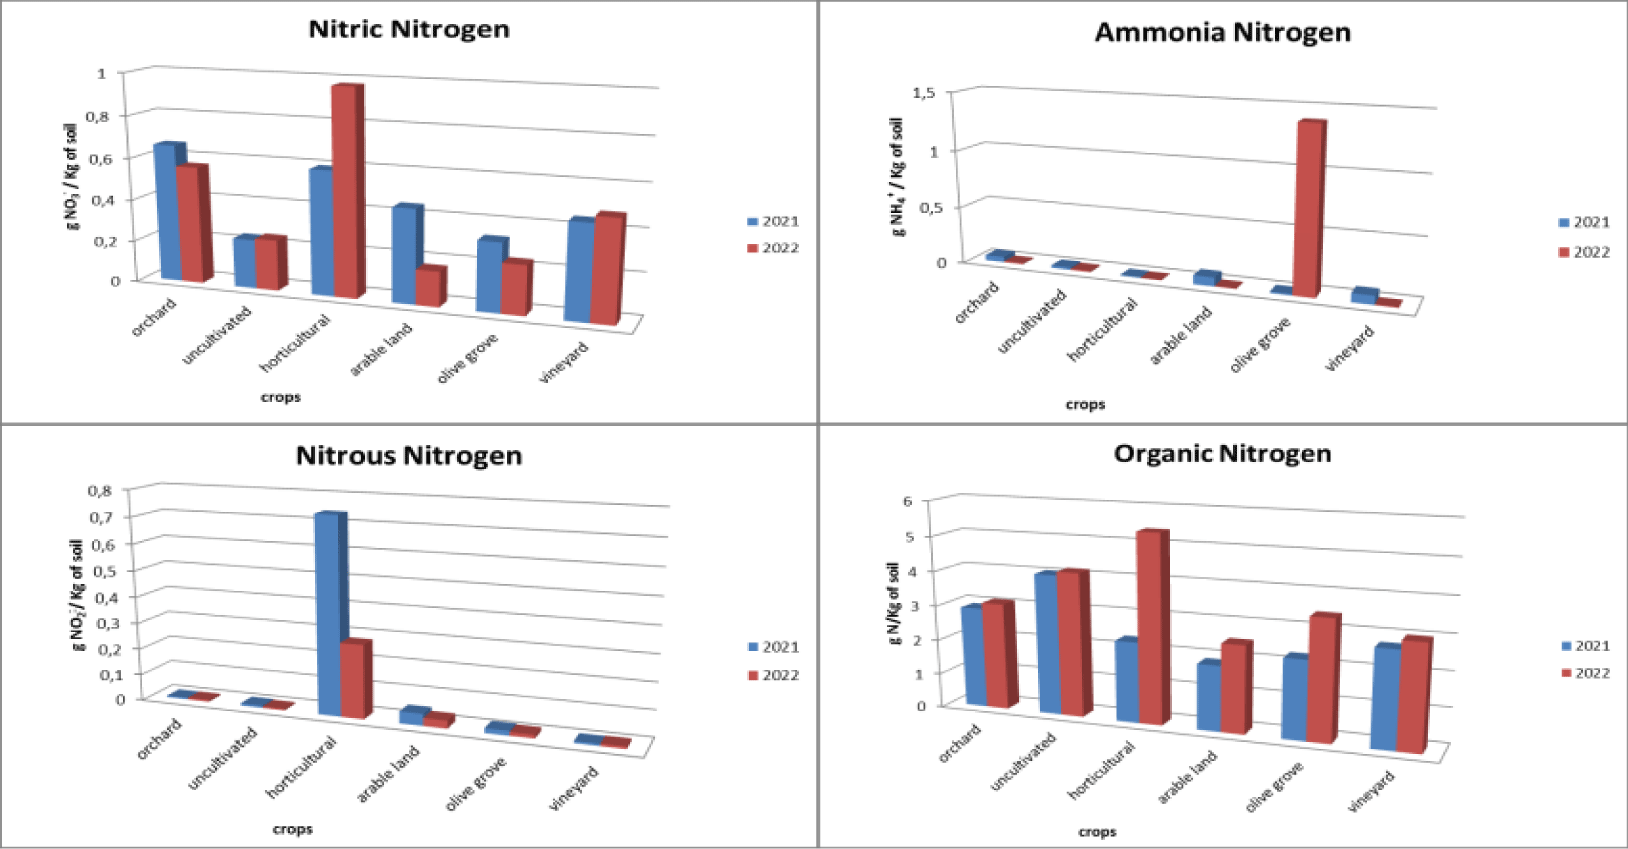
Regarding the different forms of nitrogen, different trends were found in the different crops analysed (Figures 2,3). The uncultivated fields present a constant trend in relation to all forms of nitrogen, with an average concentration of 2.50 gN/Kg of soil in relation to organic nitrogen, with a range of variation that goes from 0.98 gN/Kg of soil to 4.14 gN/ Kg of soil, and an average concentration of 0.14 g NO3-/Kg of soil relative to nitrate nitrogen with a range of variation from 0.05 gNO3-/Kg of soil to 0.24 gNO3-/Kg of soil. Instead, both ammonia nitrogen and nitrous nitrogen are equal to 0. The orchard has an average concentration of nitrate nitrogen with a range from 0.01 gNO3-/Kg of soil to 0.66 gNO3-/Kg of soil, with a decrease between 2021 with an average concentration of 0.22 gNO2-/Kg of soil and in 2022 an average concentration of 0.13 gNO2-/Kg of soil. Instead, there is an increase in organic nitrogen which goes from an average concentration of 1.50 gN/Kg of soil in 2021 to an average concentration of 2.32 gN/Kg of soil with a range from 0.843 gN/Kg of soil to 3.09 gN/Kg of soil. The concentrations of ammonia nitrogen and nitrous nitrogen are constant and with a range close to zero. In relation to vegetable fields, the absence of ammonia nitrogen is noted, nitrous nitrogen has a range that goes from 0.01 gNO2-/Kg of soil and a temporal decrease passing from an average concentration of 0.15 gNO2-/Kg of soil in 2021 to 0.07 gNO2-/Kg of soil in 2022. Both nitrate nitrogen and organic nitrogen instead show an increase. Regarding nitrate nitrogen which presents a range of variation between 0.02 gNO3-/Kg of soil and 0.97 gNO3-/Kg of soil with a concentration that goes from 0.59 gNO3-/Kg of soil in 2021 to 0.974 gNO3-/Kg of soil in 2022. Organic nitrogen has a range between 0.91 gN/Kg of soil to 5.38 gN/Kg of soil. The increase in this form of nitrogen is significant, going from 2.32 gN/Kg of soil in 2021 to 5.38 gN/Kg of soil in 2022.
Fields cultivated with arable land show a decrease in nitrate nitrogen, ammonia nitrogen and nitrous nitrogen. For nitrate nitrogen, a range between 0 gNO3-/Kg of soil and 0.45 gNO3-/Kg of soil is found with a concentration that goes from 0.447 gNO3-Kg of soil in 2021 to 0.17 gNO3-Kg of soil in 2022. Ammonia nitrogen presents a range between 0 gNH4+/Kg of soil and 0.08 gNH4+/Kg of soil with a decrease from 0.08 gNH4+/Kg of soil in 2021 to 0.01 gNH4+/Kg of soil in 2022. Nitrous nitrogen presents a range between 0 gNO2-/Kg of soil and 0.05 gNO2-/Kg of soil with a decrease from 0.05 gNO2-/Kg of soil in 2021 to 0.03 gNO2-/Kg of soil in 2022. In relation to organic nitrogen, a range between 0.92 gN/Kg of soil and 2.50 gN/Kg of soil with an increase in concentration from 1.87 gN/Kg of soil in 2021 to 2.50 gN/Kg of soil in 2022.
Relative to fields cultivated with olive groves, nitrate nitrogen has a range between 0 gNO3-/Kg of soil and 0.33 gNO3-/Kg of soil with a decrease with a concentration equal to 0.33 gNO3-/Kg of soil in 2021 and 0.24 gNO3-/ Kg of soil in 2022. Nitrous nitrogen is constant with a range close to 0 gNO2-/Kg of soil. As regards ammonia nitrogen, there is a range between 0 gNH4+/Kg of soil and 1.39 gNH4+/Kg of soil. The concentration goes from 0.01 gNH4+/Kg of soil in 2021 to 0.14 gNH4+/Kg of soil in 2022. Organic nitrogen also undergoes an increase. The latter has a range between 0.03 gN/Kg of soil and 3.43 gN/Kg of soil, going from an average concentration of 1.65 gN/Kg of soil in 2021 and reaching 2.27 gN/Kg of soil in 2022.
Finally, the vineyards appear to have constant concentrations of ammonia nitrogen and nitrous nitrogen over time, both close to zero. Nitric nitrogen presents a range of variation between 0.01 gNO3-/Kg of soil and 0.48 gNO3-/Kg of soil with a slight increase over time going from 0.45 gNO3-/Kg of soil in 2021 to 0.48 gNO3-/Kg of soil in 2022. Finally, organic nitrogen has a range between 0.61 gN/Kg of soil and 2.99 gN/Kg of soil. It presents an increase in average concentrations from 2.74 gN/Kg of soil in 2021 to 2.99 gN/Kg of soil in 2022.
Nitrogen compounds were also analyzed in relation to the different agricultural practices used for the different crops.
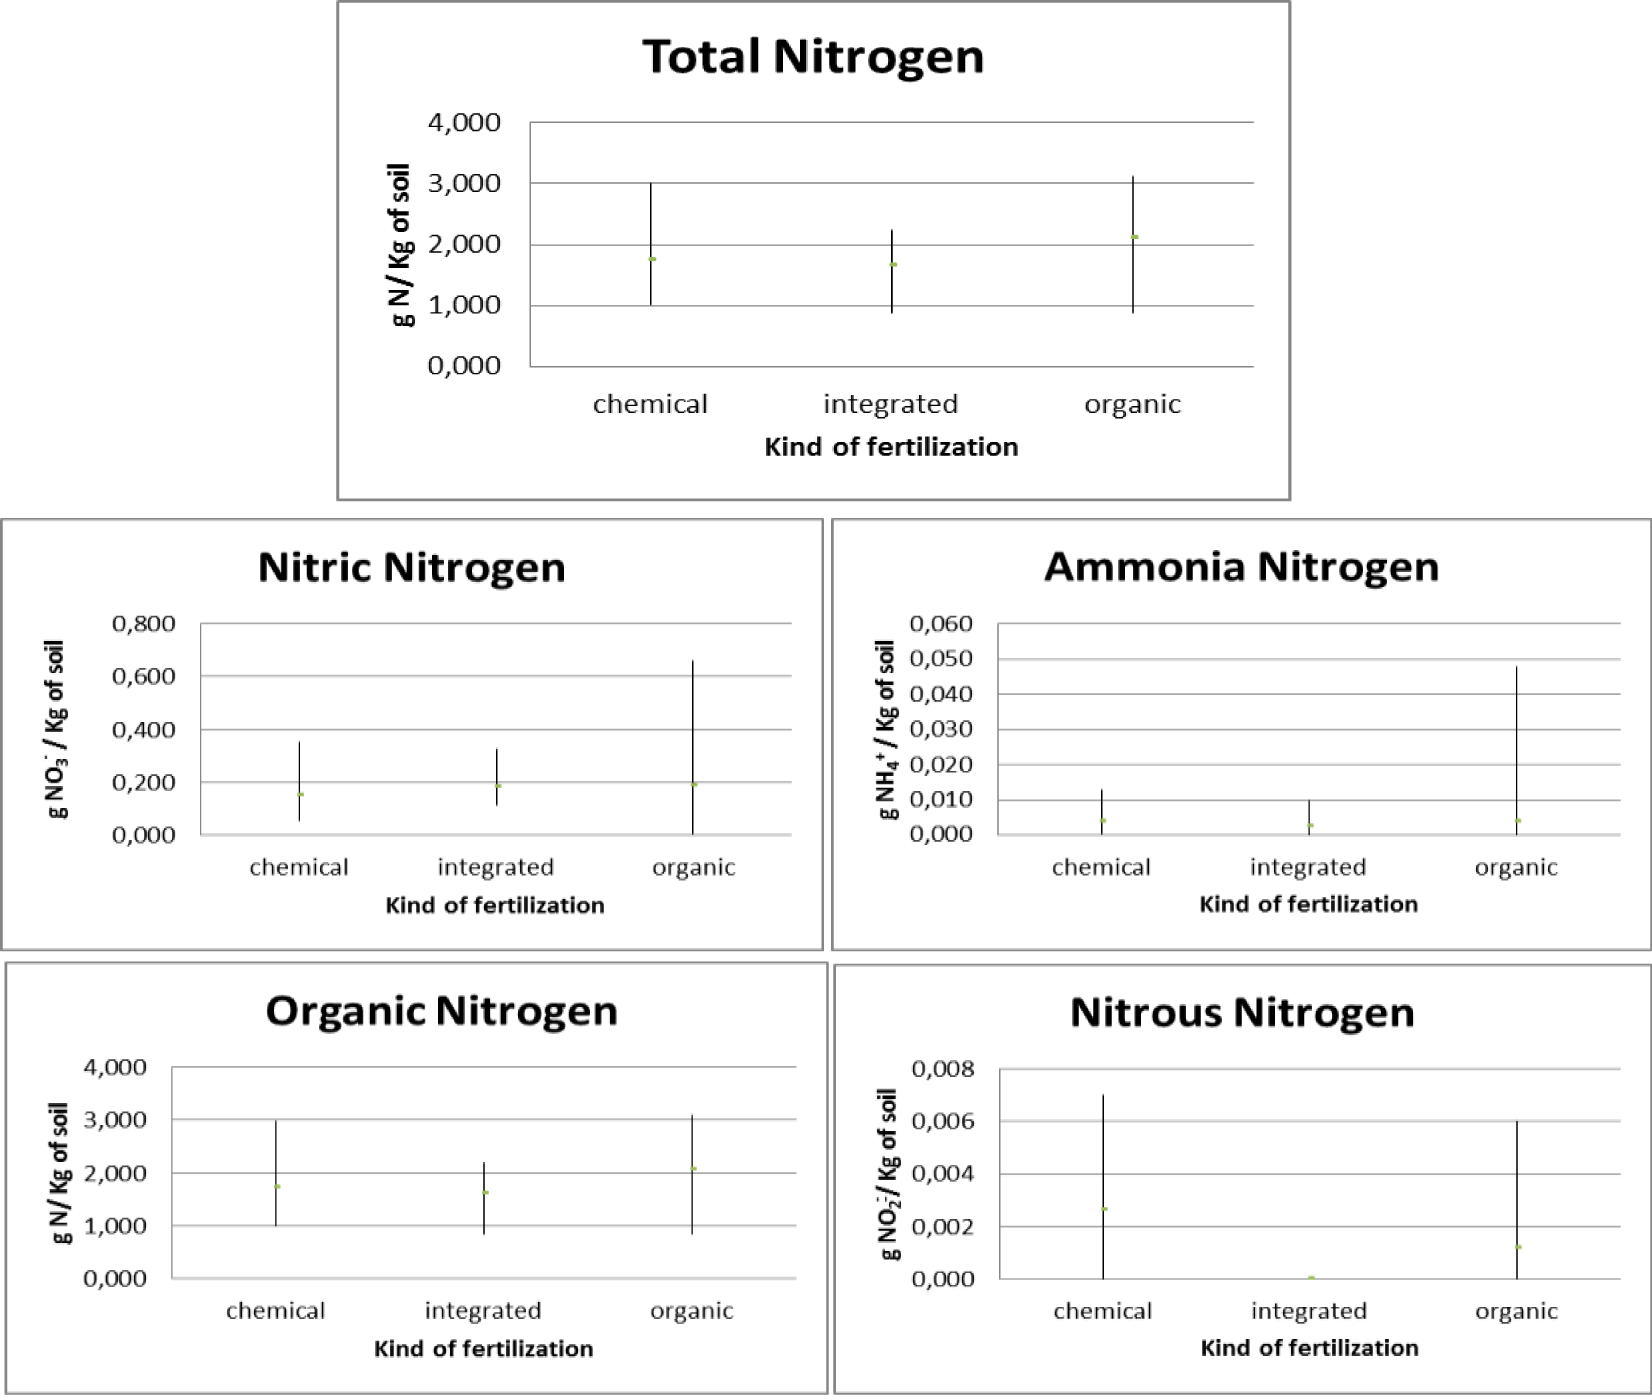
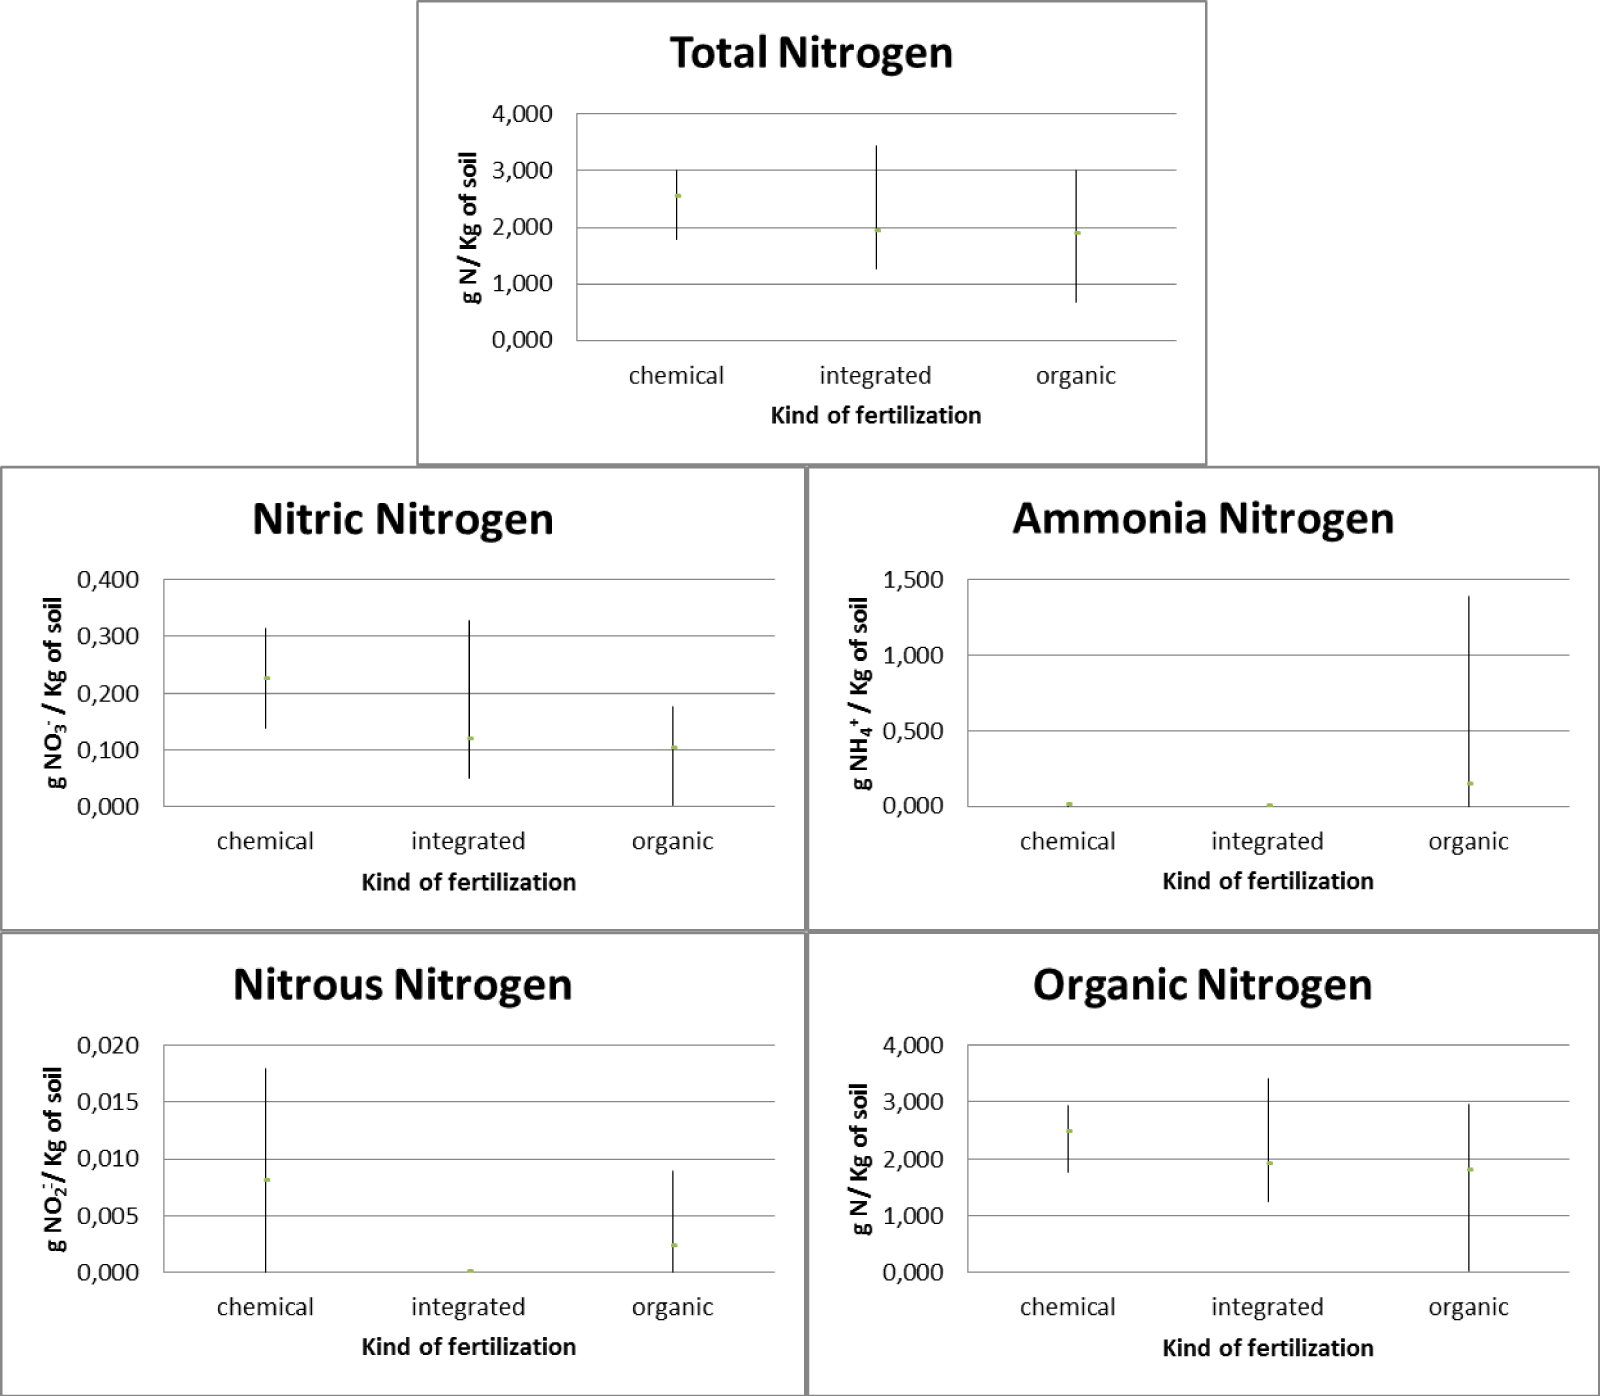
Regarding the orchards, three types of fertilizers were used: chemical, integrated and organic. In relation to chemical fertilization, it was found that there was an average total nitrogen presence in the soil equal to 1.751 gN/Kg with 0.148 gNO3-/Kg of soil nitric nitrogen, 0.004 gNH4+/Kg of soil ammonia nitrogen, 0.003 gNO2-/ Kg of soil nitrous nitrogen and 1,714 gN/Kg of soil organic nitrogen. In relation to the chemical integration, it was found that there is an average total nitrogen presence in the soil equal to 1.66 gN/Kg with 0.182 gNO3-/Kg of soil nitric nitrogen, 0.002 gNH4+/Kg of soil ammonia nitrogen, absence of nitrogen nitrous and 1,617gN/Kg of soil organic nitrogen. With regard to organic fertilization, it was found that there is an average total nitrogen presence in the soil equal to 2.111 gN/Kg of soil with 0.188 gNO3-/Kg soil of nitric nitrogen, 0.004 gNH4+/Kg of soil ammonia nitrogen, 0.001 gNO2-/ Kg of soil nitrous nitrogen and 2.065gN/Kg of soil organic nitrogen (Figure 4).
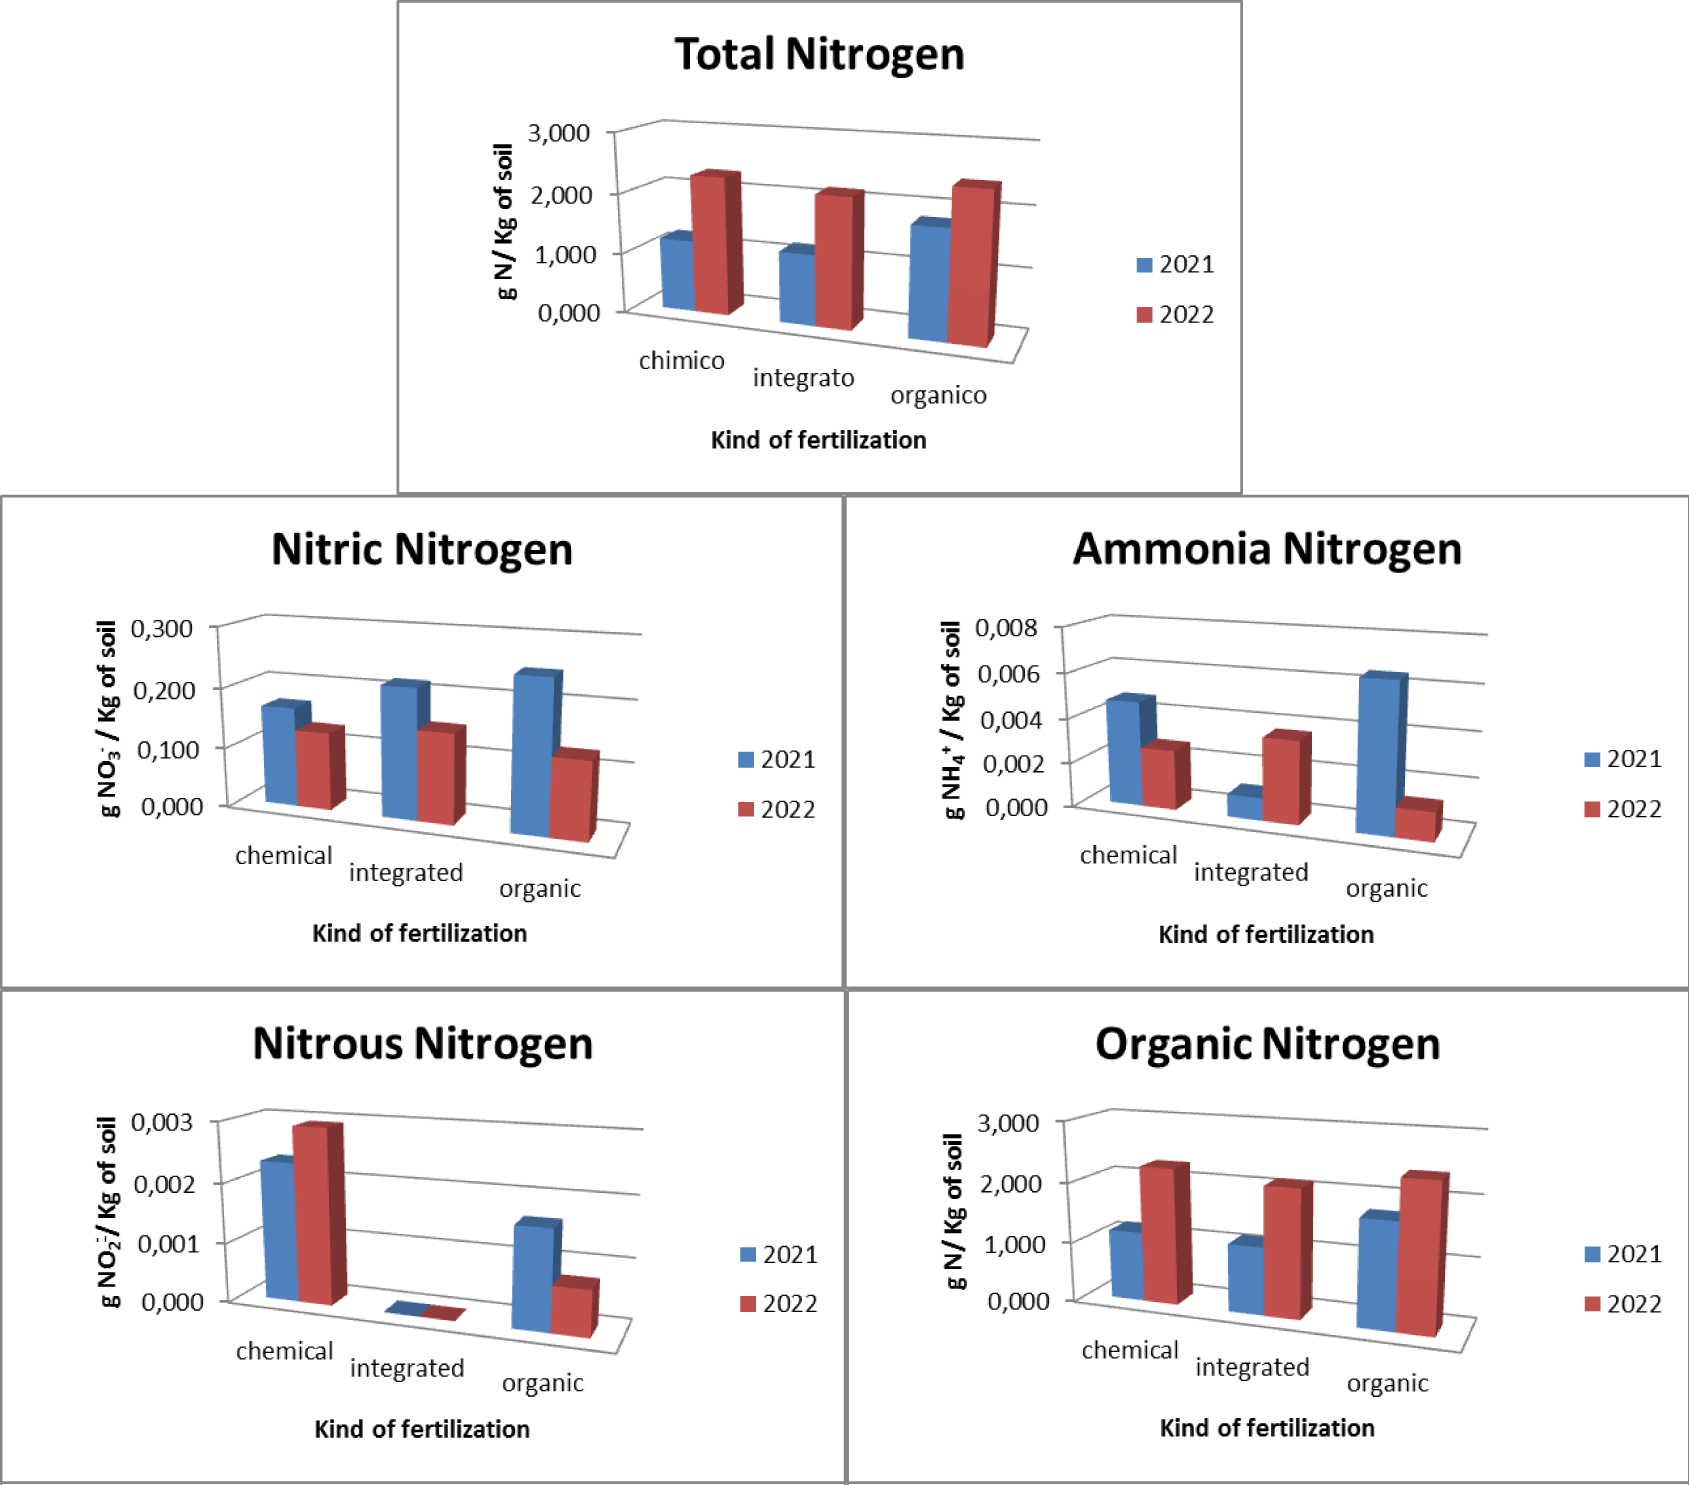
The pre- and post-treatment analysis (Figure 5), highlighted how, as regards the use of chemical fertilizers, there is an increase in the presence of total nitrogen which goes from a concentration of 1,203 gN/Kg of soil in 2021 to a concentration of 2,300 gN/Kg of soil in 2022 with a maximum concentration found of 3,000 gN/Kg of soil. There was an increase in the concentration of organic nitrogen (from 1.161 gN/Kg of soil in 2021 to 2.268 gN/Kg of soil in 2022 with a maximum concentration found of 2.984 gN/Kg of soil), of nitrous nitrogen (from 0.002 gNO2-/Kg of soil in 2021 to 0.003 gNO2-/Kg of soil in 2022 with a maximum concentration of 0.007 gNO2-/Kg of soil), a decrease in the concentration of ammonia nitrogen (from 0.005 gNH4+/Kg of soil in 2021 to 0.003 gNH4+/Kg of soil in 2022 with a maximum concentration of 0.013 gNH4+/Kg of soil) and nitrate nitrogen (from 0.166 gNO3-/Kg of soil in 2021 to 0.129 gNO3-/Kg of soil in 2022 with a maximum concentration of at 0.354 gNO3-/Kg of soil). As regards the use of integrated fertilization, there is an increase in the presence of total nitrogen which goes from a concentration of 1.173 gN/Kg of soil in 2021 to a concentration of 2.147 gN/Kg of soil in 2021 with a maximum concentration of at 2,240 gN/Kg of soil.
There was an increase in the concentration of organic nitrogen (from 1.123 gN/Kg of soil in 2021 to 2.110 gN/Kg of soil in 2022 with a maximum concentration of 2.188 gN/Kg of soil) and ammonia nitrogen (from 0.001 gNH4+ /Kg of soil in 2021 to 0.004 gNH4+/Kg of soil in 2022 with a maximum concentration of 0.010 gNH4+/Kg of soil), a decrease in the presence of nitrate nitrogen (from 0.216 gNO3-/Kg of soil in 2021 to 0.149 gNO3 -/Kg of soil in 2022 with a maximum concentration of 0.328 gNO3-/Kg of soil) and absence of nitrous nitrogen. As regards the use of organic fertilization, there is an increase in the presence of total nitrogen equal to 1,796 gN/Kg of soil in 2021 and 2,425 gN/Kg of soil in 2022 with a maximum concentration equal to 3,120 gN/Kg of soil. There is also an increase in organic nitrogen (1,735 gN/Kg of soil in 2021 and 2,395 gN/Kg of soil in 2022 with a maximum concentration of 3,090 gN/Kg of soil). There is a decrease in ammonia nitrogen (from 0.006 gNH4+/Kg of soil in 2021 to 0.001 gNH4+/Kg of soil in 2022 with a maximum concentration of 0.048 gNH4+/Kg of soil), in nitrate nitrogen (from 0.248 gNO3-/Kg of soil in 2021 to 0.128 gNO3-/Kg of soil in 2022 with a maximum concentration of 0.048 gNO3-/Kg of soil) and nitrous nitrogen (from 0.006 gNO2-/Kg of soil in 2021 to 0.001 gNO2-/Kg of soil in 2022 with a maximum concentration of 0.006 gNO2-/Kg of soil).
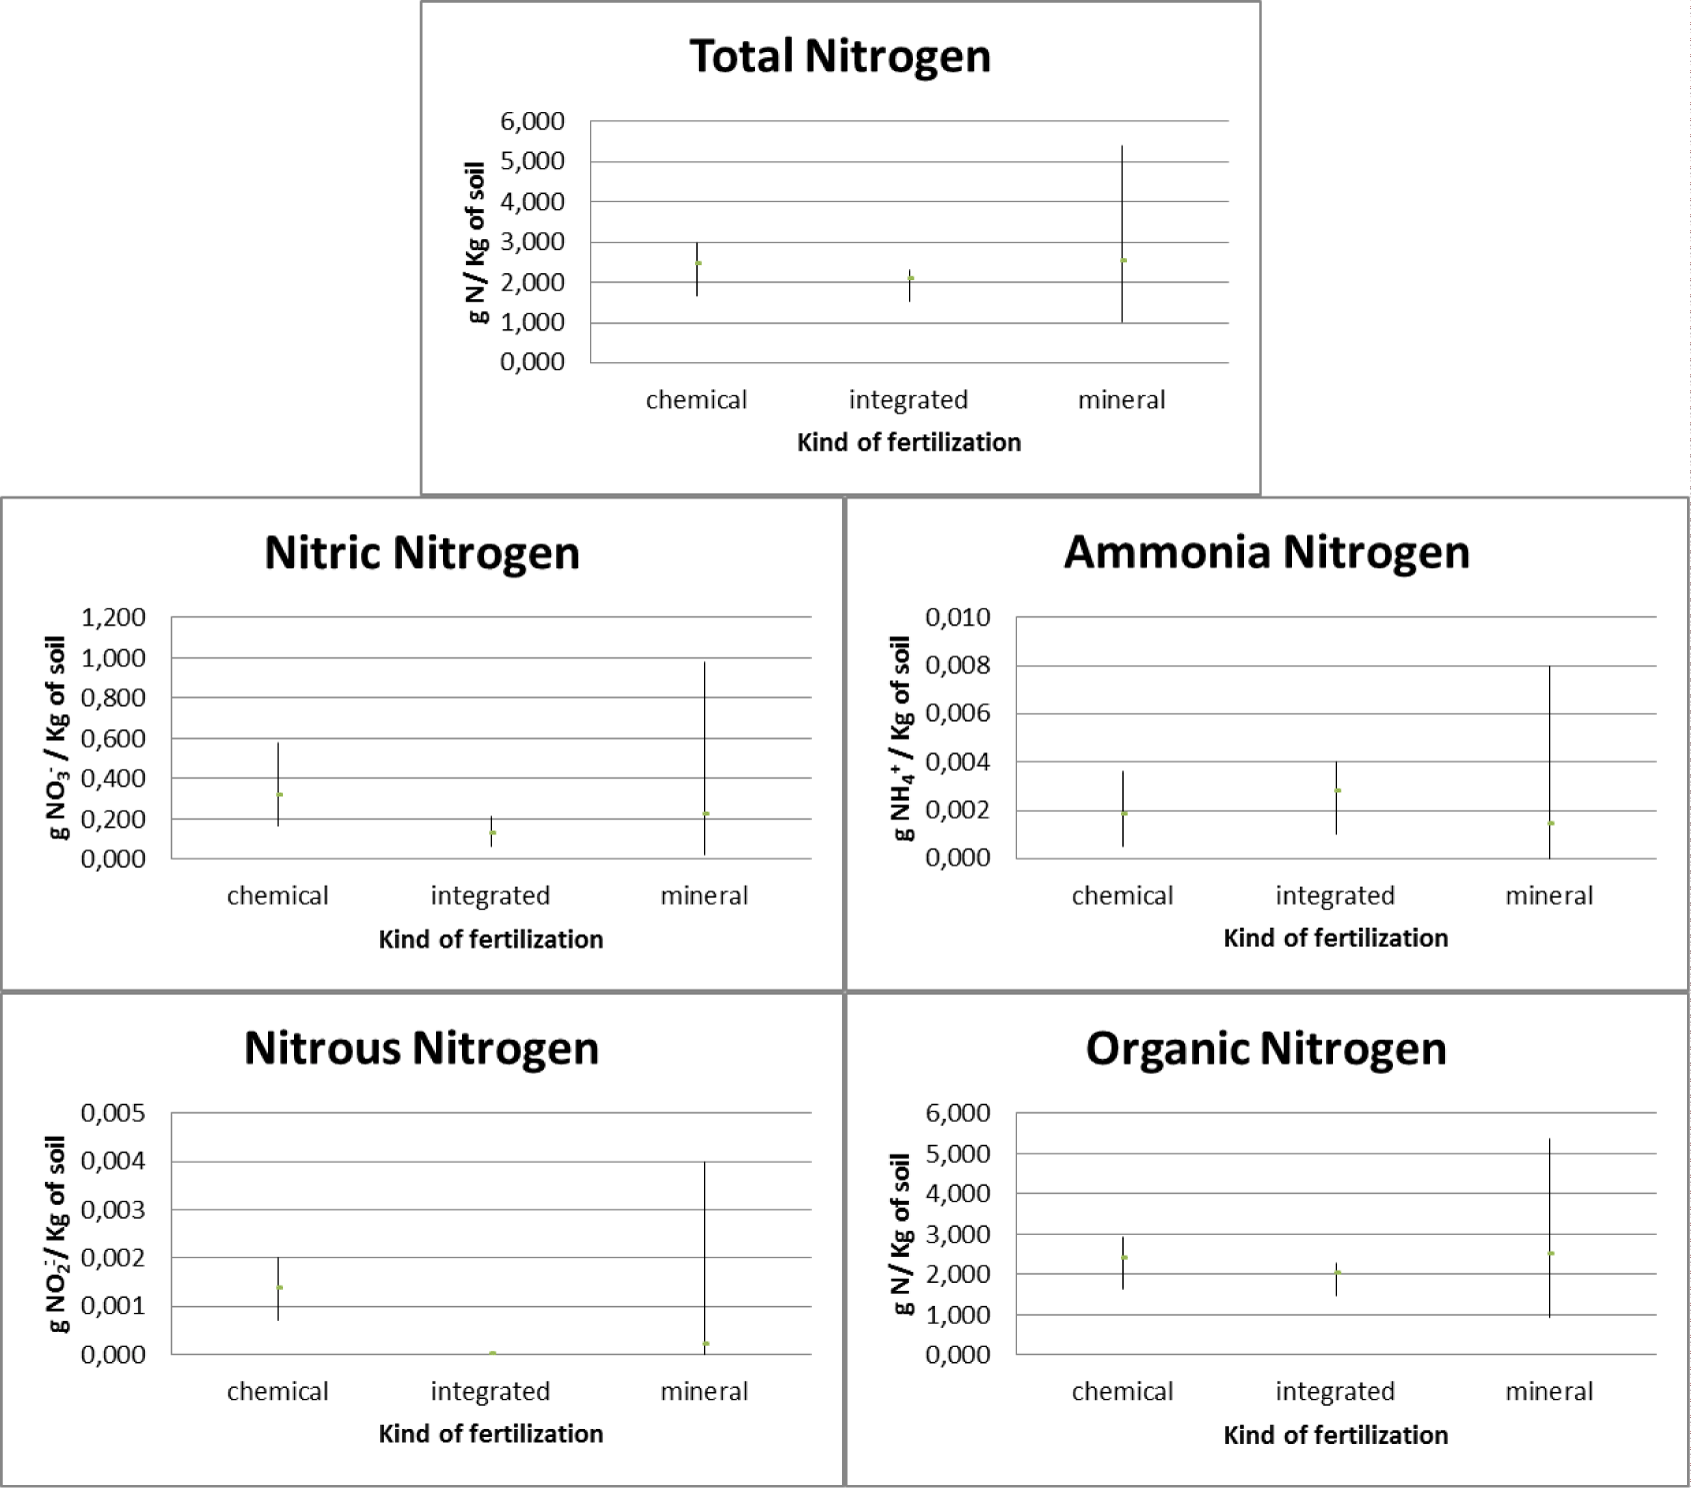
With regards to horticulture, three types of chemical, integrated and mineral fertilizers were used. In relation to chemical fertilization, it was found that there was an average total nitrogen presence in the soil equal to 2.438 gN/Kg with 0.312 gNO3-/Kg of soil nitric nitrogen, 0.002 gNH4+/Kg of soil ammonia nitrogen, 0.003 gNO2-/ Kg of soil nitrous nitrogen and 2.365 gN/Kg of soil organic nitrogen. With regard to integrated fertilization, it was found that there is an average total nitrogen presence in the soil equal to 2.060 gN/Kg with 0.126 gNO3-/Kg of soil nitrate nitrogen soil, 0.003 gNH4+/Kg of soil ammonia nitrogen, absence of nitrous nitrogen and 2.001 gN/Kg of soil organic nitrogen. With regard to mineral fertilization, it was found that there was an average total nitrogen presence in the soil equal to 2.522 gN/Kg with 0.219 gNO3-/Kg of soil nitrate nitrogen soil, 0.001 gNH4+/Kg of soil ammonia nitrogen, absence of nitrous nitrogen and 2,469 gN/Kg of soil organic nitrogen (Figure 6).
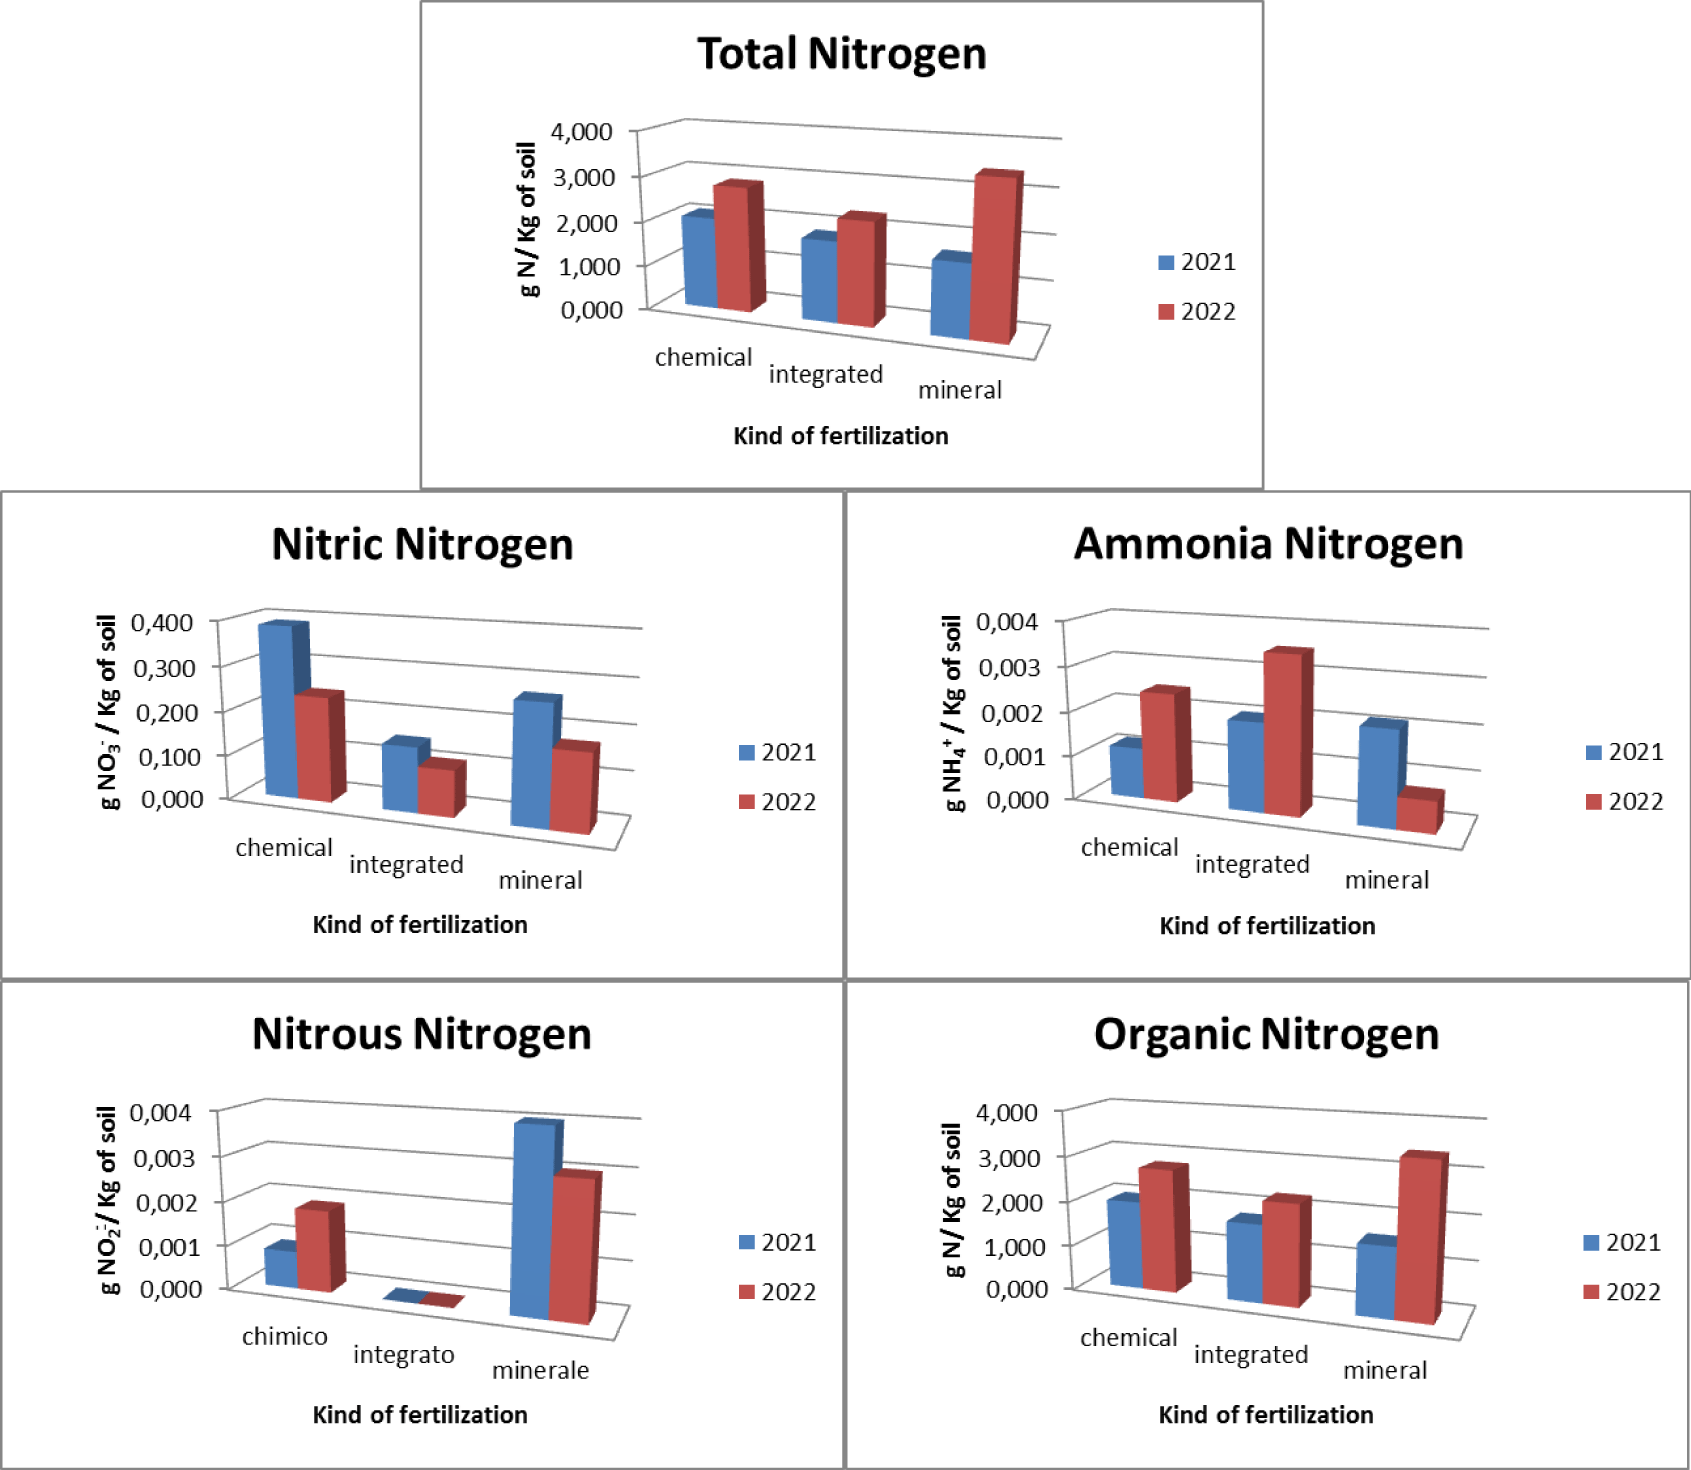
The pre- and post-treatment analysis highlighted how (Figure 7), as regards the use of chemical fertilizers, there is an increase in the presence of total nitrogen which goes from a concentration of 2.065 gN/Kg of soil in 2021 to a concentration of 2.810 gN/Kg of soil in 2022 with a maximum concentration found of 3,000 gN/Kg of soil. There was an increase in the concentration of organic nitrogen (from 1.976 gN/Kg of soil in 2021 to 2.754 gN/Kg of soil in 2022 with a maximum concentration found of 2.928 gN/Kg of soil), of nitrous nitrogen (from 0.001 gNO2-/Kg of soil in 2021 to 0.002 gNO2-/Kg of soil in 2022 with a maximum concentration of 0.002 gNO2-/Kg of soil) and ammonia nitrogen (from 0.001 gNH4+/Kg of soil in 2021 to 0.002 gNH4+/Kg of soil in 2022 with a maximum concentration of 0.004 gNH4+/Kg of soil) and a decrease in the concentration of nitrate nitrogen (from 0.387 gNO3-/Kg of soil in 2021 to 0.237 gNO3-/Kg of soil in 2022 with a maximum concentration of at 0.576 gNO3-/Kg of soil).
As regards the use of integrated fertilization, it presents an increase in total nitrogen which goes from a concentration of 1,810 gN/Kg of soil in 2021 to a concentration of 2,310 gN/Kg of soil in 2021 with a maximum concentration of 2,320 gN/Kg of soil. There is an increase in the concentration of organic nitrogen (from 1.742 gN/Kg of soil in 2021 to 2.260 gN/Kg of soil in 2022 with a maximum concentration of 2.284 gN/Kg of soil) and ammonia nitrogen (from 0.002 gNH4+ /Kg of soil in 2021 to 0.004 gNH4+/Kg of soil in 2022 with a maximum concentration of 0.004 gNH4+/Kg of soil), a decrease in the presence of nitrate nitrogen (from 0.147 gNO3-/Kg of soil in 2021 to 0.105 gNO3 -/Kg of soil in 2022 with a maximum concentration of 0.208 gNO3-/Kg of soil) and absence of nitrous nitrogen. As regards the use of mineral fertilization, there is an increase in the presence of total nitrogen equal to 2,065 gN/Kg of soil in 2021 and 2,810 gN/Kg of soil in 2022 with a maximum concentration equal to 5,400 gN/Kg of soil. There is also an increase in organic nitrogen (1,552 gN/Kg of soil in 2021 and 3,385 gN/Kg of soil in 2022 with a maximum concentration of 5,378 gN/Kg of soil). There is a decrease in ammonia nitrogen (from 0.002 gNH4+/Kg of soil in 2021 to 0.001 gNH4+/Kg of soil in 2022 with a maximum concentration of 0.008 gNH4+/Kg of soil), in nitrate nitrogen (from 0.266 gNO3-/Kg of soil in 2021 to 0.173 gNO3-/Kg of soil in 2022 with a maximum concentration of 0.974 gNO3-/Kg of soil) and nitrous nitrogen (from 0.004 gNO2-/Kg of soil in 2021 to 0.003 gNO2-/Kg of soil in 2022 with a maximum concentration of 0.004 gNO2-/Kg of soil).
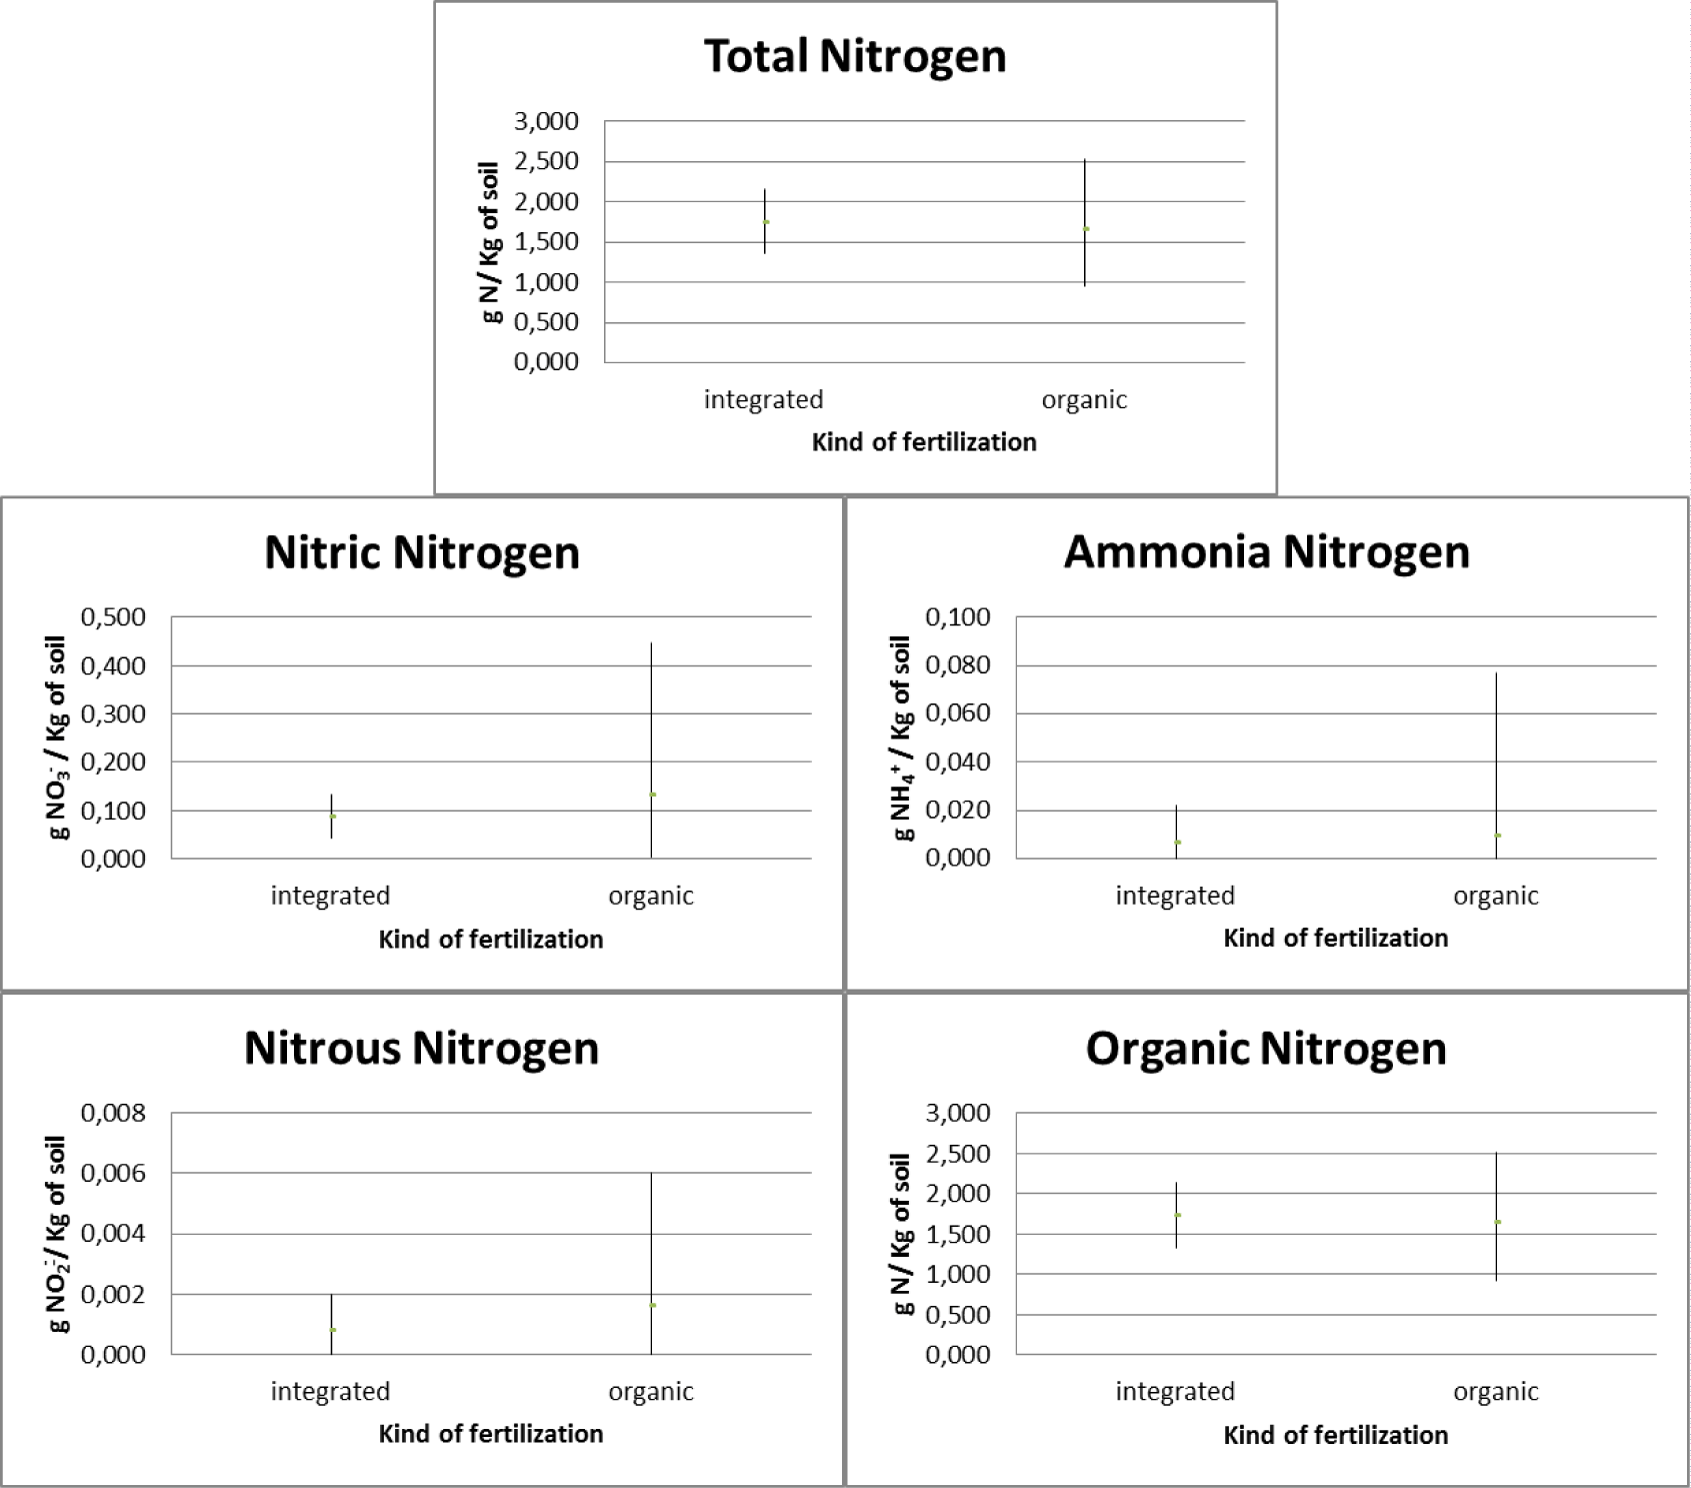
With regard to arable land, two types of integrated and organic fertilizers were used. In relation to integrated fertilization, it was found that there is an average total nitrogen presence in the soil equal to 1.733 gN/Kg with 0.084 gNO3-/Kg of soil nitric nitrogen, 0.006 gNH4+/Kg of soil ammonia nitrogen, 0.001 gNO2-/ Kg of soil nitrous nitrogen and 1.709 gN/Kg of soil organic nitrogen. With regard to organic fertilization, it was found that there is an average total nitrogen presence in the soil equal to 1.646 gN/Kg with 0.129 gNO3-/Kg of soil nitric nitrogen, 0.009 gNH4+/Kg of soil ammonia nitrogen, 0.002 gNO2-/ Kg of soil nitrous nitrogen and 1.625gN/Kg of soil organic nitrogen (Figure 8).
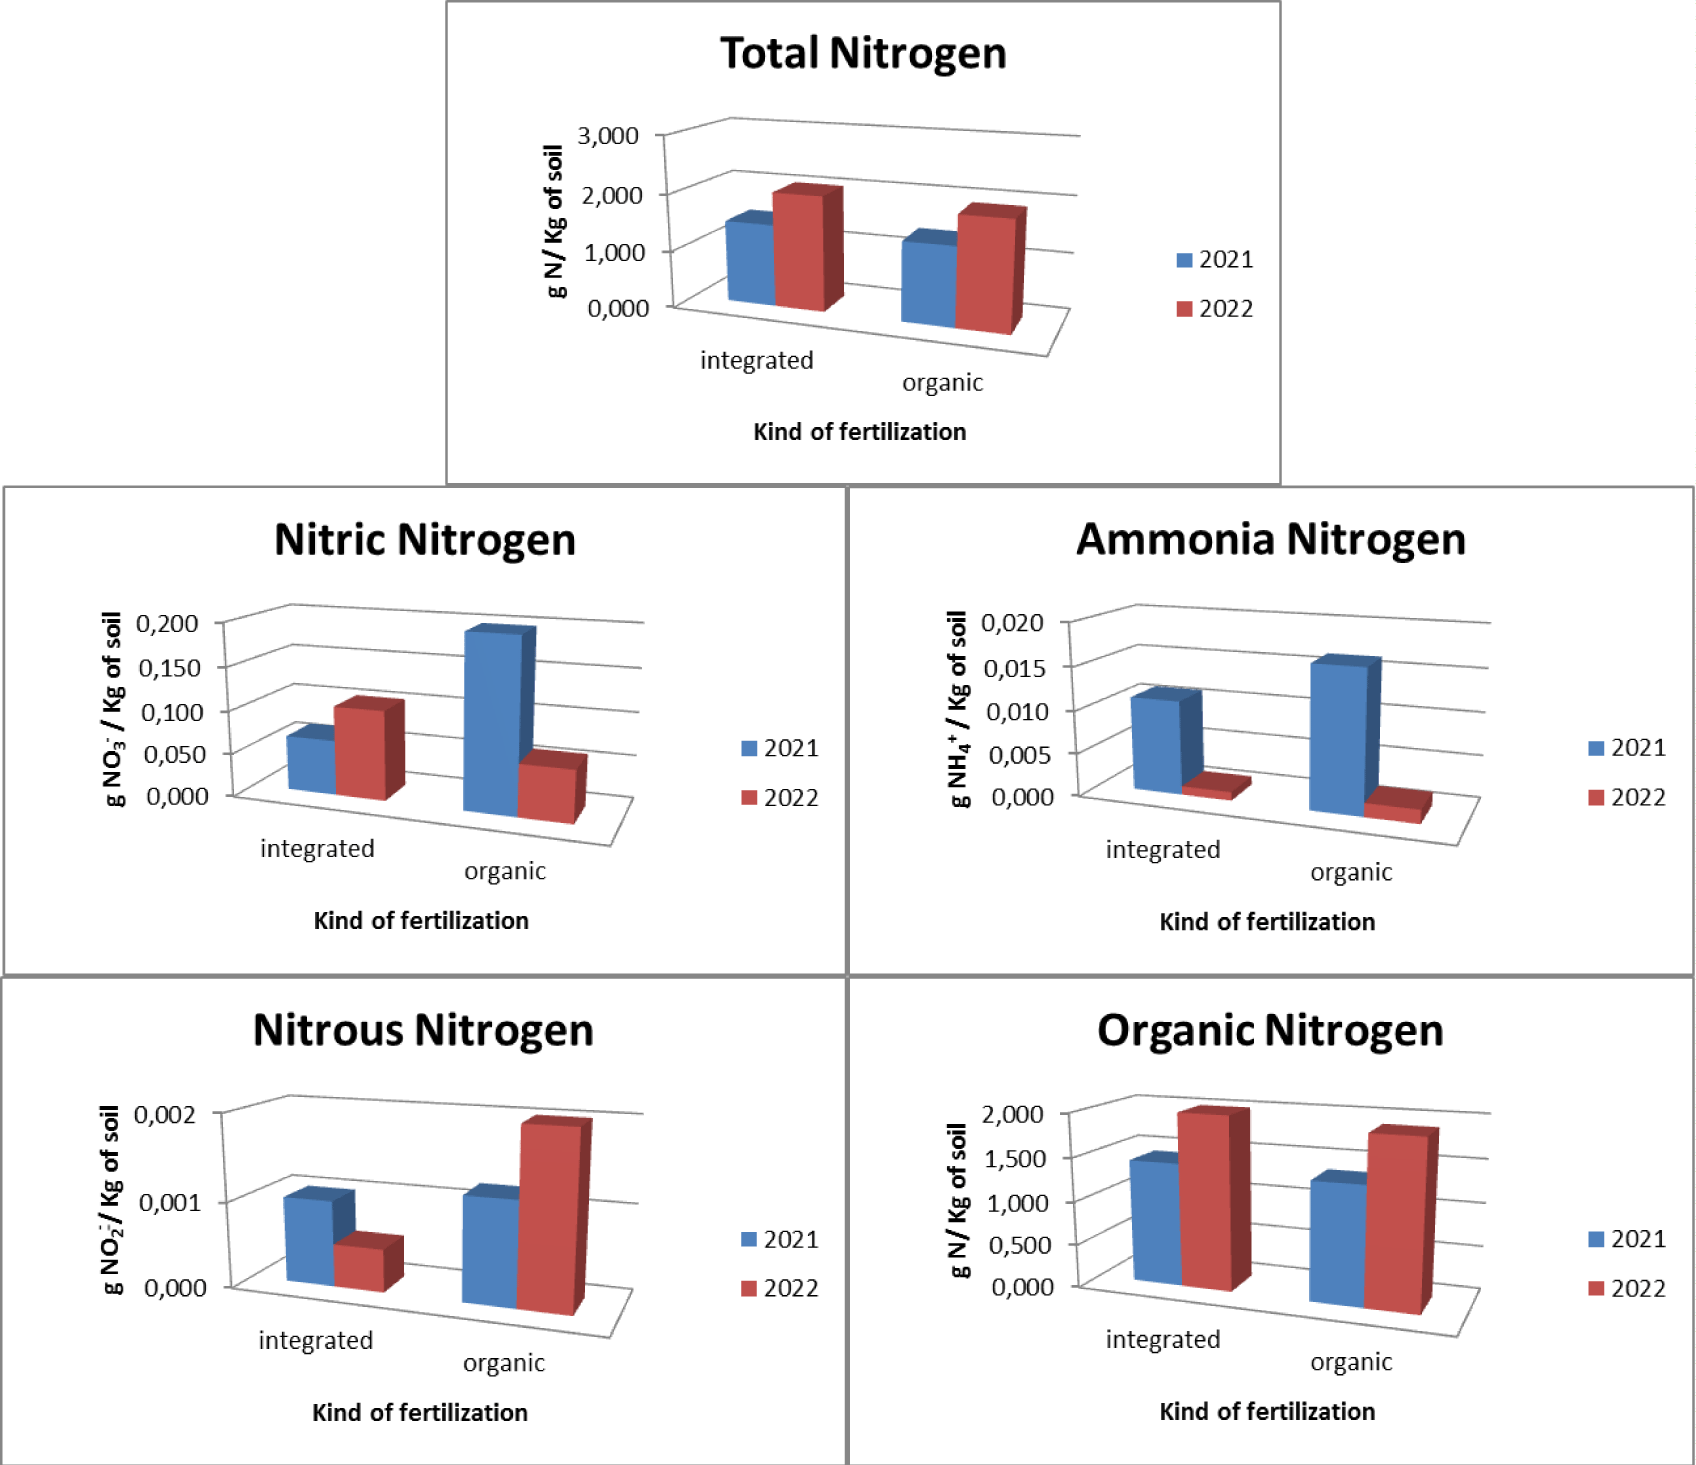
The pre- and post-treatment analysis highlighted how (Figure 9), as regards the use of integrated fertilization, there is an increase in total nitrogen which goes from a concentration of 1.445 gN/Kg of soil in 2021 to a concentration of 2.020 gN/Kg of soil in 2021 with a maximum concentration of 2.160 gN/Kg of soil. There was an increase in the concentration of organic nitrogen (from 1.422 gN/Kg of soil in 2021 to 1.996 gN/Kg of soil in 2022 with a maximum concentration of 2.142 gN/Kg of soil) and nitrate nitrogen (from 0.064 gNO3 -/Kg of soil in 2021 to 0.104 gNO3-/Kg of soil in 2022 with a maximum concentration of 0.133 gNO3-/Kg of soil) and a decrease in the presence of ammonia nitrogen (from 0.011 gNH4+/Kg of soil in 2021 to 0.001 gNH4+/Kg of soil in 2022 with a maximum concentration of 0.022 gNH4+/Kg of soil) and a constant concentration of nitrous nitrogen (0.001 gNO2-/Kg of soil with a maximum concentration of 0.002 gNO3-/Kg of soil) . As regards the use of organic fertilization, there is an increase in the presence of total nitrogen equal to 1,384 gN/Kg of soil in 2021 and 1,908 gN/Kg of soil in 2022 with a maximum concentration equal to 2,520 gN/Kg of soil. There is also an increase in organic nitrogen (1.353 gN/Kg of soil in 2021 and 1.897 gN/Kg of soil in 2022 with a maximum concentration of 2.504 gN/Kg of soil) and nitrous nitrogen (from 0.001 gNO2-/Kg of soil in 2021 to 0.002 gNO2-/Kg of soil in 2022 with a maximum concentration of 0.006 gNO2-/Kg of soil). There was a decrease in ammonia nitrogen (from 0.016 gNH4+/Kg of soil in 2021 to 0.002 gNH4+/Kg of soil in 2022 with a maximum concentration of 0.077 gNH4+/Kg of soil) and in nitrate nitrogen (from 0.198 gNO3-/Kg of soil in 2021 to 0.060 gNO3-/Kg of soil in 2022 with a maximum concentration of 0.447 gNO3-/Kg of soil).
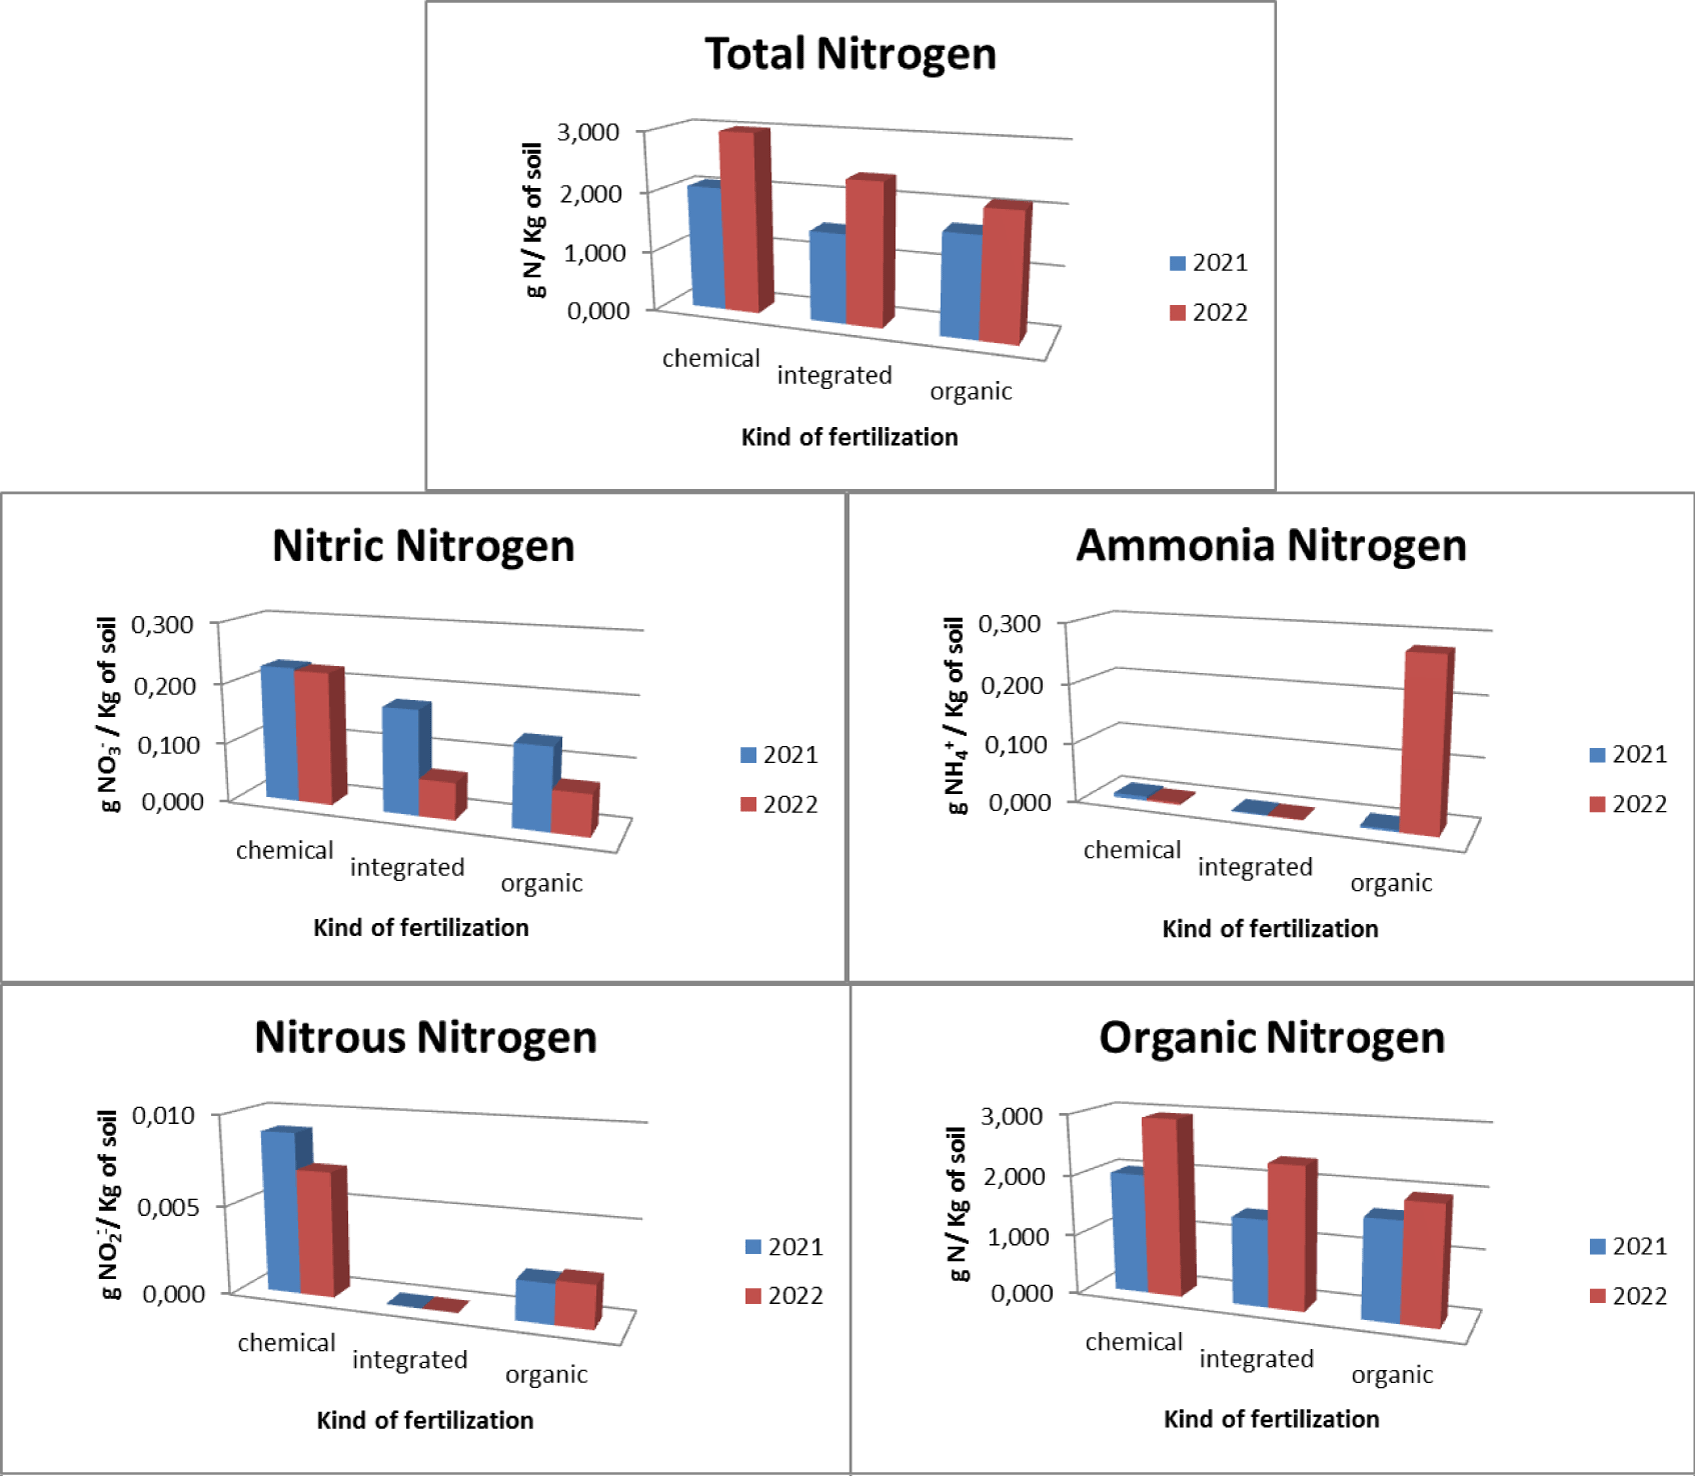
Regarding the olive groves, three types of fertilization were used: chemical, integrated and organic. In relation to chemical fertilization, it was found that there was an average total nitrogen presence in the soil equal to 2.533 gN/Kg with 0.224 gNO3-/Kg of soil nitric nitrogen, 0.005 gNH4+/Kg of soil ammonia nitrogen, 0.008 gNO2-/ Kg of soil nitrous nitrogen and 2.475 gN/Kg of soil organic nitrogen. In relation to the integrated method, it was found that there is an average total nitrogen presence in the soil equal to 1.927 gN/Kg with 0.118 gNO3-/Kg of soil nitrate nitrogen, 0.001 gNH4+/Kg of soil ammonia nitrogen, absence of nitrous nitrogen and 1,899 gN/Kg of soil organic nitrogen. With regard to organic fertilization, it was found that there is an average total nitrogen presence in the soil equal to 1.879 gN/Kg with 0.103 gNO3-/Kg of soil nitric nitrogen, 0.142 gNH4+/Kg of soil ammonia nitrogen, 0.002 gNO2-/ Kg of soil nitrous nitrogen and 1.788 gN/Kg of soil organic nitrogen (Figure 10).
The pre- and post-treatment analysis highlighted how (Figure 11), as regards the use of chemical fertilizers, there is an increase in the presence of total nitrogen which goes from a concentration of 2.065 gN/Kg of soil in 2021 to a concentration of 3.000 gN/Kg of soil in 2022 with a maximum concentration found of 3,000 gN/Kg of soil. There was an increase in the concentration of organic nitrogen (from 2.006 gN/Kg of soil in 2021 to 2.945 gN/Kg of soil in 2022 with a maximum concentration found of 2.952 gN/Kg of soil), a decrease in the concentration of ammonia nitrogen (from 0.007 gNH4+/Kg of soil in 2021 to 0.004 gNH4+/Kg of soil in 2022 with a maximum concentration of 0.012 gNH4+/Kg of soil), nitrous nitrogen (from 0.009 gNO2-/Kg of soil in 2021 to 0.007 gNO2-/Kg of soil in 2022 with a maximum concentration of 0.018 gNO2-/Kg of soil) and nitrate nitrogen (from 0.226 gNO3-/Kg of soil in 2021 to 0.222 gNO3-/Kg of soil in 2022 with a maximum concentration of at 0.314 gNO3-/Kg of soil).
As regards the use of integrated fertilization, there is an increase in the presence of total nitrogen which goes from a concentration of 1.487 gN/Kg of soil in 2021 to a concentration of 2.367 gN/Kg of soil in 2021 with a maximum concentration of at 3,440 gN/Kg of soil. There is an increase in the concentration of organic nitrogen (from 1.446 gN/Kg of soil in 2021 to 2.352 gN/Kg of soil in 2022 with a maximum concentration of 3.425 gN/Kg of soil), a decrease in the presence of nitrate nitrogen (from 0.174 gNO3-/Kg of soil in 2021 to 0.062 gNO3-/Kg of soil in 2022 with a maximum concentration of 0.328 gNO3-/Kg of soil) and ammonia nitrogen (from 0.002 gNH4+/Kg of soil in 2021 to 0.001 gNH4+/Kg of soil in 2022 with a maximum concentration of 0.003 gNH4+/Kg of soil) and absence of nitrous nitrogen. As regards the use of organic fertilization, there is an increase in the presence of total nitrogen equal to 1,668 gN/Kg of soil in 2021 and 2,090 gN/Kg of soil in 2022 with a maximum concentration of 3,000 gN/Kg of soil. There was an increase in organic nitrogen (1.634 gN/Kg of soil in 2021 and 1.942 gN/Kg of soil in 2022 with a maximum concentration of 2.962 gN/Kg of soil) and ammonia nitrogen (from 0.004 gNH4+/Kg of soil in 2021 to 0.280 gNH4+/Kg of soil in 2022 with a maximum concentration of 1.394 gNH4+/Kg of soil). There is a decrease in nitrate nitrogen (from 0.136 gNO3-/Kg of soil in 2021 to 0.069 gNO3-/Kg of soil in 2022 with a maximum concentration of 0.177 gNO3-/Kg of soil), while nitrous nitrogen remains constant (0.002 gNO2-/Kg of soil with a maximum concentration of 0.009 gNO2-/Kg of soil).
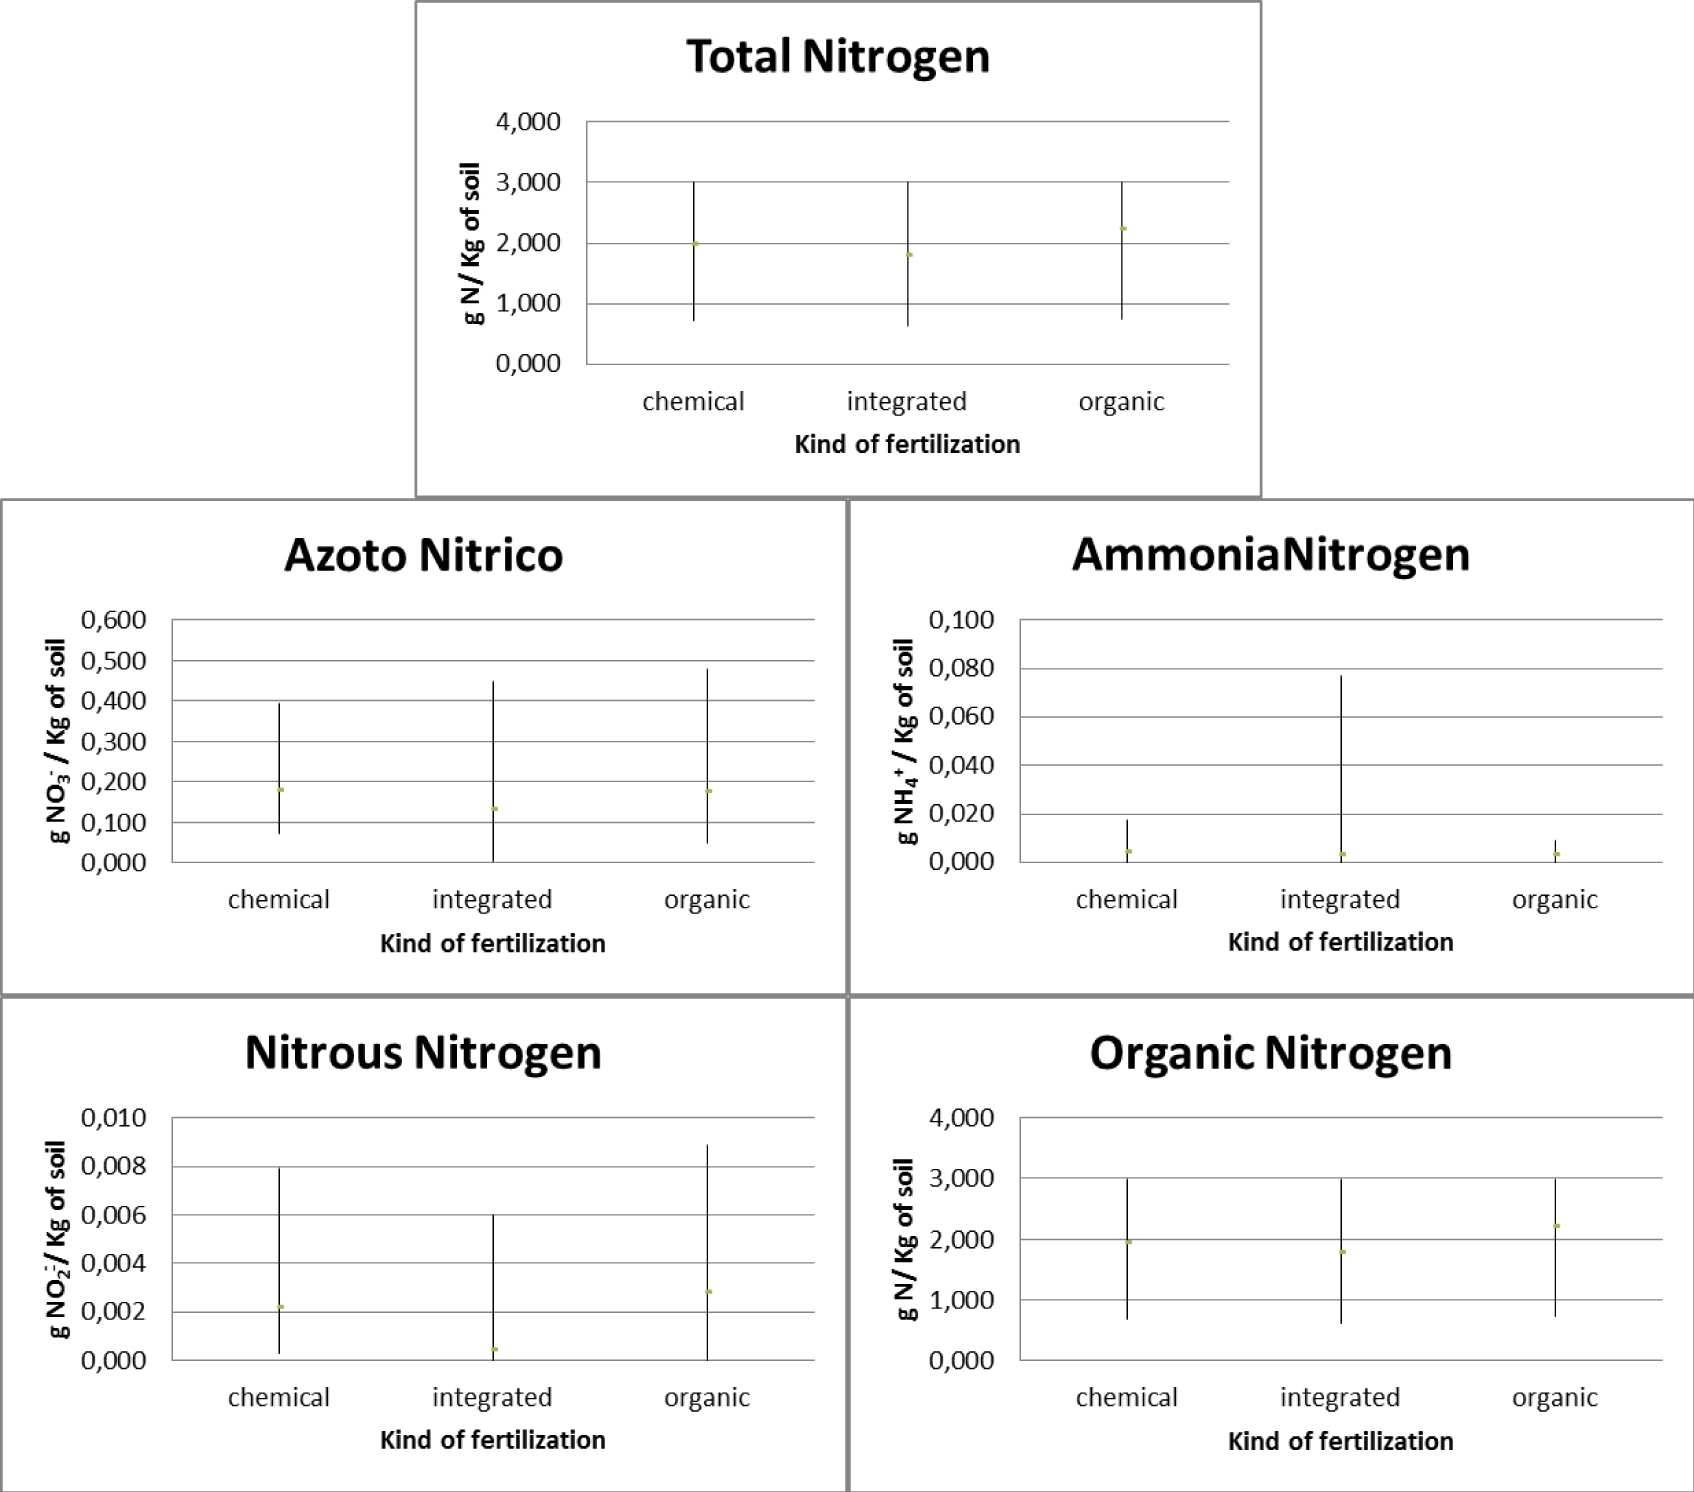
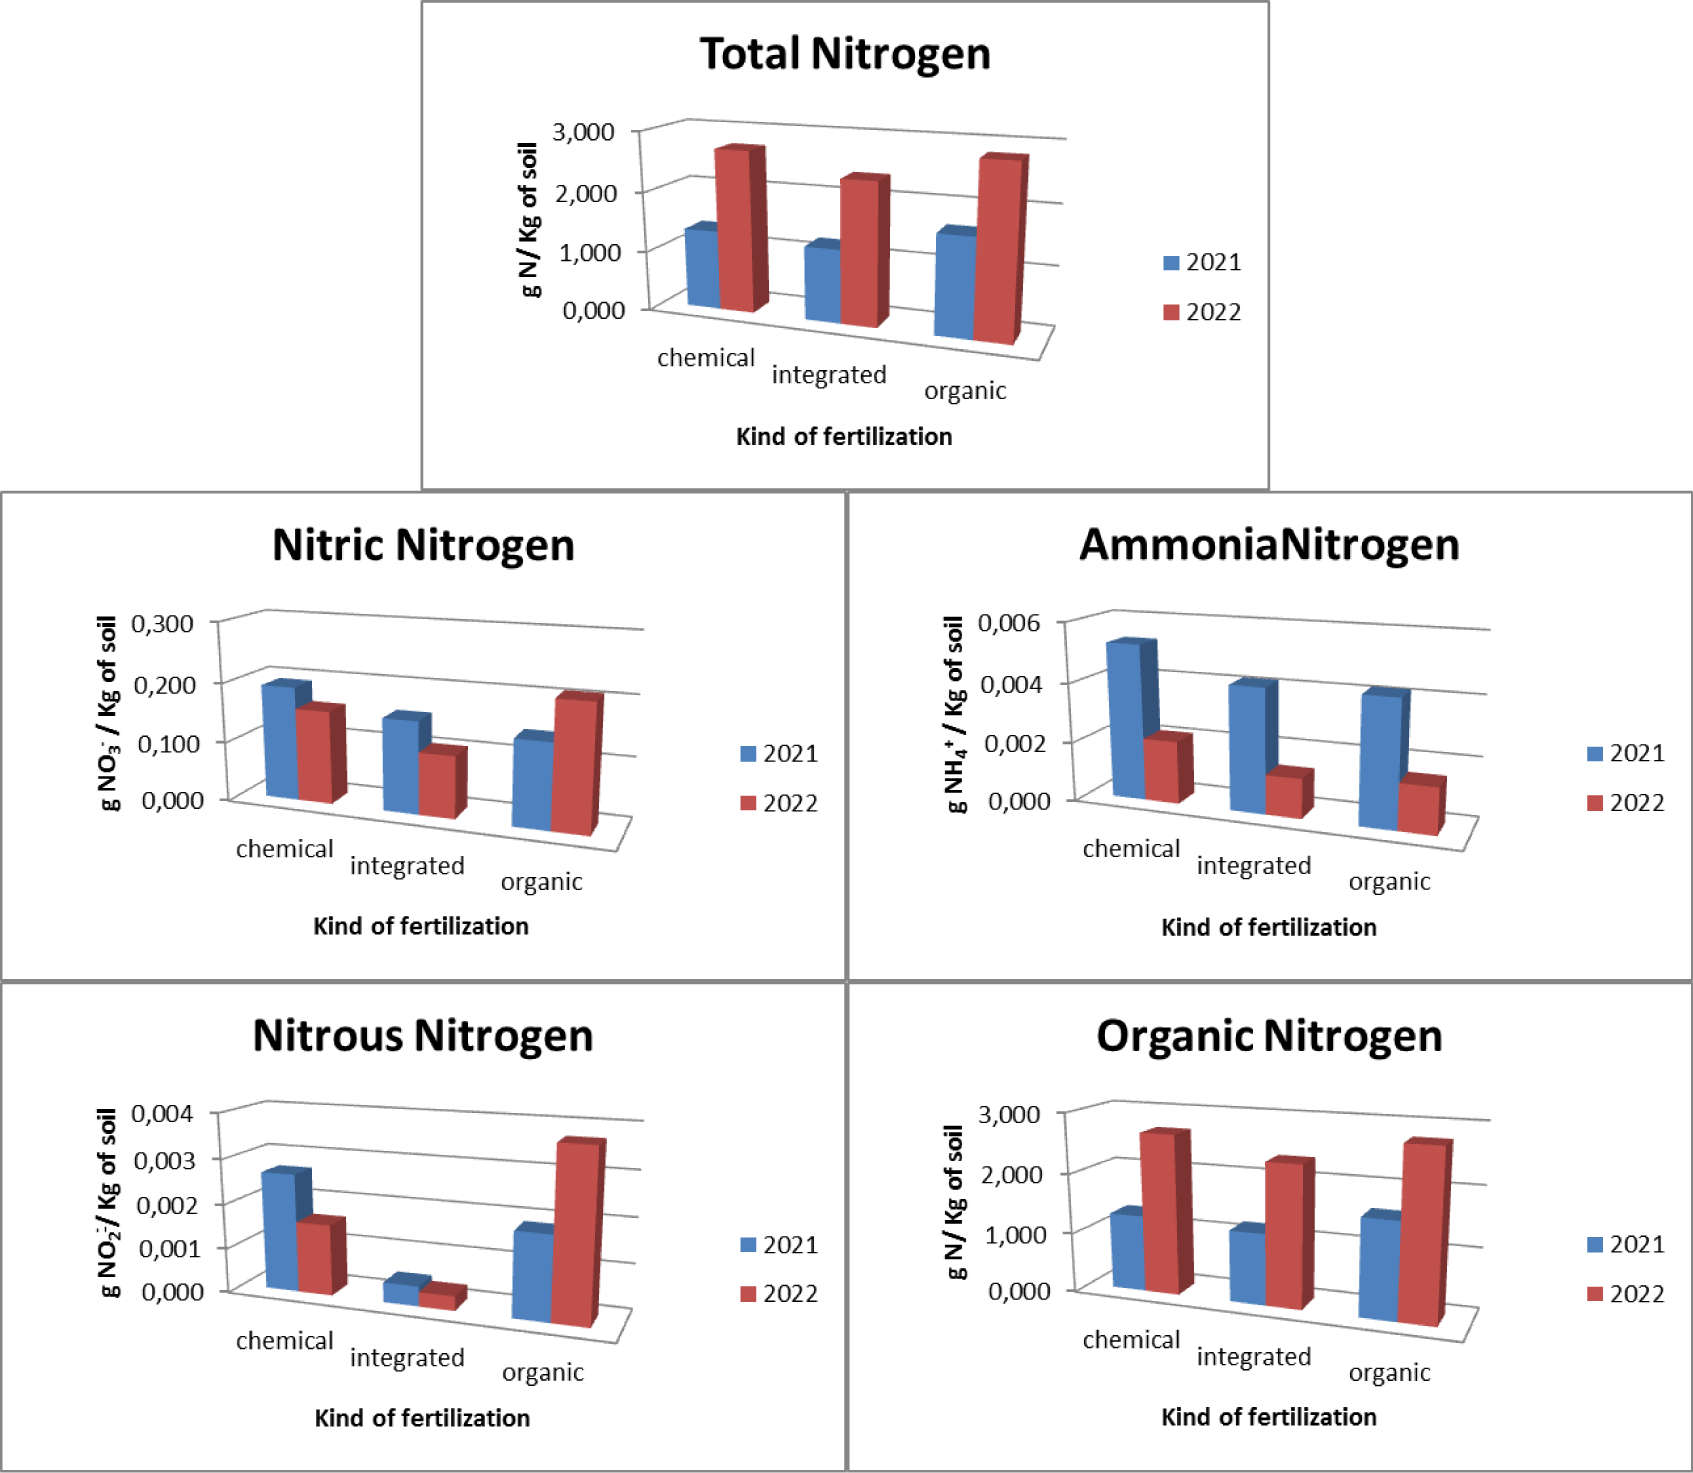
Regarding the vineyards, three types of fertilizers were used: chemical, integrated and organic. In relation to chemical fertilization, it was found that there was an average total nitrogen presence in the soil equal to 1.971 gN/Kg with 0.175 gNO3-/Kg of soil nitric nitrogen, 0.004 gNH4+/Kg of soil ammonia nitrogen, 0.002 gNO2-/ Kg of soil nitrous nitrogen and 1.282 gN/Kg of soil organic nitrogen. In relation to the integrated method, it was found that there was an average total nitrogen presence in the soil equal to 1.797 gN/Kg with 0.129 gNO3-/Kg of soil nitrate nitrogen soil, 0.003 gNH4+/Kg of soil ammonia nitrogen, absence of nitrous nitrogen and 1,766 gN/Kg of soil organic nitrogen. With regard to organic fertilization, it was found that there is an average total nitrogen presence in the soil equal to 2.226 gN/Kg with 0.175 gNO3-/Kg of soil nitric nitrogen, 0.003 gNH4+/Kg of soil ammonia nitrogen, 0.003 gNO2-/Kg of soil nitrous nitrogen and 2.184 gN/Kg of soil organic nitrogen (Figure 12).
The pre- and post-treatment analysis highlighted how (Figure 13), as regards the use of chemical fertilizers, there is an increase in the presence of total nitrogen which goes from a concentration of 1.331 gN/Kg of soil in 2021 to a concentration of 2.709 gN/Kg of soil in 2022 with a maximum concentration found of 3,000 gN/Kg of soil. There was an increase in the concentration of organic nitrogen (from 1.282 gN/Kg of soil in 2021 to 2.672 gN/Kg of soil in 2022 with a maximum concentration found of 2.979 gN/Kg of soil), a decrease in the concentration of ammonia nitrogen (from 0.005 gNH4+/Kg of soil in 2021 to 0.002 gNH4+/Kg of soil in 2022 with a maximum concentration of 0.018 gNH4+/Kg of soil), nitrous nitrogen (from 0.003 gNO2-/Kg of soil in 2021 to 0.002 gNO2 -/Kg of soil in 2022 with a maximum concentration of 0.008 gNO2-/Kg of soil) and nitrate nitrogen (from 0.192 gNO3-/Kg of soil in 2021 to 0.156 gNO3-/Kg of soil in 2022 with a maximum concentration of at 0.394 gNO3-/Kg of soil).
As regards the use of integrated fertilization, there is an increase in the presence of total nitrogen which goes from a concentration of 1.226 gN/Kg of soil in 2021 to a concentration of 2.368 gN/Kg of soil in 2021 with a maximum concentration of at 3,000 gN/Kg of soil. There is an increase in the concentration of organic nitrogen (from 1,190 gN/Kg of soil in 2021 to 2,343 gN/Kg of soil in 2022 with a maximum concentration of 2,988 gN/Kg of soil), a decrease in the presence of nitrate nitrogen (from 0.154 gNO3-/Kg of soil in 2021 to 0.104 gNO3- gNO3-/Kg of soil in 2022 with a maximum concentration of 0.447 gNO3-/Kg of soil) and ammonia nitrogen (from 0.004 gNH4+/Kg of soil in 2021 to 0.001 gNH4+/Kg of soil in 2022 with a maximum concentration of 0.077 gNH4+/Kg of soil) and absence of nitrous nitrogen. As regards the use of organic fertilization, there is an increase in the presence of total nitrogen equal to 1,637 gN/Kg of soil in 2021 and 2,816 gN/Kg of soil in 2022 with a maximum concentration equal to 3,000 gN/Kg of soil. There was an increase in organic nitrogen (1.601 gN/Kg of soil in 2021 and 2.766 gN/Kg of soil in 2022 with a maximum concentration of 2.977 gN/Kg of soil), nitrous nitrogen (from 0.002 gNO2-/Kg of soil in 2021 to 0.004 gNO2-/Kg of soil in 2022 with a maximum concentration of 0.009 gNO2-/Kg of soil) and nitrate nitrogen (from 0.141 gNO3-/Kg of soil in 2021 to 0.208 gNO3-/ Kg of soil in 2022 with a maximum concentration of 0.478 gNO3-/Kg of soil). There is a decrease in ammonia nitrogen (from 0.004 gNH4+/Kg of soil in 2021 to 0.002 gNH4+/Kg of soil in 2022 with a maximum concentration of 0.009 gNH4+/Kg of soil).
Conclusion
The analysis carried out demonstrated that in relation to the concentration of total nitrogen in the soil, all crops are below the standard concentrations of uncultivated soil except horticultural crops where in most cases higher concentrations are found. Relative to the different forms of nitrogen found in the soil, organic nitrogen reflects the trend of total nitrogen. With regards to nitrate nitrogen, the natural concentrations of all crops are exceeded. As regards ammonia nitrogen, the exceedance occurs only for olive groves and finally for nitrous nitrogen, the exceedance occurs only for horticultural crops.
Regarding the supply of nitrogenous substances following fertilization, it is noted that the quantities of total nitrogen in all crops are in surplus, thus increasing the quantity of nitrogen that remains in the soil and which could lead to contamination of the groundwater following leaching. . In particular, of particular attention is the considerable quantity of nitric nitrogen that remains in the soil following fertilization in vegetable fields and of the same magnitude the concentration of ammonia nitrogen that remains in soils with olive groves, this compound in fact could potentially have an impact on its conversion to nitrate nitrogen).
In relation to the different types of fertilization, it can be concluded that in relation to fields with orchards, chemical fertilization has a particular impact on the environment, with particular accumulation of nitrous nitrogen, and integrated fertilization with particular accumulation of ammonia nitrogen, while organic fertilization is good both for dosage and for quality and quantity of compounds that remain in the soil. The same situation is found for horticultural crops where in this case mineral fertilization is good. However, as regards fields with arable land, both fertilizations have a potential impact on the environment. In fact, integrated fertilization presents a more abundant concentration of nitrous nitrogen after treatment while organic fertilization presents an increase in the concentration of nitrous nitrogen. Fields with olive groves, however, have highlighted how organic fertilization releases a surplus of ammonia nitrogen with excessive doses while chemical and integrated fertilizations are optimal. Same consideration for vineyards where, however, the accumulation in the soil is related to nitrate nitrogen and nitrous nitrogen.
These conclusions highlight the need to:
- In relation to the types of crops, remodulate the quantity of nitrogen used, in particular for horticulture, reducing the quantities of fertilization.
- Regarding the types of fertilization in order to reduce the environmental impact, a conversion to organic fertilization is essential for orchards, horticulture, arable crops, even if in the latter case it is necessary to reduce the quantities which in any case are much more high in relation to the needs of the crops, and for the olive groves, once again decreasing the quantities by paying particular attention to the concentrations of ammonia nitrogen introduced, in relation to the vineyards an integrated fertilization is much more suitable.
References
- Calabrese A, Mandrelli L, Blonda M. Earlier observation of applicability of bio molecular and chemical analysis to soil and shallow groundwater in nitrogen biogeochemical local cycle evaluation. IOSR Journal of Biotechnology and Biochemistry. 2020;6(1):59-69. doi: 10.9790/264X-0601015869.
- Calabrese A, Mandrelli L, Loi E, Blonda M. Chemical and microbiological characterization of soil under different agronomical use and practical: first focus on nitrogen cycles. IOSR Journal of Biotechnology and Biochemistry. 2020;6(3):45-57. doi: 10.9790/264X-0603024557.
- Luca M, valquiria B, casali L, manoj S, Dario B, fabrizia G, jonas B, stefano C, shemchuk O, sharma L, honer K, grepioni F. Multifunctional urea cocrystal with combined ureolysis and nitrification inhibiting capabilities for enhanced nitrogen management. ACS Sustainable Chem Eng. 2019;7:2852-2859. doi: 10.1021/acssuschemeng.9b02607.
- Galloway JN, dentener FJ, capone DG, boyer EW, howarth RW, seitzinger SP, asner GP, cleveland CC, green PA, holland EA, karl DM, michaels AF, porter JH, townsend AR, vöosmarty CJ. Nitrogen cycles: Past present and future. Biogeochem. 2004;70:153-226. doi: 10.1007/s10533-004-0370-0.
- Canfield DE, Glazer AN, Falkowski PG. The evolution and future of Earth's nitrogen cycle. Science. 2010 Oct 8;330(6001):192-6. doi: 10.1126/science.1186120. PMID: 20929768.
- Remoundakia E, Vasileiou E, Philippou A, Perrakic M, Kousi P, Hatzikioseyian A. Groundwater deterioration: The simultaneous effects of intense agricultural activity and heavy metals in soil. Procedia Engineering. 2016;162:545-552.
- Gorla M. Identificazione dei nitrati. Dario Flaccovio Editore.2014.
- Kanownik W, Policht-Latawiec A, Fudała W, Nutrient pollutants in surface water-assessing trends in drinking water resource quality for a regional city in central europe. Sustainability. 2019;11(7):19-88. doi: 10.3390/su11071988.
- Smith RA, Alexander RB, Wolman MG. Water quality trends in the nation’s rivers. Science1987;235:1607-1615. doi: 10.1126/science.235.4796.1607.
- William FB. Acid-base chemistry. William F, Bleam, editors. Soil and environmental chemistry. Academic press. 2012;257-319.
- Marsala RZ, Capri E, Russo E, Barazzoni L, Peroncini E, CremaM, labarta RC, otero N, CollaR, Calliera M , Chiara fontanella M, Alina Suciu N. Influence of nitrogen-based fertilization on nitrates occurrence in groundwater of hilly vineyards. Science of the Total Environment. 2021;766:144-512. doi: 10.1016/j.scitotenv.2020.144512.
- Heeb A, Lundegårdh B, Ericsson T, Savage GP. Effects of nitrate-, ammonium-, and organic-nitrogen-based fertilizers on growth and yield of tomatoes. Z Pflanzenernähr Bodenk. 2005;168:123-129. doi: 10.1002/jpln.200420420.
- Serpil S. Investigation of effect of chemical fertilizers on environment. APCBEE Procedia. 2012;1:287-292. doi: 10.1016/j.apcbee.2012.03.047.
- Ministry of the environment to parliament report on the state of the environment 2001.
- Prasad R. Efficient fertilizer use: The key to food security and better environment. Journal of Tropical Agriculture. 2009;47(1-2):1-17.
- Pahalvi HN, Rafiya L, Rashid S, Nisar B, Kamili AN. Chemical fertilizers and their impact on soil health. In Dar, G.H., Bhat, R.A., Mehmood, MA. Hakeem, K.R. (eds) Microbiota and Biofertilizers. 2021:2. Springer, Cham. doi: 10.1007/978-3-030-61010-4.
- Kaur K, Kapoor KK, Gupta A P. Impact of organic manures with and without mineral fertilizers on soil chemical and biological properties under tropical conditions. Journal Plant Nutrition and Soil Science. 2005;168:117-122. doi: 10.1002/jpln.200421442.
- Bargaz A, Lyamlouli K, Chtouki M, Zeroual Y, Dhiba D. Soil microbial resources for improving fertilizers efficiency in an integrated plant nutrient management system. Front microbiol. 2018 Jul 31;9:1606. doi: 10.3389/fmicb.2018.01606. PMID: 30108553; PMCID: PMC6079243.
- Bokhtiar SM, Sakurai K. Effects of organic manure and chemical fertilizer on soil fertility and productivity of plant and ratoon crops of sugarcane. Archives of Agronomy and Soil Science. 2005;51:325-334. doi: 10.1080/03650340500098006.
Content Alerts
SignUp to our
Content alerts.
 This work is licensed under a Creative Commons Attribution 4.0 International License.


